How to give a good oral presentation at an academic conference?

Today, I will discuss the topic of how to give a good oral presentation of your research at academic cconferences. This is a very important topic since if a presentation is interesting, more researchers will be interested in your work and it may bring several opportunities such as collaborations with other researchers.  So let’s get started!

The key points to giving a good presentations are the following:

1) Prepare your presentation early

The first key point  is to prepare your presentation well in advance before the date of the presentation. In other words, you should not create your PowerPoint the night before.  Preparing your presentation in advance will let you avoid underestimating the required time for preparation and for rehearshing, and thus ensure that you  have a good sleep before the presentation. If your presentation is ready a few days before the date, it will also give you more time to rehearse your presentation, which lead us to the next point.

2) Rehearsal is always needed

One should always rehearse before giving a presentation, although the amount of time necessary may vary. Typically, I will rehearse my presentation at least a few times in the hotel room the day before giving a presentation at a conference. But depending on how much experience you have, it may be safer to rehearse a few days before the date.  If you are new to doing academic presentations, it is recommended to first rehearse a few times by yourself  and then to rehearse at least once in front of your research advisor or your colleagues. You may also practice about how to answer questions with your colleagues, because most academic presentations are followed by questions from the audience.

If your native language is not English, it is important to rehearse even more. This will help you to feel more comfortable speaking in English and it will allow you to avoid searching for your words and hesitating during the live presentation. Besides, you may practice pronuncing some  difficult words before the presentation. I have seen a few times that a presenter did not know how to pronunce a word or pronunced it incorrectly, especially for math terms.

3) Know your audience 

Another important point is to know who your audience is. Are you presenting in front of experts in your very specific field or a crowd of researchers that may not be very familiar with your topic?  For example, if you are working on data mining algorithms, it is not the same if you present your work at a data mining conference where everyone is familiar with at least basic data mining concepts, an artificial intelligence conference or a general computer science conference. It is important to know your audience because in general, any kind of oral presentations should be adapted to its audience. For example, if you are sure that the audience is familiar with some basic concepts in your field, you do not need to explain them. Or if you think they are not familiar with some topics you may give further explanations.

4) Define your goal, and organize your presentation well

A related point is to clearly know what is the goal of your presentation.  What do you want the audience to understand and remember about your work? If you had an infinite amount of time, you could describe your research in very deep details. However, in reality there is always a time limit. For example, at a conference, organizers may give you 15 minutes to present your research. So what should you present during these 15 minutes? Personnally, my goal in such a conference presentation is to give an overview of the research. I want the audience to clearly understand the problem that I want to solve, then I give a rough overview of the technical solution with emphasis on what is new but without going in deep technical details or mathematic formulas. And then, I present experimental results and conclusion.  My goal is to make the audience understand the problem, what are the main originalities and the results. If they want to read the deep technical details, proofs of theorems, etc., they may read the conference paper, ask me questions or discuss with me after the presentation for more details. I have often seen some researchers showing slides full of mathematic formulas with many different symbols. In some field, it may be ok to do that. But insome other fields, you may lost your audience if you give too many technical details such as that.

A good organization for your presentation is important. To present a paper at a conference, the presentation may roughly follow the sections of your paper. The key parts are:

  • Introduction, related work, problem statement:  introduce yourself, the topic, and then slowly introduce related work, their limitations and then the problem that you want to solve. You may show some example of the problem that you want to solve
  • Your solution: explain how you have solved the problem
  • Experimental validation: this is to show that your solution is good to solve the research problem
  • Conclusion: A good conclusion should summarize the key points of your presentations (problem, key characteristics of your solution, key experimental results) and then you may talk about limitations and future work. The conclusion is very important. You can think of the conclusion as what are the key points that you want your audience to remember.

5) Test your presentation and prepare solutions for technical problems

Preferably, you should test your presentations in the environment where you will present before the presentations to avoid issues such as software incompatibility issues. Some common problems are:

  • fonts in your Powerpoint presentation are not available on the provided computer (you may solve this problem by embedding them).
  • videos in your presentation are not playing properly (e.g. problems with codecs, etc. – generally it may be better to avoid using videos),
  • the provided computer uses a different software such as Open-Office and your presentation don’t look the same (a solution is to bring with  a PDF version of your presentation with you, just in case)
  • you may need a special cable to  plug your laptop to the video projector (e.g. for Apple computers)

Personnally, I bring my laptop, and a USB stick with a Powerpoint and also a PDF version of my presentation, just in case. I may also send one copy of my presentation to my e-mail just in case. Also, I try to arrive a little bit earlier  to be able to test my presentation on the provided computer if I cannot use my laptop.

6) Make your presentation interesting and interact with your audience

I have seen many boring presentations  at academic conferences, not because the topic was boring but because of a poor presentation. Some key points to make a good presentation:

  • Arrive early at the presentation. Just before starting your presentation, look at the audience, smile at them. This will help you get more comfortable and kill the nervousness. Also breath well. If you are well-prepared,  everything will go well.
  • Talk to your audience. Do not read your presentation. Otherwise, the audience will quickly lose interest.  If you are using Powerpoint, you should not put very long sentences in your slides. You should instead only write some very short lines  and use them as key points to remember where you are in your presentation rather than as a text to be read. The text may just be some part of sentences rather than full sentences.
  • Always look at your audience.  Look around at the audience as you keep talking by making eye-contact with the audience to keep them interested. Do not always look at the same person (e.g organizer) but look at the whole audience.  You may sometimes give a quick look at your laptop to see at which slide you are in your presentation.
  • Never turn your back to the audience. Turning your back to the audience is one of the worst thing that a presenter can do. In some cases, it may be ok to turn your back for a few seconds to briefly show something using a laser pointer  but never do it for more than few seconds, and preferably use the mouse instead of turning your back.  
  • Avoid doing a presentation while sitting. Some people like to sit to give a presentation. But standing will  result in a better presentation and you can move more freely and people will see you better if you stand up than if you are sitting. Also stand straight and firm. Have confidence. Avoid unecessary movements that can annoy the audience such a playing with a pen in your hand while talking. Make sure that you are not standing in front of the screen so that people can see your slides.
  • Avoid using too complicated words or a too large vocabulary. Try to explain your research using simple words. This will allow everyone to better understand, especially for non native speakers.
  • Don’t speak too fast.  The goal is not  to explain your whole paper in a short amount of time. But it is to give the main idea about your research. If people are interested in your research they may talk with you after the presentation or read your paper. So carefully select the content beforehand so that you don’t have to speak very fast.  Usually, as a rough estimate, I prepare 1 Powerpoint slide for each minute of my presentation (but I also rehearse to check if the time is fine).
  • You may use some techniques such as changing the tone of your voice to emphasize some words and break monotony. You may also consider telling a short story in the introduction to raise interest in your problem.
  • Analyse the reaction of your audience. If they look like they are not understanding, you may need to give a few more explanations. If you are not sure, you may ask if everyone understood your explanation (e.g. “is that clear?”). If you feel like they are bored because explanations are too simple, maybe you can skip some basic explanations.
  • Speak loud enough.

7) Other advices

A few more advices:

  • Keep your presentation simple. from a technical point of view. It may be tempting to use all the features offered in Powerpoint such as animations, transitions, sound effects, videos, etc. But most of these will just distract your audience and should thus be avoided. Sometimes, animations may be helpful. But only use them when they are really necessary to help understanding.
  • Take the time to design your Powerpoint slides well.  For example, rather than just copying and pasting illustrations from your paper into your slides, you may adapt them so that they look better for a presentation. You should avoid putting too much text on a slide or too many bullet points. Slides should also have a clear title. Do not use too many different fonts, colors. Adding some pictures may make your presentation more interesting. But use them well, when they help to understand  and do not put too many of them.
  • It is great to spend time to create a great Powerpoint. But rehearsing is as important.  Therefore, avoid the mistake of spending too much time to create a great Powerpoint but not rehearsing enough.
  • After a presentation, the audience should generally be given a few minute to ask you some questions. Make sure that you understand a question well before answering it. If someone ask you a question and you don’t understand it, you may ask them to repeat it. Besides, if a question is too complicated to answer or if the person is not able to answer you may just say to come talk to you later (e.g. during the coffee break) to discuss it with you.

There is obviously much more that could be said on this topic. If you  present your work for the first time at an academic conference, it is normal to be nervous. But the solution is to prepare yourself well. If you are well-prepared everythng should be fine.

—–

That is all I wanted to write for now. If you like this blog, you can tweet about it and/or subscribe to my twitter account @philfv to get notified about new posts.

Philippe Fournier-Viger is a professor of Computer Science and also the founder of the open-source data mining software SPMF, offering more than 52 data mining algorithms.

Posted in Conference, General, Research, Uncategorized | 4 Comments

Brief report about the ADMA 2014 conference

In this blog post, I will discuss my current trip to the ADMA 2014 conference (10th Intern. Conf. on Advanced Data Mining and Applications in China (December 19-21 2014 in Guilin, China). Note that the views expressed in this post are my personal opinion/interpretation about what I have attended at this conference.

adma2014 conference

Overal impression

There was many interesting paper presentations this year. The conference had a day of workshop and two days of regular conference papers. Overall, the conference was very enjoyable since it is focused on data mining. The location of the conference was also very good in Guilin, reportedly one of the most beautiful place in China.

Guilin, China (pictures obtained on ADMA website)

Guilin, China (pictures obtained on ADMA website)

Impact of the ADMA conference

ADMA is one of the top data mining conferences in Asia. It is certainly not as popular as PAKDD. But it was said at the opening ceremony that in terms of impact (measured by average citations / paper), ADMA had more impact than PAKDD during the last maybe 5 or 10 years, which is surprising but also great for this conference.  It was suggested that one of the reason for this high impact may be that ADMA also accepts applied data mining papers (hence the name ADMA: Advanced Data Mining and Applications), while these papers may be less welcome in some other data mining conferences.

Keynote speech by Osmar Zaiane about Big Data (slides)

There was a very interesting keynote speech given by O. Z. at the conference about big data. I will try to report here the main ideas.

First, O.Z. said that he don’t really like the word “big data” (he prefers Rich Data). By looking at Google Trends, he has shown  that the term “big data” may just be a convenient  replacement term for “data mining“. In Google Trends, we can see that as the interest in “data mining” decreases, the interest in “big data” increases.   It is suggested that one of the reason why the term “data mining” has lost some interest is that it is because of the bad reputation of data mining in the media following the events of 9/11.  OZ also compared big data with other terms such as “business intelligence”, saying that unlike “big data”, the term of “business intelligence never really took off but it could have.
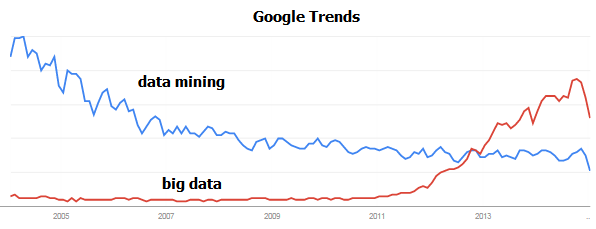
Google trends: big data vs data mining

Google trends: big data vs data mining

Several statistics were shown that indicates that there is currently a huge hype around big data. The market was evaluated at more than 14 billion $ USD in 2014 and most of the top companies in US are convinced now that they MUST use big data to stay competitive according to some surveys.  There is therefore a very huge HYPE around big data. It seems that everybody wants to do big data but maybe it is not always for a good reason or not everybody know why it is appropriate or not.

This hype can be compared with the huge hype that occurred around artificial intelligence in the 1970 and end of 1980. Following this hype, there was the AI WINTERS during which people lost interest in AI because there were just too many expectations built on the hype and these expectations could not be met.  It was said that a kind of AI winter could happen in the near future for big data because of this huge hype currently happening.  And I have to say that I agree about this.

The hype cycle of research and technology is known as the Gartner Hype Cycle. During the AI winters, although a lot of people lost interest in AI, there was always a core group of believer who continued to work on AI despite having less funding. These people have kept AI research alive during this winter.  About this observation, my opinion is that it is important to not just jump on the big data trend and forget other important topics of data mining just because of the hype on big data. We certainly have not solved all the problems about “small data” yet.
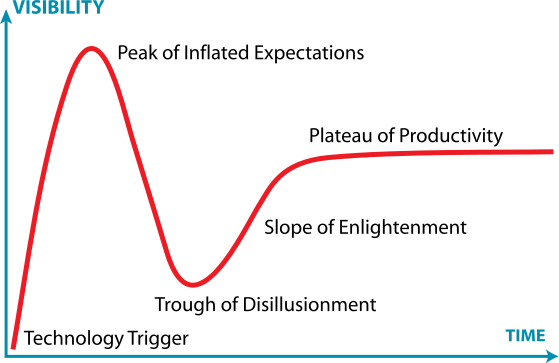
Gartner Hype Cycle

Gartner Hype Cycle

Another interesting point in this talk is a metaphore about an Elephant and blind peoples based on an old story from China/India. Imagine that several blind peoples are in a room and touching an elephant. Different people may touch different parts of the elephant and have different conclusions about what it is. But none of them can see the global picture. Companies may currently not see the big picture about big data and just jump on the hype because other companies say that it is important. For example, too many people focus on the size of data to define what is big data, while there is many other important characteristics of big data that should not be overlooked
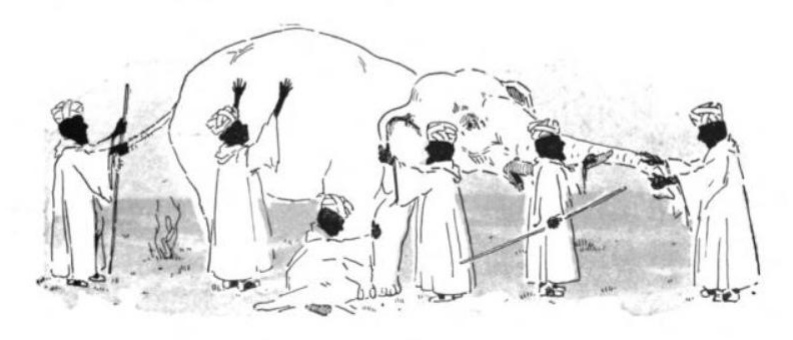
Elephant and blind men (wikipedia)

Elephant and blind men (wikipedia)

Some important characteristics of big data are that  (1) the data is complex, that (2) we need to solve complex problems requiring machine learning, (3) that we need to integrate various data sources of data that may be heterogeneous and conflictual, (4) that the data may have high velocity, that is coming at high speed (e.g. stream) and that we may need to react very quickly to this data to take decisions, (5)  that we may need to assess the reliability of the data, etc.

A challenge is also that data does not provide meaning.  Even if we have huge amount of data, it does not mean that we can understand the meaning behind it. So we should always consider the context of the data (metadata) to interpret it properly.  An interesting story to illustrate this point is the following. Consider an alien that is coming to earth and that observe humans. The alien may conclude that humans have on average one breast and one testicle. However, this is completely missing the point that there are two genders (male/female). Thus, data as said above does not provide meaning. It is necessary to use critical thinking and context to understand data and perform data analytics.

Another very interesting example to illustrate this point is the “Francis Anscombe Quartet“. It is a set of four datasets proposed by Francis Anscombe. These datasets have exactly the same main statistical properties (mean of x = 9, variance = 11, mean of y = 7.5, correlation = 0.816 and same linear regression line. However, these datasets are VERY different if we visualize them in a two dimensional space because of outliers (see picture below). Thus, this example shows that we also need to work on visualization techniques to better understand the data and not just focus on statistical properties that may be misleading.
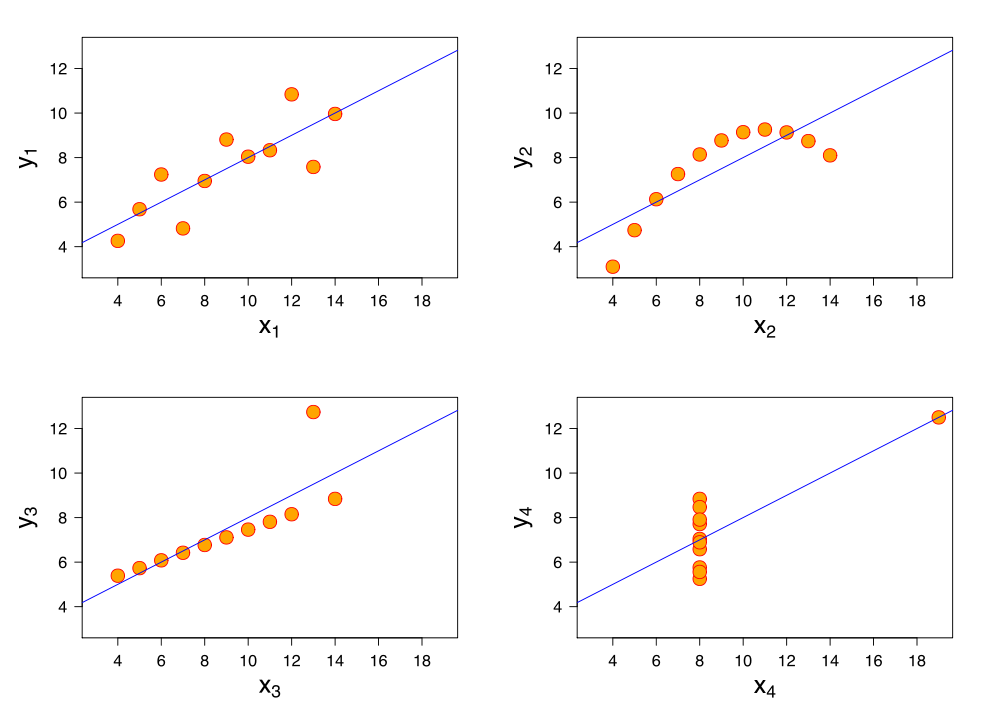
Francis Anscombe quartet

Francis Anscombe quartet

Another important challenge about big data is “data integration“. An interesting story about this is the story of NetFlix. As most of you probably know, there is a big company for movies renting in the USA that is named NetFlix. This company uses a recommender system to recommend movies to users.  A few years ago, NetFlix launched a contest for researchers. The goal was to beat their recommender system by 10 % more accuracy to win 1 million $.  However, there was a constraint that participants had to use the provided dataset but could not use any external source of data. The result is that solutions where very complex and have never been used into practice by Netflix, although some of them achieved the 10% improvement. The lesson from this story is that it would have been probably much easier to solve this problem by using external sources of information such as the IMDB movies database and this could have provided more simple solutions. We should thus not be afraid to use different source of data and perform data integration. Moreover there are several research challenges with respect to data integration such as how to deal with  conflictual information from various sources of data, etc.

Another challenge related to big data is uncertainty. Consider a person that has an online profile that gives away his age and gender. This kind of information are facts. There is no uncertainty. However, consider that this same person buy some swimming watches. A data mining system could infer that this person is most likely a swimmer. However, it is possible that the person bought the swimming watch as a gift. Thus, in this kind of situations, we should also consider the uncertainty in data to perform data analysis.

There was also a discussion about some pitfalls of big data. It is said that we should train more and more data scientists and also that we should train carefully the manager about what to expect from big data so that appropriate tasks are given to data scientists and that expectations are reasonable.

Another pitfall is that it is tempting to try to find a single solution that could be applied to everything. Currently, in big data, many people think that we need to use Map Reduce to do big data or some very trendy technologies such as deep learning. However, it is very difficult to apply Map Reduce to some particular tasks. Thus, we should not just focus on one technology as a solution to every problems.  An interesting analogy is that someone tries to use a screwdriver to fix everything, and even use a screwdriver as a key to start his car. It may works but it is not the most appropriate tool. Actually, we should build some more simple tools that could guide the user to do data analytics without having to learn a lot of complex technologies. It should be as simple as pushing a button. Currently, we can drive a car without understanding everything about how the car works. So why it should not be the same about data analytics?  This will certainly require a lot of work, especially on data vizualization.

In conclusion, yes there is a lot of hype about big data. But there is also a real need because currently there is more and more data, and we need to use this data to make decisions.

Keynote speech by Hui Xiong about Big Data and Mobile Recommender System  (slides)

A great keynote speak was also given by Hui Xiong. I will try to report some ideas that I have found interesting in this keynote.

It was emphasized that key aspects of Big Data is timely observation, timely analysis and timely solution.  What this means is that sometimes we have huge amount of data but we need to make some observation quickly and analyze it very quickly because of time constraints (for example, the user does not want to wait a month to get the result!).

An interesting story about big data is that we can compare it to fishing in a big river.  When a human is fishing in a very small river, it is relatively easy to see the fishes since the water is clear,  and it is also easy to catch the fishes. However, if we consider a larger river such as the Yangtze river in China, we cannot see the fish anymore and we don’t know what fish to catch. This is the situation of big data.

How to handle big data? It was said that some key points about handling big data are the following. First, we should understand the data characteristics. Second, we should carefully select the features and attributes that are relevant for the analysis that we want to perform. We may have a PB of data. But maybe that just a small part of it is relevant. Third, we should also carefully select the instances in the data to be used for performing the analysis.

Also, it is important to understand business goals to find good research problems. It was reported that H.X. only works with real data for research such as Taxi data or travel data.

Now, for mobile recommender system, there are several challenges. First, the time and cost constraints are important. For example, for a travel recommender system, how much time the user has for travelling?  how much can he pay for a travel package? Another challenge is that unlike typical recommender systems such as Collaborative Filtering, in mobile environments, we often need to consider the time dimension or sequence of events. An example that was given to illustrate this point is the work of H.X. about taxi path recommendation (KDD 2009).  The goal of this paper was to recommend sequences of locations to the user rather than performing a single recommendation. Other challenges are that data is not uniformly distributed and that data may be heterogeneous.

There was many other points in this talk. But those are the key points that I have noted.

Next year conference

In the opening ceremony of the conference, it was announced that the ADMA 2015 conference will be held in Shanghai, and ADMA 2016 will be held in Macau the year after (2016)

Best paper awards

Three best paper awards were given at this conference.  Two of them are:

  • Fournier-Viger, P., Wu, C.W., Tseng, V.S. (2014). Novel Concise Representations of High Utility Itemsets using Generator Patterns. Proc. 10th International Conference on Advanced Data Mining and Applications (ADMA 2014), Springer LNCS 8933, pp. 30-43.
                                   (this is my paper! – I’m very happy about that)
  • Strecht, P., Mendes-Moreira, J., Soares, C. (2014). Merging Decision Trees: A Case Study in Predicting Student Performance. Proc. 10th International Conference on Advanced Data Mining and Applications (ADMA 2014), Springer LNCS 8933, pp. 30-43.

And I don’t remember the third one. Besides, a 10th year most influential paper should be announced soon on the website of the conference because the winner was unable to attend the conference.

==

Philippe Fournier-Viger is an assistant professor in Computer Science and also the founder of the open-source data mining software SPMF, offering more than 80 data mining algorithms.

If you like this blog, you can tweet about it and/or subscribe to my twitter account@philfv to get notified about new posts.

Posted in Conference, Data Mining | 6 Comments

Drawing the Powerset of a Set using Java and GraphViz (Hasse Diagram)

In this blog post, I will explain and provide source code to automatically  draw the powerset of a set using Java and GraphViz.  Drawing a powerset is useful in mathematics and also in computer science, for example in frequent itemset mining, it can be used to visualize relationships between itemsets.

What is the powerset of a set?

It can be simply defined as a set and all its subsets.

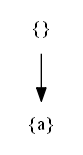
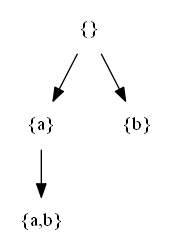
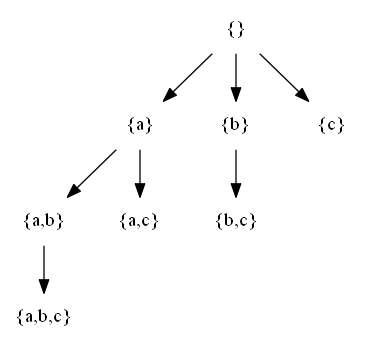
For example, the powerset of the set {1,2,3} is the set { {}, {1}, {2}, {3}, {1,2}, {1,3}, {2,3} {1,2,3}}.  It can be easily demonstrated that the size of a powerset of a set containing n items is 2^n.

How can we draw a powerset?

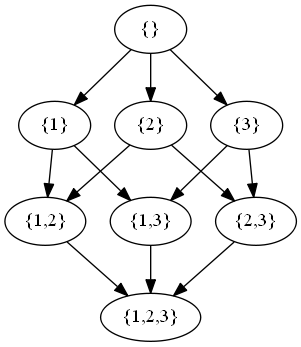
A powerset is often represented as a Hasse Diagram. For the purpose of drawing powersets, a Hasse Diagram can be defined as a diagram where:

  • each vertex is a set from the powerset
  • there is an edge from a set X to a set Y iff  X ⊂ Y and there does not exist a set Z such that X ⊂ Z ⊂ Y

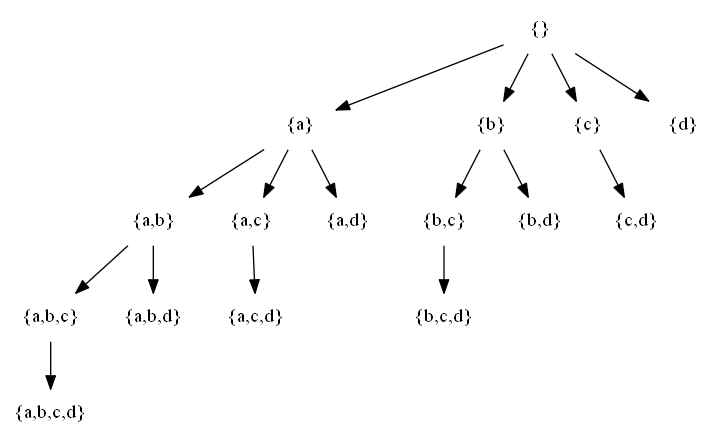
For example, the Hasse diagram of the powerset of {1,2,3} is:

hasse diagram of powerset of {1,2,3}

hasse diagram of powerset of {1,2,3}

Now, I will show how to draw a nice diagram automatically such as the one above.

Step 1.  Generate a GraphViz input file

The first step is to have Java installed on your computer and use the following Java program to generate a GraphViz input file named “input.dot” for the powerset of {a,b,c,d,e}. Note that you can edit the line String[] set = new String[] { “a”, “b”, “c”, “d”, “e” } to draw the powerset of another set. Note also that the Java code below is not fully optimized. But for the purpose of drawing powersets, it is ok.

import java.io.BufferedWriter;
import java.io.FileWriter;
import java.io.IOException;
import java.util.ArrayList;
import java.util.Collections;
import java.util.List;

/**
 * @author Philippe Fournier-Viger, 2014
 */
public class DrawPowerSet {

	public static void main(String[] arg) throws IOException,
			InterruptedException {

		// This is the set of integers that we want to draw the powerset of
		String[] set = new String[] { "a", "b", "c", "d", "e" };

		// output file
		String output = "input.dot";

		// create the file
		BufferedWriter writer = new BufferedWriter(new FileWriter(output));
		writer.write("digraph mygraph{");

		// We will enumerate all the subset
		for (long i = 0, max = 1 << set.length; i < max; i++) {
			// we create a new subset
			List newSet = new ArrayList();
			for (int j = 0; j < set.length; j++) {
				// check if the j bit is set to 1
				int isSet = (int) i & (1 << j); 				if (isSet > 0) {
					// if yes, add it to the set
					newSet.add(set[j]);
				}
			}
			// For the new subset, print links to all supersets
			if (newSet.size() != set.length) {
				printLinksToImmediateSupersets(newSet, set, writer);
			}
		}
		// write end of file
		writer.write("}");
		writer.close();
	}

	/**
	 * This method print links from a subset to all its immediate supersets (not
	 * optimized).
	 * 
	 * @param subset
	 *            the subset
	 * @param set
	 *            the set of all integers
	 * @param writer
	 *            object to write to the output file
	 * @throws IOException
	 */
	private static void printLinksToImmediateSupersets(List subset,
			String[] set, BufferedWriter writer) throws IOException {
		// For each integer in the set of all integers
		for (int i = 0; i < set.length; i++) {
			String value = set[i];
			// if it is not contained in the subset
			if (subset.contains(value) == false) {
				// we add it to the set to make an immediate superset
				// and write the link
				List newSet = new ArrayList();
				newSet.addAll(subset);
				newSet.add(value);
				writer.write(asString(subset) + " -> " + asString(newSet)
						+ " \n");
			}
		}
	}

	/**
	 * Convert a set to a string representation
	 * 
	 * @param set
	 *            the set as a list of integers
	 * @return a string
	 */
	private static String asString(List set) {
		Collections.sort(set);
		// if the empty set, we will write "{}"
		if (set.size() == 0) {
			return "\"{}\"";
		}
		// otherwise we will write the set of integers
		StringBuffer buffer = new StringBuffer();
		buffer.append("\"{");
		// for each integer
		for (int i = 0; i < set.size(); i++) {
			String value = set.get(i);
			buffer.append(value);
			if (i != set.size() - 1) {
				buffer.append(",");
			}
		}
		buffer.append("}\"");
		return buffer.toString();
	}

}

By running the above program, it will create a file called input.dot containing a content similar to this, which represents the nodes of the graph that will be drawn and the links between nodes.

digraph mygraph{"{}" -> "{a}" 
"{}" -> "{b}" 
"{}" -> "{c}" 
"{}" -> "{d}" 
"{}" -> "{e}" 
"{a}" -> "{a,b}" 
"{a}" -> "{a,c}" 

....

"{c,d,e}" -> "{a,c,d,e}" 
"{c,d,e}" -> "{b,c,d,e}" 
"{a,c,d,e}" -> "{a,b,c,d,e}" 
"{b,c,d,e}" -> "{a,b,c,d,e}" 
}

Step 2.  Generating a PNG file of the graph using GraphViz

Then, we can run GraphViz from the command line to generate the graph as a PNG file:

dot -Tpng input.dot > output.png"

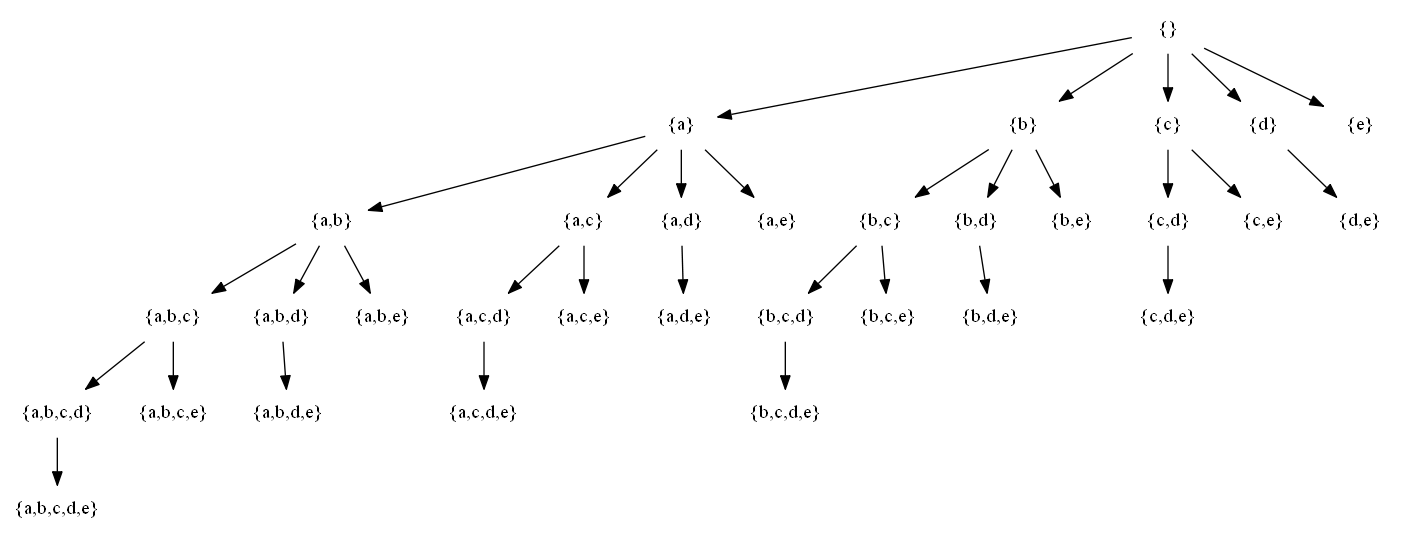
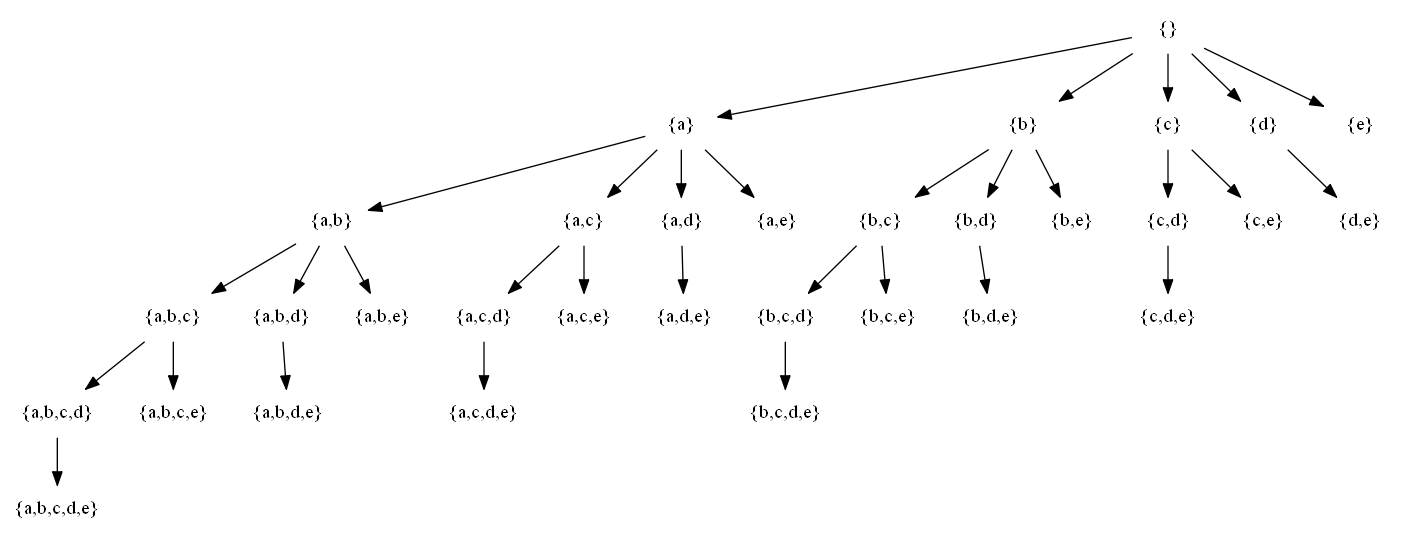
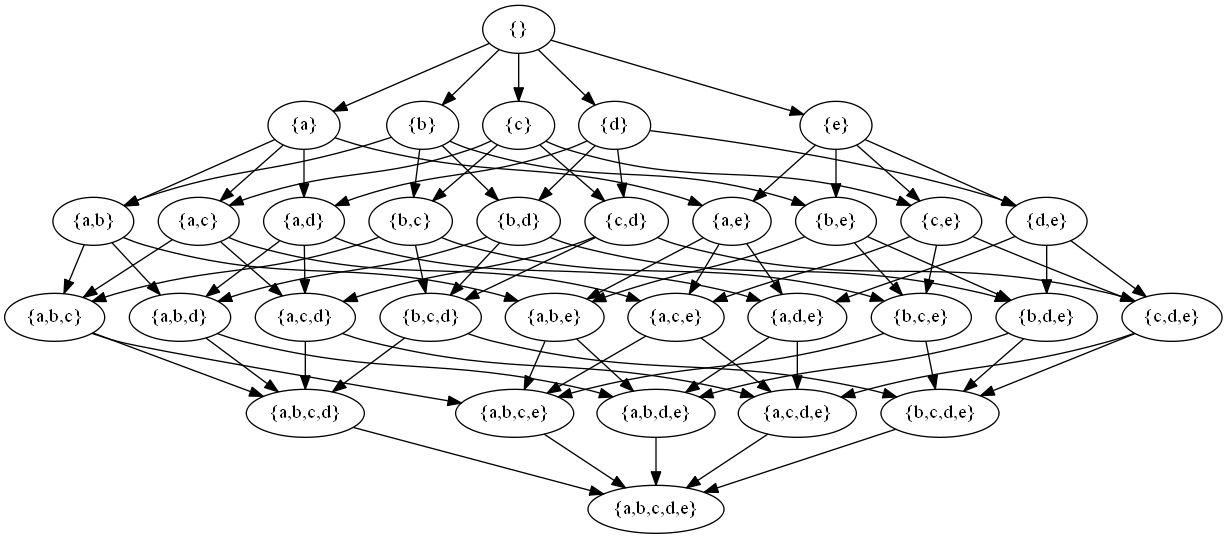
This will generate a nice Hasse Diagram:

Hasse Diagram of the powerset of {a,b,c,d,e}

Hasse Diagram of the powerset of {a,b,c,d,e}


Hope that you have enjoyed this post.  If you like this blog, you can tweet about it and/or subscribe to my twitter account @philfv to get notified about new posts.
Philippe Fournier-Viger is an assistant professor in Computer Science and also the founder of the open-source data mining software SPMF, offering more than 52 data mining algorithms.

Posted in Data Mining, General, Mathematics | Tagged , , , , | 3 Comments

Big Problems only found in Big Data?

Today, I will discuss the topic of Big Data, which is a very popular topic nowadays.  The popularity of big data can be seen for example in universities. Many universities are currently searching for professors who do research on “big data”. Moreover, all the big conferences on data mining have workshops, tutorials and keynote speeches on “big data”.  Besides, many researchers try to call their research “big data” or try to find some “big data” projects to get more funding.

big data

What is big data?  There have been many attemps to define what is big data.  One key aspect is that there should be a huge amount of data (e.g. terabytes) that cannot be handled by a single computer.  Other aspects that are proposed to defined big data is that the data is heterogeneous (e.g. combine many different types of data), that it is evolving (e.g. new data is always coming), and that it is decentralized and distributed.

In this post, I will argue that Small Data also have difficult problems that need to be solved.  Actually, even in very small datasets, there exists some very difficult problems that we have not solved yet and that are more difficult than some big data problems.  In general, I will call problems that are difficult to solve by an algorithm “Big Problems“.  These problems can be found either in Small Data or Big Data.

An example of a Big Problem in Small Data

I will give an example of a Big Problem that can occurs with just a few kilobytes of data.

In Data Mining, there is one popular task that is called frequent itemset mining (proposed by Agrawal & Srikant, 1993). It is defined as follows.  Let be a set of transactions, where each transaction is a set of symbols. For example, consider the three following transactions:

T1: {beer}, {egg}, {bread}
T2 :  {beer, {cheese}, {wine}, {bread},{milk}
T3:  {cheese}, {wine}, {bread}

The goal of frequent itemset mining is to enumerate all subsets that are common to more than minsup transactions, where minsup is set by the user.  For example, if minsup = 2 transactions, the result would be {{beer}, {cheese}, {wine}, {bread},  {beer, bread}, {cheese, wine}, {cheese, bread}, {wine, bread}, {cheese, wine, bread}}.

This problem is an enumeration problem, that has many more difficult variations such as when quantities and weights are considered (e.g. high utility itemset mining). However, even for the basic version of this problem, the search space can be huge, even for very small datasets.  I will give a simple example.  Consider 5 transactions such that three transactions contains 100 common symbols (items). Set minsup = 2 transactions, and there will be more than 2^100 – 1 groups of items to be output. In this case, no algorithm would terminate or even if it would, it would run out of disk space of memory to save the result. This example shows that even with such a small set of data, we can find very difficult problems (Big Problems).

An example of an Easy Problem in Big Data

On the other hand, there are many Big Data problems that are easy to solve. For example, consider calculating the average sale price of items sold in a retail store during the evening.  Calculating the average price of a set of customer transactions can be easily paralellizde and there is no major challenge to do that.

Conclusion.

So in conclusion, what I want to highlight in this post is that although the amount of data plays a role in the difficulty to solve a problem, we should perhaps not put too much emphasis on only this aspect. The reason is that  it is not solely the amount of data that makes a problem difficult, It is also the type of the problem and the search space that is involved. For example, making a program that can play Go and beat the best humans at that game is extremelly difficult even if it does not involve Big Data. We should also remember that we have not solved all the Big Problems in Small Data

—–

That is all I wanted to write for now. If you like this blog, you can tweet about it and/or subscribe to my twitter account @philfv to get notified about new posts.

Philippe Fournier-Viger is an assistant professor in Computer Science and also the founder of the open-source data mining software SPMF, offering more than 52 data mining algorithms.


Posted in artificial intelligence, Data Mining, General, Programming | Tagged , , , | Leave a comment

Report of the PAKDD 2014 conference (part 3)

This post continue my report of the PAKDD 2014 in Tainan (Taiwan).

pakdd2014

The panel about big data

Friday, there was a great panel at PAKDD about big data with 7 top researchers from the field of data mining.  I will try to faithfully report some interesting opinions and ideas heard during the panel. Of course, the text below is my interpretation.

Learning from large data

Geoff Webb discusses the challenges of learning from large quantities of data. He mention that the majority of research focuses on how we can scale up existing algorithms rather than designing new algorithms.  He mentionned that different algorithms have different learning curves and that some models may work very well with small data but other model may work better with big data.  Actually, some models that can fit complex and large amount of data may tend to overfit with small data.

In his opinion, we should not just try to scale up the state of the art algorithm but to design new algorithms that can cope with huge quantities of data, high dimensionality and fine grained data.  We need low bias, very efficient and probably out of core algorithms.

Another interesting point is that there is a popular myth that using any algorithms will work well if we can train it with big data. That is not true.  Different algorithm have different learning curves (produce different error rate based on the size of the training data).

Big data and the small footprint

Another interesting opinion was given by Edward Chang.  It was mentionned that often simple methods can outperforms complex classifiers when the number of training examples is larger.  He mentionned that complex algorithms are hard to parallelize and that the solution may thus be to use simple algorithms for big data. As example, he mentionned that he tried to parallelize “deep learning” algorithms for 2 years and fail because it is too complex.

Another key idea is that doing data mining with big data should have a small footprint in terms of memory and power consumption.  The latter point is especially important for wearable computers.  But of course some of the processing could be done in the cloud.

Should we focus on the small data problems?

Another very interesting point of view was presented by George Karypis.  We are told that big data is everywhere and that there is more and more data.  We responded by proposing technologies such as Map Reduce, linear model, deep learning, sampling, sub-linear algorithms etc.   However, we should stop spending time on big data problems relevant to only a few companies (e.g. Google, Microsoft).

We should rather focus on “deep data”.  This means data that may be small but highly complex, computationally expensive, require a “deep” understanding. But also data that can easily fit on today workstation and small scale clusters.

We should focus on applications that are useful rather than concentrating too much work on big data.

On the need to cross disciplines

Another refreshing point of view what the one of Shonali Krishnaswamy.

She also mentioned that data mining on mobile platforms may be hard due to complex computation, limited resources and users that have short attention span.

Moreover,  to be able to perform data mining on big data, we will need to cross disciplines by getting inspired by work from the fields of: (1) parallel/distributed algorithms, (2) mobile/pervasive computing (3) interfaces / visualizations (4) decision sciences and (5) perhaps semantic agents.

Issues in healthcare

There was also some discussion about issues in health care by Jiming Liu.  I will not go into too much details about this one since I’m not much related to this topic. But some challenges that were mentionned is how to deal with diversity, complexity, timeliness, diverse data sources, tempo-spatial scales wrt problem, complex interactions, structural biases, how to perform data driven modelling, how to test result and service and how to access & share data.

Coupling

There was also another discussion by Longbing Cao about the need of coupling.  I did not take too much notes about this one so I will not discuss it here.

Continue reading my PAKDD 2014 report (part 2) here

—–

That is all I wanted to write for now about this edition of PAKDD. If you like this blog, you can tweet about it and/or subscribe to my twitter account @philfv to get notified about new posts.

Update: You may also want to read my posts about PAKDD 2015PAKDD 2017,  PAKDD 2018 and PAKDD 2019,PAKDD 2020 and PAKDD 2024)

Philippe Fournier-Viger is an assistant professor in Computer Science and also the founder of the open-source data mining library SPMF, offering more than 65 data mining algorithms.

Posted in Conference, Data Mining | 1 Comment

Report of the PAKDD 2014 conference (part 2)

This post will continue my report of the PAKDD 2014 in Tainan (Taiwan).

pakdd2014

About big data

Another interesting talk at this conference was given by Prof. Jian Pei. The topic was Big Data.

Some key ideas in this talk was that to make a technology useful, you have to make it small and invisible. A system relying on data mining may have to detect when a user needs a data mining service and provides the service as early as possible.

Other desirable characteristics of a data mining system are that a user should be able to set preferences. Moreover, if a user interactively changes its preferences, results should be updated quickly.   A data mining system should also be context aware.

It was also mentioned that big data is always relative.  Some papers in the 1970s were already talking about large data and recently some conference have even adopted the theme “extremely large databases”. But even if “big” is relative, since 2003 we record more data every few days in the world than everything that had been recorded before.

Social activities and organization

In general, PAKDD was very-well organized. The organizers did a huge job. It is personally one of the best conference that I have attended in terms of organization.  I was also able to met many interesting people from the field of data mining that I had not met before.

The social activities and banquet were also nice.

Location of PAKDD 2015

The location of PAKDD 2015 was announced. It will be in Ho Chi Minh City, Vitenam from 19-22 May 2014.  The website is http://pakdd2015.pakdd.org

The deadline for paper submission is 3 October 2014 and notification is the 26 December 2014.

Continue reading my PAKDD 2014 report (part 1) here   or part 3 here

—–

That is all I wanted to write for now. If you like this blog, you can tweet about it and/or subscribe to my twitter account @philfv to get notified about new posts.
Philippe Fournier-Viger is an assistant professor in Computer Science and also the founder of the open-source data mining software SPMF, offering more than 52 data mining algorithms.

Posted in Conference, Data Mining | 2 Comments

Report of the PAKDD 2014 conference (part 1)

I am currently at the PAKDD 2014 conference in Tainan, In this post, I will report interesting information about the conference and talks that I have attended.

pakdd2014

Importance of Succint Data Structures for Data Mining

I have attended a very nice tutorial at PAKDD by R. Raman  about succint data structures for data mining.  I will try to report some main points of this tutorial here as faithfully as possible (but it is my interpretation).

A simple definition of what is a succint data structure is as follows. It is a data structure that uses less memory than a naive data structure for storing the some information.

Why should we care?

  • A reason is that to perform fast data mining, it is usually important to have all the data into memory. But sometimes the data cannot fit. In the age of big data, if we use some very compact data structures, then we can fit more data into memory and perhaps that we don’t need to use distributed algorithms to handle big data.  An example that was provided in the tutorial is a paper by Cammy & Zhao that used a single computer with a compact structure to beat a distributed map reduce implementation to perform the same task.  If we can fit all data into the memory of a single computer, the performance may possibly be better because data access is faster on a single computer than if the computation is distributed.
  • A second reason is that if a data structure is more compact, then in some cases a computer may store more memory in its cache and therefore access to the data may even be faster.  Therefore, there is not always a negative effect on execution time when data is more compressed using a succint data structures.

What characteristics a compressed data structure should provide?

  • One important characteristic is that it should compresses information and an algorithm using the data structure should ideally be able to work directly on it without decompressing the data.
  • Another desirable characteristic is that it should provide the same interface as an uncompressed data structure. In other words, for an algorithm, we should be able to replace the data structure by a compressed data structure without having to modify the algorithm.
  • A compressed data structure is usually composed of data and an index for quick access to the data.  The index should be smaller than the data.
  • Sometimes a trade-off is redundancy in the data structure vs query time. Reducing redundancy may increase query time.

There exists various measures to assess how much bits are necessary to encode some information: naive, information-theoretic, entropy…  If we design a succint data structure and we use more memory than what is necessary using these measures, then we are doing something wrong.

In the tutorial, it was also mentionned that there exists several libraries providing succint data structure implementations such as Sux4J, SDSL-lite, SDSL…

Also many examples of succint data structures were provided such as binary trees implemented as a bit vectors, multibit trees, wavelet trees, etc.

On applications of association rule mining

Another very interesting talk was given by G. Webb. The talk first compared association rule mining with methods from the field of statistics to study associations in data. It was explained that:

  • statistics often tries to find a single model that fit the data, wherehas association rules discovers multiple local models (associations), and let the user choose the best models (which rule better explain the data).
  • association rule mining is scalable to high dimensional data, wherehas classical techniques from statistics cannot be applied to a large amount of variables

So why association rule mining is not so much used in real applications? It was argued that the reason is that researchers in this field focus too much on performance (speed, memor) rather than on developing algorithms that can find unusual and important patterns.  By focusing only on finding frequent rules, too much “junk” is presented to the user (frequent rules that are obvious).  It was shown that in some applications, actually, it is not always the frequent rules that are important but the rare ones that have a high statistical significance or are important to the user.

So what is important to the user? It is a little bit subjective. However, there are at least four principles that can help to know what is NOT important to the user.

  • 1) If frequency can be predicted by assuming independency then the association is not important. For example, finding that all persons having prostate cancer are males is an uninteresting association, because it is obvious that only male can get prostate cancer.
  • 2) Redundant associations should not be presented to the user. If an item X is a necessary consequence of a set of items Y, then {X} U Y should be associated with everything that Y is. We don’t need all these rules. In general, we should either keep simple of complex rules (we should remove redundant rules)
  • 3) doing some statistical tests to filter non significant associations

Also, it is desirable to mine association efficiently and to be able to explain to the user why some rules are eliminated if necessary.

Also, if possible we may use top-k algorithms where the user chooses the number of patterns to be found rather than using the minsup threshold. The reason is that sometimes the best associations are rare associations.

These were the main ideas that I have noticed in this presentation.

Continue reading my PAKDD 2014 report (part 2) here

—–

That is all I wanted to write for now. If you like this blog, you can tweet about it and/or subscribe to my twitter account @philfv to get notified about new posts.
Philippe Fournier-Viger is an assistant professor in Computer Science and also the founder of the open-source data mining software SPMF, offering more than 52 data mining algorithms.

Posted in Conference, Data Mining | 7 Comments

New version of SPMF Java open-source data mining library (0.95)

Today, I write a post to announce a new version of the SPMF Java open-source data mining library.  It is SPMF version 0.95 and it is a major revision. It offers 11 new  data mining algorithms for various data mining tasks.

The list of the new algorithms is as follows:

  • TKS for top-k sequential pattern mining
  • TSP for top-k sequential pattern mining
  • VMSP for maximal sequential pattern mining
  • MaxSP for maximal sequential pattern mining
  • estDec algorithm for mining recent frequent itemsets from a stream (by Azadeh Soltani)
  • MEIT (Memory Efficient Itemset-Tree), a data structure for targeted association rule mining
  • CM-SPAM for sequential pattern mining
  • CM-SPADE for sequential pattern mining
  • CM-CLaSP for closed sequential pattern mining
  • PASCAL for mining frequent itemsets and identifying generators

Below, I will briefly explain the importance of these new algorithms.

Algorithms for maximal sequential pattern mining

Mining sequential patterns can often produce a lot of sequential patterns. To address this issue, several algorithms have been propoved to mine less but more representative sequential patterns. Some popular subsets of sequential patterns are closed and maximal sequential patterns.  In previous version of SPMF there was algorithms for closed sequential pattern mining but no algorithms for maximal sequential pattern mining.  Now, two recent state-of-the art algorithms have been added for this task : VMSP  (2014) and MaxSP (2013).

It is interesting to mine maximal sequential patterns because it can produce up to an order of magnitude less patterns than closed sequential patterns.

Faster algorithms for sequential pattern mining

The new version also offers faster algorithms for sequential pattern mining and closed sequential pattern mining.

CM-SPADE (2014) outperform all the previous algorithms in SPMF in most cases.  CM-SPAM (2014) offers most of the time the second best performance.

Furthermore, the CM-ClaSP algorithm (2014) outperforms the CloSpan, ClaSP and BIDE+ algorithms for closed sequential pattern mining.

You can see a performance comparison below on six public datasets to see the speed improvement from these new algorithms (more details on the “performance” page of the SPMF website).

New algorithm for mining frequent itemsets from a stream

A new algorithm for stream mining is also introduced. It is the estDec algorithm (2003). It is a classical algorithm for mining frequent itemsets from stream that put more importance on recent transactions. Previously, there was only one stream mining algorithm in SPMF named CloStream. But CloStream has some important limitations: (1) it does not use a minimum support threshold therefore it can find a huge amount of patterns and (2) it put as much importance on old transactions as on recent transactions from the stream.  estDec adresses these issues by using a threshold and putting less importance on older transactions.

New algorithm for frequent itemset mining

An implementation of the PASCAL algorithm is introduced for frequent itemset mining. PASCAL is a classical algorithm based on Apriori. The main improvement in PASCAL over Apriori is that it can correctly guess the support of some itemsets directly without having to scan the database.  This is done based on the following property from lattice theory: when an itemset is not a “generator”, its support is the minimum support of its subsets.  I will not define the concept of generator here. If you are curious, you can have a look at the example for Pascal in the documentation of SPMF for more details.

New algorithm for targeted itemset and association rule mining

A new data structure is also introduced named the Memory Efficient Itemset Tree (MEIT). This structure is an improvement of the Itemset-Tree structure that can use up to 45 % less memory but is a little bit slower (there is a trade-off between memory and speed).  If you don’t know what is an Itemset-Tree, it is a structure for performing queries about itemsets and association rules. You can imagine for example a software that has to perform many queries such as “give me all the association rules with itemset X in the consequent”, “give me all the rules with item Z in the consequent”, etc.  An Itemset-Tree is a structure that is optimized for answering such queries quickly and that can be updated incrementally by inserting new transactions. If you are curious about this, you can have a look at the example for Memory-ItemsetTree and Itemset Tree in the documentation of SPMF for more details.

Bug fixes and other improvements

Lastly, this new version also include a few bug fixes. One notable bug fix is for a bug in the ID3 implementation.  I have also improved the documentation to explain clearly what are the input and output format of each algorithm.  I have also updated the map of data mining algorithms offered in SPMF:

https://www.philippe-fournier-viger.com/spmf/map_algorithms_spmf_data_mining095.png

That is all I wanted to write for today! Hope that you will enjoy this new version of SPMF !


If you like this blog, you can tweet about it and/or subscribe to my twitter account @philfv to get notified about new posts.
Philippe Fournier-Viger is an assistant professor in Computer Science and also the founder of the open-source data mining software SPMF, offering more than 52 data mining algorithms.

Posted in Data Mining, Data science, Java, open-source, spmf | Tagged , , , | 1 Comment

How to get citations for your research papers?

Today, I will present some tips about how to write research papers that get many citations. Obviously, some of these ideas may depend on the specific topics that you are working on and there is also some exceptions to these advices.

  • Publish your datasets.  If you publish your datasets, other researchers may reuse them, and if they reuse them, they will cite you.
  • Publish your source code.  If you are providing your source code or binaries for a computer program,  other researchers may choose to use your work instead of the work of someone else simply because they will save time by not having to implement the work of someone else.
  • Publish solution to popular problems. If you are working on a topic that is popular, it is more likely to have an impact than if you are working on a topic that is not popular.
  • Give enough details about your method. If your paper is detailed enough so that someone can implement your work by reading your paper or reproduce your experiments, then it is more likely that someone else will use your work.
  • Publish a  solution that is generalizable to multiple applications.  If you  propose a solution to a problem that has very few applications, then less people may reuse or extend your work. But if you publish something that is reusable in many situations,  then chances are probably higher that you will get cited.
  • Write well your title, abstract and introduction,. Even if you do some good research, if your paper is badly written then it will have less chance to get cited.  The title, keywords and abstract should be carefully selected so that people that only read the abstract and title will know what your paper is about.
  • Publish in good conferences and journals. Citing articles from good journals and conferences looks good. Therefore, if you publish in a good conference or journal, there is more chance to get cited. Moreover, good conferences and journals will give more visibility to your papers.
  • Put your papers online! Nowadays, most researchers are searching on Google to find articles instead of going to the library.  Therefore, it is important that your articles are accesibles on the Web freely. A good way to do this is to create a webpage and publish your PDFs on your website (note that it is important to check what is the copyright agreement that you have signed with your publisher to see if you have the right to put PDF on your website). After that, you may want to do a little bit SEO (Search Engine Optimization) to make sure that your website appears in Google.
  • Sometimes cite your own papers. It is a good idea to sometimes cite a few of your own papers. Obviously, one should not cite too many of his own papers in a paper. But citing a few is generally ok. For some search engines like Google Scholar, papers are ordered by the number of citations. If your papers has a few citations (even by yourself), then your paper will appear before papers that have no citations in the results.
  • Write a survey paper.  Survey papers usually get a lot of citations because many people read them and it is useful to cite survey papers in an article.   Therefore, writing a survey papers may bring you a lot of citations.
  • Make sure that a PDF copies of your paper are available online. You may put a PDF copy of your research papers on your website, or on archival repositories such as Arxiv, or even put them on websites like ResearchGate.
  • Mention your papers on social media or blogs. You may use Twitter, Facebook, Google Plus and other social media platform to talk about your research.  Another good idea to promote your work is to write a blog post about your research work or convince someone else to write a blog post about your work.
  • Give talks at universities or conferences.  Another good way to promote your research is to give invited talks at other universities and at conferences.
  • If you are directly extending the work of someone else, you may send him your paper by e-mail, as he may be interested in your work.
  • Built a reputation for publishing excellent work. As you become more famous, people will start to search your name to find your other papers, or sometimes look at your website.

This is just a few tips. There are certainly more things that could be said on this topic. But it is enough for today. Hope that you have enjoyed this post.  If you like this blog, you can tweet about it and/or subscribe to my twitter account @philfv to get notified about new posts.

Philippe Fournier-Viger is an assistant professor in Computer Science and also the founder of the open-source data mining software SPMF, offering more than 52 data mining algorithms.

Posted in Research | Tagged , , , | 2 Comments

Discovering and visualizing sequential patterns in web log data using SPMF and GraphViz

Today, I will show how to use the open-source SPMF data mining software to discover sequential patterns in web log data. Then, I will show to how visualize the frequent sequential patterns found using GraphViz.

Step 1 :  getting the data.

The first step is to get some data.  To discover sequential patterns, we will use the SPMF software. Therefore the data has to be in SPMF format.  In this blog post, I will just use the web log data from the FIFA world cup from the datasets webpage of the SPMF website. It is already in SPMF format.

Step 2 : extracting sequential patterns.

Then using the SPMF.jar file downloaded from the SPMF website, I have applied the PrefixSpan algorithm to discover frequent sequences of webpages visited by the users.  I have set  the minsup  parameter of PrefixSpan to 0.15, which means that a sequence of webpages is frequent if it is visited by at least 15% of the users.


The result is an output file containing 5123 sequential patterns in a text file. For example, here are three patterns from the output file:

155 -1 44 -1 21 -1 #SUP: 4528
 147 -1 #SUP: 7787
 147 -1 59 -1 #SUP: 6070
 147 -1 57 -1 #SUP: 6101

The first one represents users vising the webpage 155, then visiting webpage 44 and then 21.  The line indicates that this patterns has a support of 4528, which means that this patterns is shared by 4528 users.

The result may be hard to understand in a text file, so we will next visualize them using GraphViz.

Step 3: Transforming the output file into GraphViz DOT format.

I use a very simple piece of Java code to transform the sequential patterns found by SPMF to the GraphViz DOT format.

import java.io.BufferedReader;
import java.io.BufferedWriter;
import java.io.File;
import java.io.FileInputStream;
import java.io.FileWriter;
import java.io.IOException;
import java.io.InputStreamReader;
import java.util.HashMap;
import java.util.Map;
import java.util.Map.Entry;

/**
 * @author Philippe Fournier-Viger, 2014
 */
public class MainDatasetConvertSequentialPatternsToDotFormat {

    public static void main(String [] arg) throws IOException, InterruptedException{

        String input = "C:\\patterns\\test.txt";
        String output = "C:\\patterns\\input.dot";

        BufferedReader myInput = new BufferedReader(new InputStreamReader( new FileInputStream(new File(input))));

        // map to remember arrow already seen
        Map<String, String>  mapEdges = new HashMap<String, String>();

        // for each line (pattern) until the end of file
        String thisLine;
        while ((thisLine = myInput.readLine()) != null) {
            if (thisLine.isEmpty() == true) {
                continue;
            }

            // split the pattern according to the " " separator
            String split[] = thisLine.split(" "); 
            boolean firstItemOfItemset = true;
            boolean firstItemset = true;

            String previousItemFromSameItemset = null;

            // for each token
            for(String token : split) {
                if("-1".equals(token)) { // if end of an item

                }else if("-2".equals(token) || '#' == token.charAt(0)){ // if end of sequence
                    previousItemFromSameItemset = null;
                    break;
                }else { // if an item
                    if(previousItemFromSameItemset != null) {
                        mapEdges.put(previousItemFromSameItemset, token);
                    }
                    previousItemFromSameItemset = token;
                }
            }
        }

        BufferedWriter writer = new BufferedWriter(new FileWriter(output));     
        writer.write("digraph mygraph{");
        // PRINT THE ARROWS
        for(Entry<String, String> edge : mapEdges.entrySet()) {
            writer.write(edge.getKey() + " -> " +edge.getValue() + " \n");
        }
        // Note: only sequential patterns of size >=2 are used to create the graph and 
        // patterns are assumed to have only one item per itemset.

        writer.write("}");
        myInput.close();
        writer.close();
    }
}

Step 4: Generating a graph using GraphViz

Then I installed GraphViz on my computer running Windows 7. GraphViz is a great software for the visualization of graphs and it is not very hard to use. The idea is that you feed GraphViz with a text file describing a graph and then he will automatically draw it. Of course there are many options that can be selected and here I just use the basic options.

I use the command:  dot -Tpng patterns.dot > output.png"

This convert my DOT file to a graph in PNG format.

The result is the following (click on the picture to see it in full size).

sequential_patterns_spmf_graphvizThe result is pretty interesting.  It summarizes the 5123 patterns into an easy to understand graph. By looking at the graph we can easily see that many sequential patterns passes by the nodes 44 and 117, which must be very important webpages on the website.

Note that using this technique, we loose a little bit information. For example, the support of edges is not indicated on this graph.  It may be possible to improve upon this visualization for example by using various colors to indicate the support or the number of patterns that pass by a node.

Hope that you have enjoyed this post.  If you like this blog, you can tweet about it and/or subscribe to my twitter account @philfv to get notified about new posts.

Philippe Fournier-Viger is an assistant professor in Computer Science and also the founder of the open-source data mining software SPMF, offering more than 52 data mining algorithms.

Posted in Data Mining, Java, open-source, Programming, spmf | Tagged , , , , , | 8 Comments