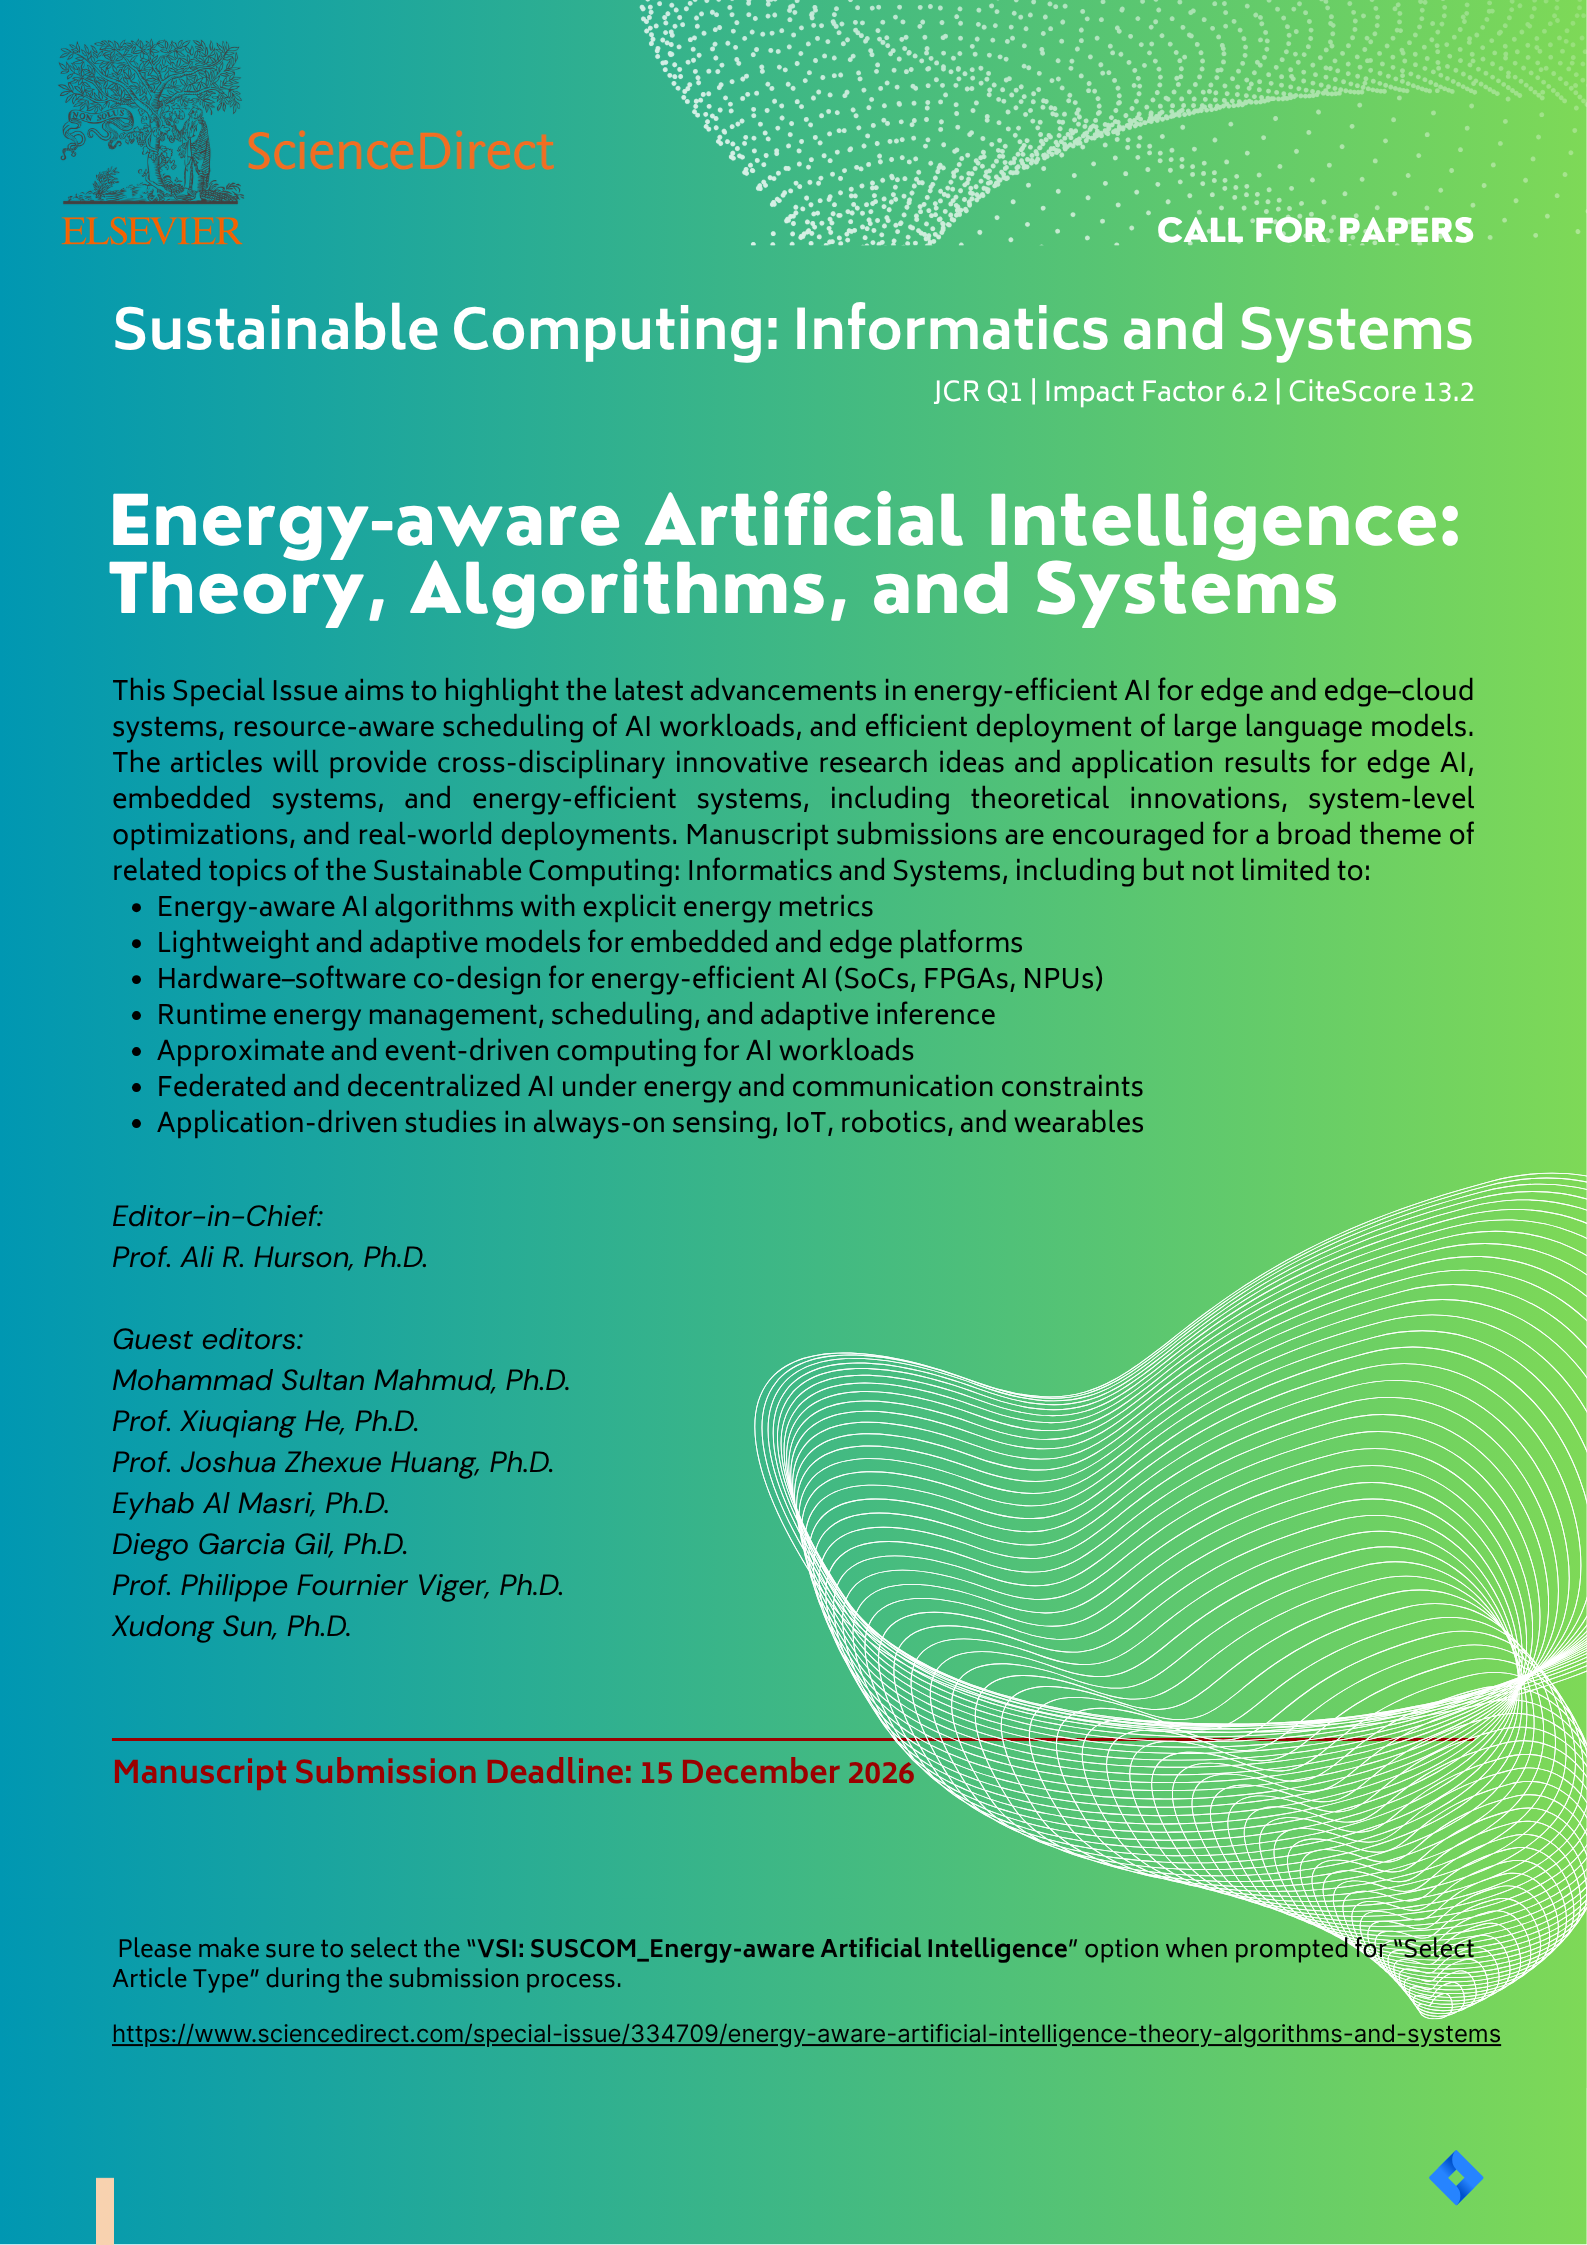
Today, I want to share the Call for Papers (CFP) for a special issue that I co-organize on the topic of “Energy-aware Artificial Intelligence: Theory, Algorithms and Systems“. The special issue is in the journal “Sustainable Computing: Informatics and Systems“, which has an Impact Factor of 6.2 and is in the first quartile of the Journal Citations Report ranking.
The picture below contains the main information. The deadline is the 15th December 2026. The webpage for the special issue also provides more information.
There is always a debate about the performance of different programming languages, which is one aspect among many for choosing a programming language. As the founder of the SPMF data mining library, implemented in Java and focused on performance, I am always curious about the comparison with other languages.
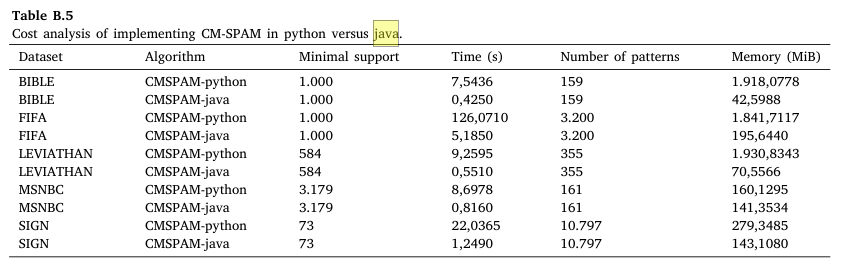
Today, I was reading the VEPRECO paper by Mordvanyuk et al. (2022), and I found some interesting comparison that they did between the Java implementation of CM-SPAM (from SPMF) and an implementation in Python. I will reproduce the table from the paper showing the comparison in Memory (MB) and Time (s):
The authors conclude that : “The results show that CM-SPAM implemented in java is from 10 to24 times faster than its implementation in python, and consumes from 2 to 45 times less memory, depending on the dataset. This means, that in java with lower support, we spend much less memory, than in python with higher support.”
I think that this is a very interesting observation. I dont know if the Python implementation is as optimized as the Java version. I cannot verify as it does not seems to be publicly available, and the BitBucket repository from the paper is apparently down. But I would assume that they are more or less equally optimized. So the performance difference is quite big in fact.
For example, CMSPAM-python on FIFA requires 1.8 GB of memory and takes 126 seconds to terminate, while CMSPAM from SPMF in Java requires only 195 MB of memory and 5 seconds. This is some massive difference.
By the way, I will include an implementation of VEPRECO in the upcoming version of SPMF 2.77 and a few other very recent tsequential pattern mining algorithms that have been contributed by some researchers such as TriBackClo (2026).
I am glad to announce that I am co-organizing two workshop related to machine learning and pattern mining with bioinformatics at the upcoming IEEE BIBM 2026 and IEEE ICDM 2026 conferences. The details are below:
HP4Moda 2026(2nd Workshop on Heuristic and Pattern Mining for Multi-Omics Data Analytics) @ IEEE BIBM 2026 Deadline:September 27, 2026
PM4B 2026 (2nd Workshop on Pattern mining and Machine learning for Bioinformatics) @ IEEE ICDM 2026 Deadline: August 20th 2026
Everyone is welcome to submit their papers! Those are very good IEEE conferences. You may click the links above for more information!
Today, I want to talk to give you a glimpse about some additional improvements in the upcomingversion 2.66 of the SPMFpattern mining software, which will be released very soon. In this version, I have improved the Workflow editor. It is a tool that let the user create workflows with more than one algorithm, and then to run them.
Previously, the workflows had to be linear, that is only a sequence of algorithms could be created without branching. For example, there three algorithms (in red color) are run one after the other:
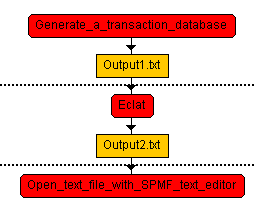
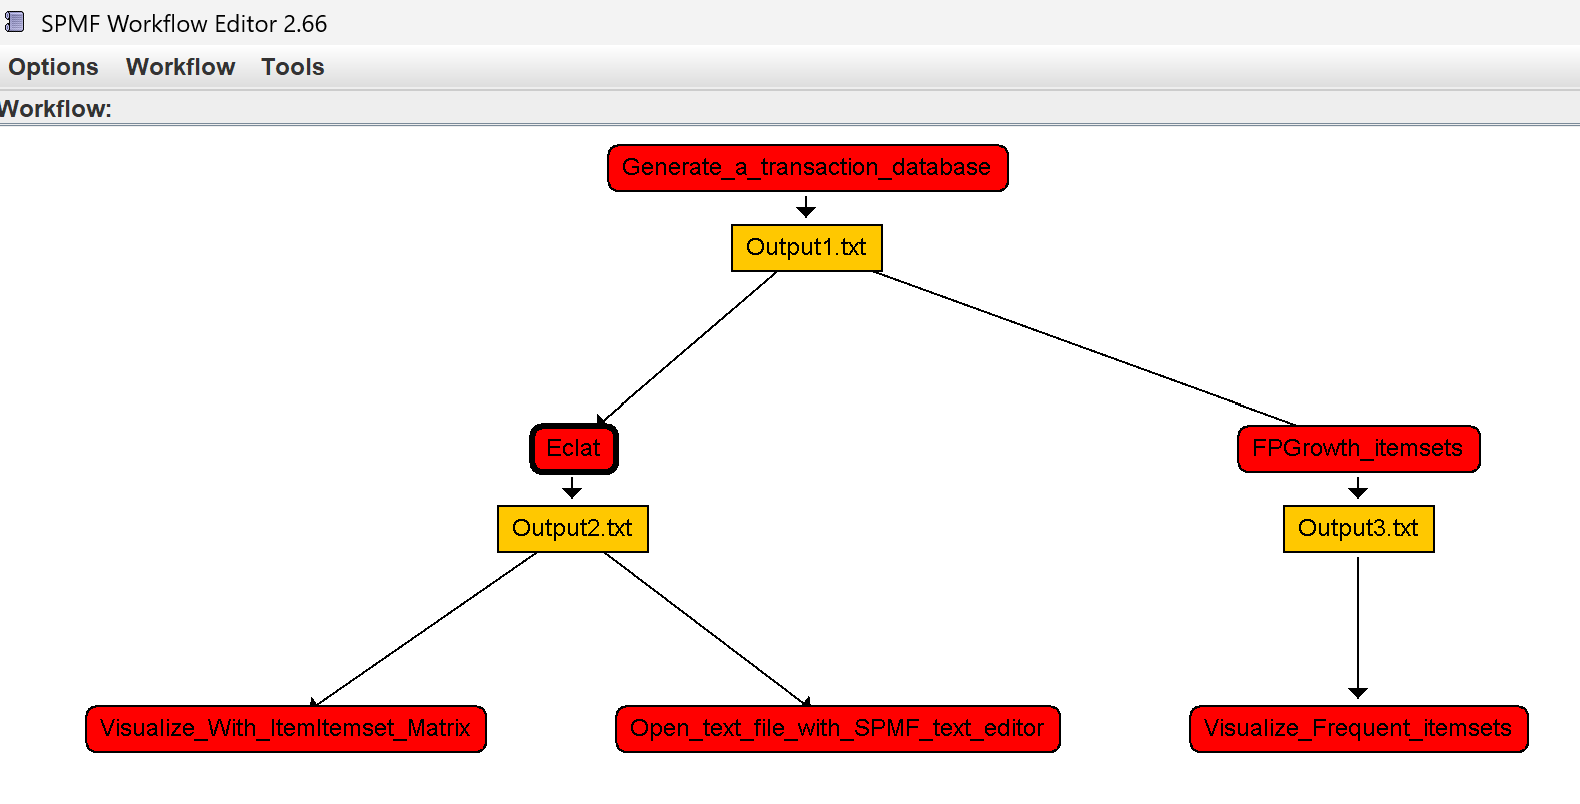
In SPMF 2.66, the user can now create workflows that are not linear. In other words, the workflows can have multiple branches (the output of an algorithm can be reused by multiple algorithms. Thus, it will now be possible to create more complex workflows like this:
In this example, an algorithm is applied to generate a transaction dataset “Output1.txt”. Then, this output is used by two algorithms, namely Eclat and FP-Growth, and for each of them, a different tools are used to visualize the results.
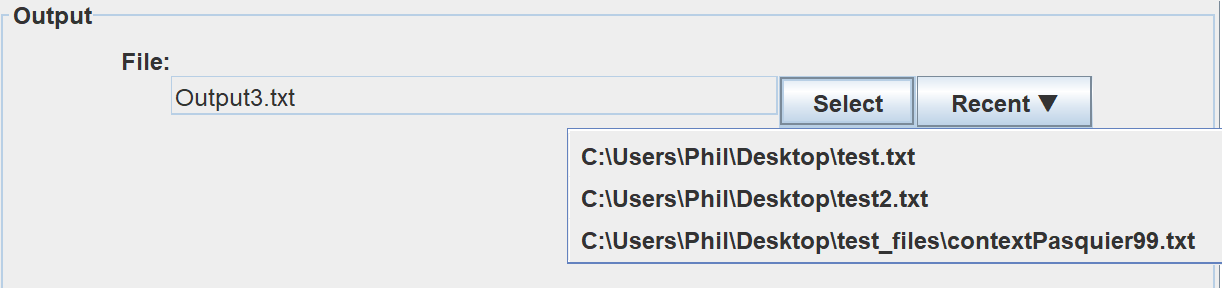
In SPMF 2.66, the Workflow editor has also other user interface improvements such as letting you choose recent files that you have previously used:
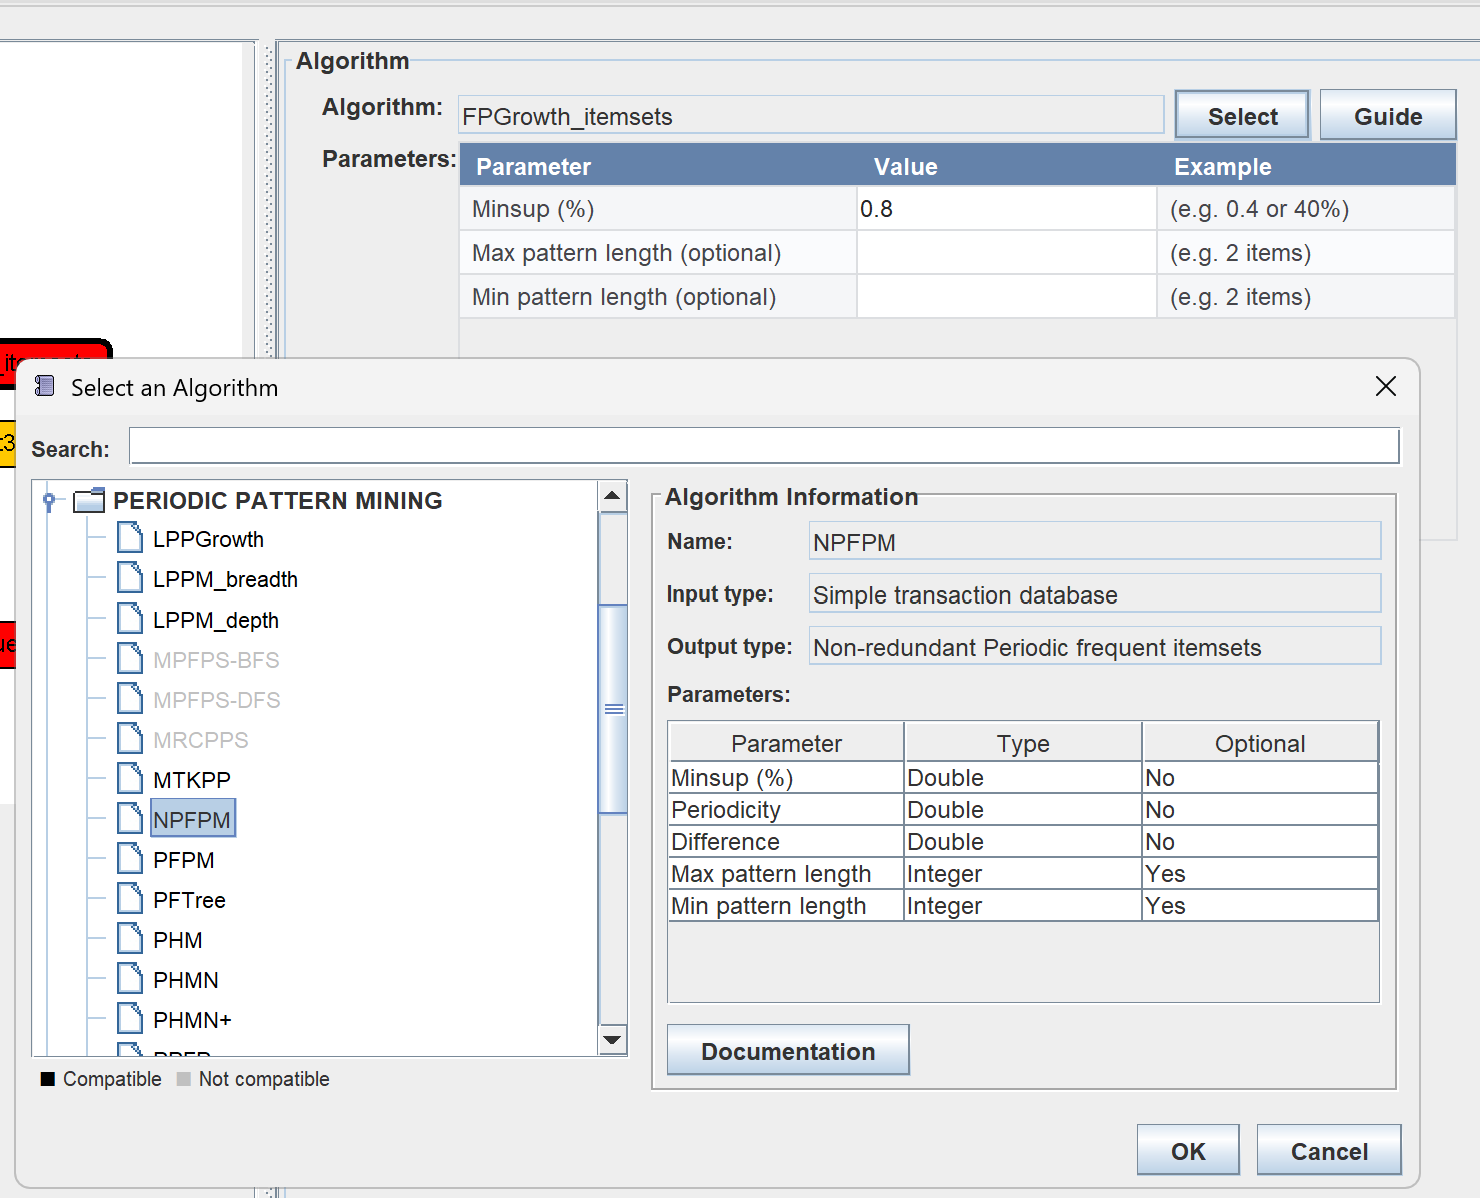
Moreover, there is now a new algorithm selection dialog that let you search algorithms and browse them by categories, which is more easy to use than the previous combo box of algorithms:
That is all for today! I just wanted to show some preview of other upcoming features in SPMF 2.66.
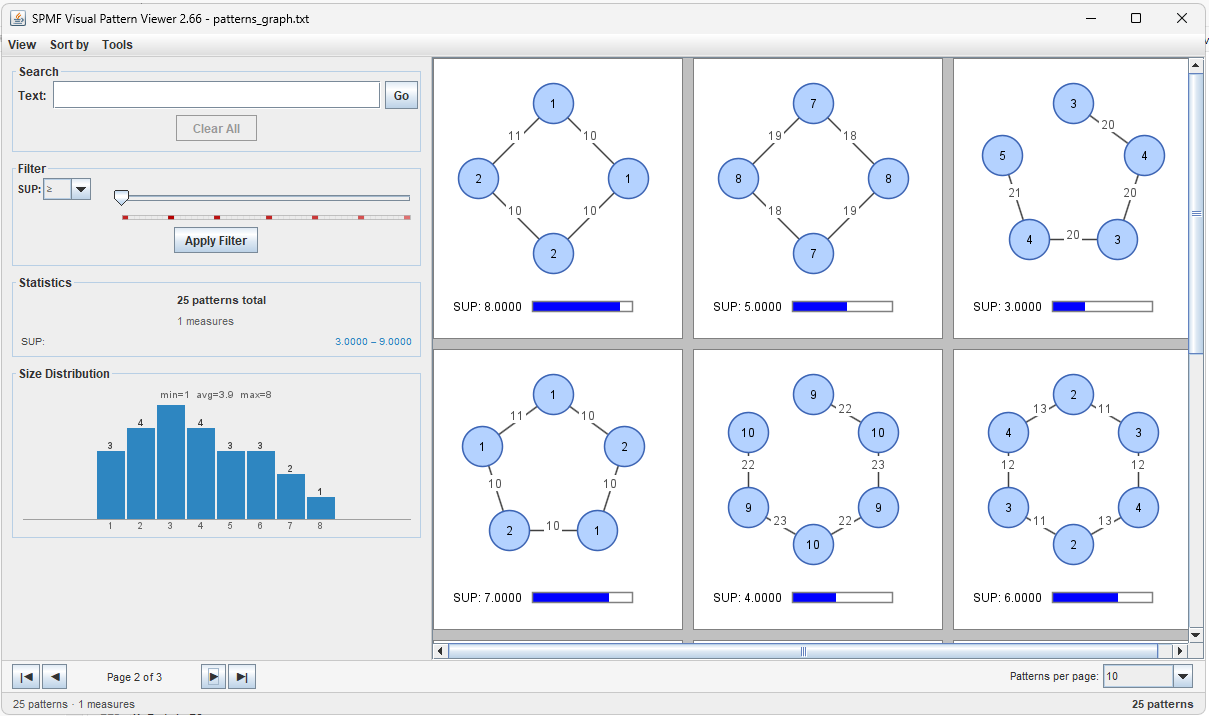
Today, I want to talk to you about other new features in SPMF. 2.66, which will be released in the next few days. I have also improved the Visual Pattern Viewer. Now it can be also used to visualized subgraphs:
Visualizing subgraphs was previously done with the SPMF GraphViewer. But integrating this feature in the Visual Pattern Viewer is more appropriate as the Visual Pattern Viewer provides several more advanced fonctionnalities such as showing subgraphs as pages, providing statistics, and the filter and search functions!
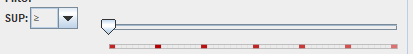
Also, you may see another new function in the Visual Pattern Viewer if you look closely. For each measure, the slider now displays the distribution of values for patterns:
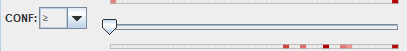
In that picture, you can see that red blocks indicate that some patterns have the corresponding support value and this gives hints about how to set the filter based on these support values. Here is another example for association rules:
The colored bar under the slider for the confidence measure indicates that most rules have a confidence closer to 1 (the maximum) than 0 (the minimum). And more precisely, from this picture, it appears that all rules have a confidence greater than 0.5.
Hope that this is interesting. It is just to give you a preview of upcoming features in SPMF!
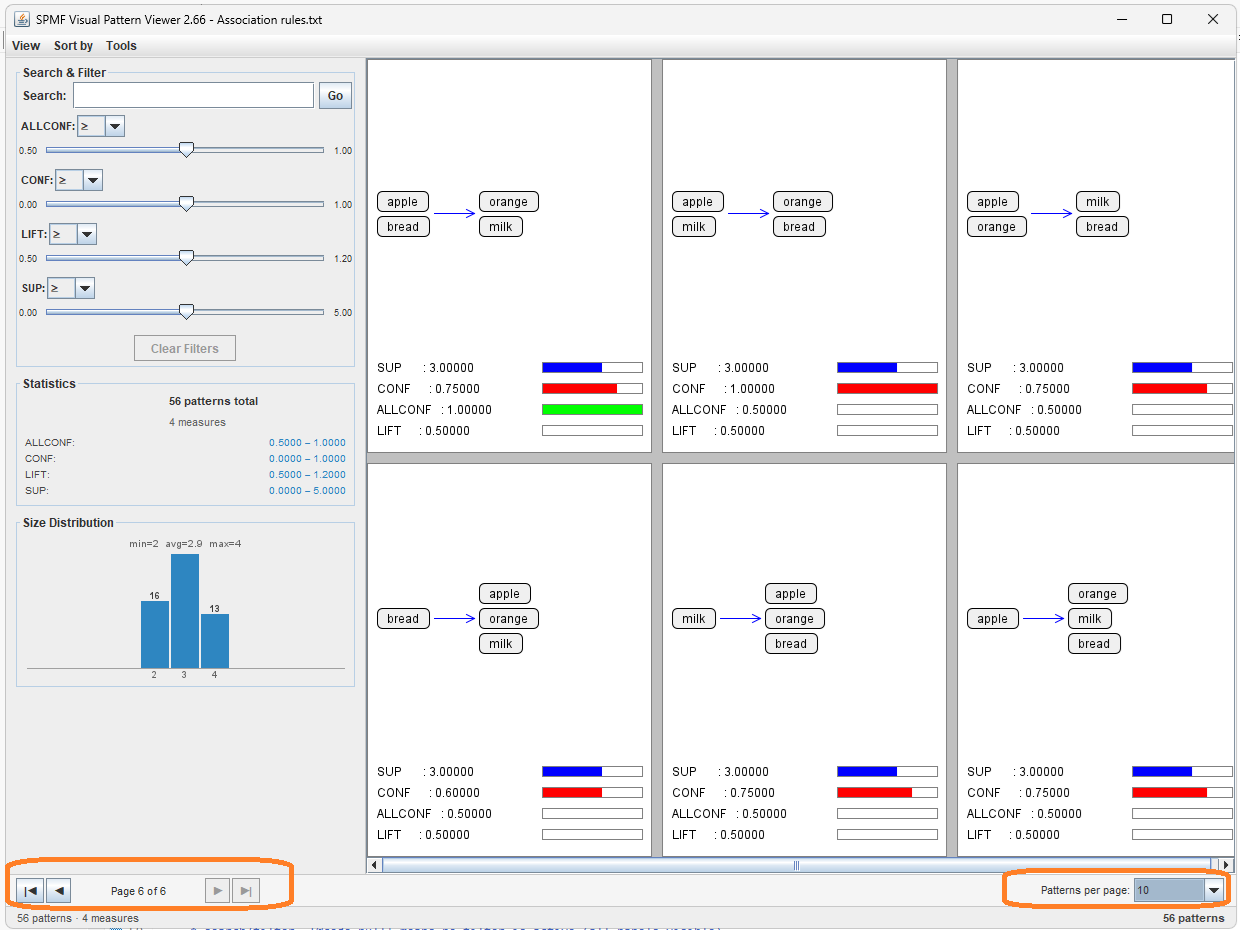
Today, I want to show you some new features in the upcoming version of SPMF 2.66. The visual pattern viewer is now improved to show larger set of patterns using pagination. This means that if you load an output file containing a very large number of patterns, they will be displayed using pages rather than all within the same window. To illustrate this, here is a screenshot of this new feature:
In this example, we are visualizing association rules, and there are 56 association rules. The user chooses to display 10 rules per page. Hence, there are 6 pages of association rules. The user can change the number of patterns displayed by page. And this works also for other pattern types such as itemsets and sequential patterns. Moreover, this also works when the user is applying filters or searching for specific items within the patterns.
This is just to show you a preview of upcoming features!
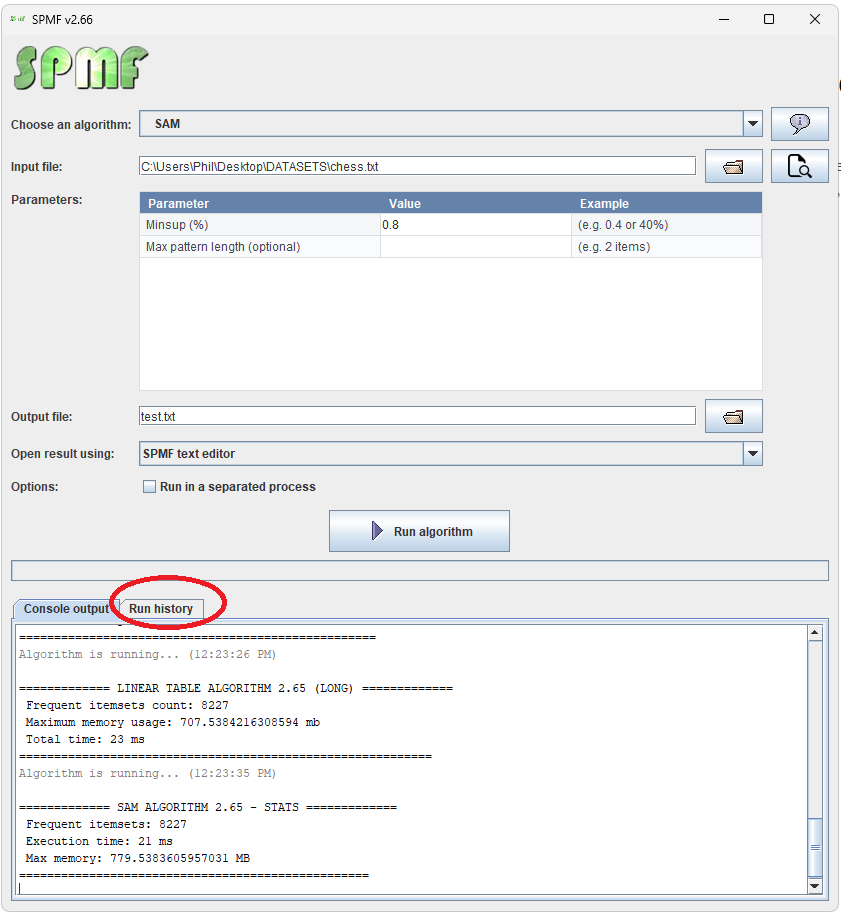
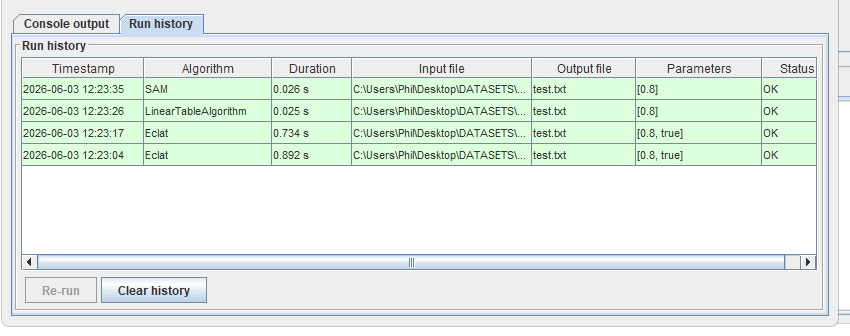
Today, I will continue to talk about improvements to the user interface of SPMF, for the upcoming version 2.66. I have just added a new Run history panel. To access it the user will click here:
And then, the run history is displayed:
And it is possible to run the same algorithm again with the same parameters, and see all algorithms that have been run in the current session, and to clear the history.
Another update(2026-06-05)
I have further improved the user interface today, here is a new version, where there are now buttons for selecting recently used algorithms, input, and output files. This is very useful for users.
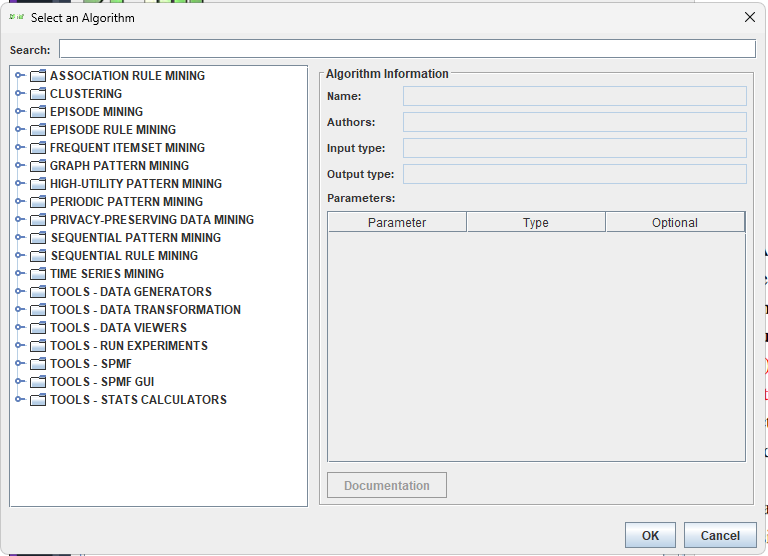
Also, the combobox for selecting an algorithm has been replaced by a more intuitive algorithm selection dialog that displays algorithms by category and has a search bar as it was cumbersome to scroll through hundreds of algorithms. Here is a screenshot:
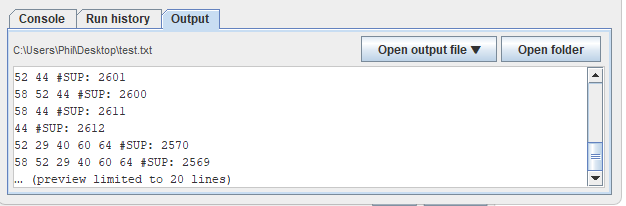
And finally, when an algorithm is run, there is a preview of the output file in the bottom tabs:
From this tab, using the button “Open output file“, it is possible to open the last generated output file using different viewers without having to run the algorithm again. And there is also a new button to open the folder containing the output file.
This is just to show you some new feature in the upcoming version of SPMF! Have a good day!
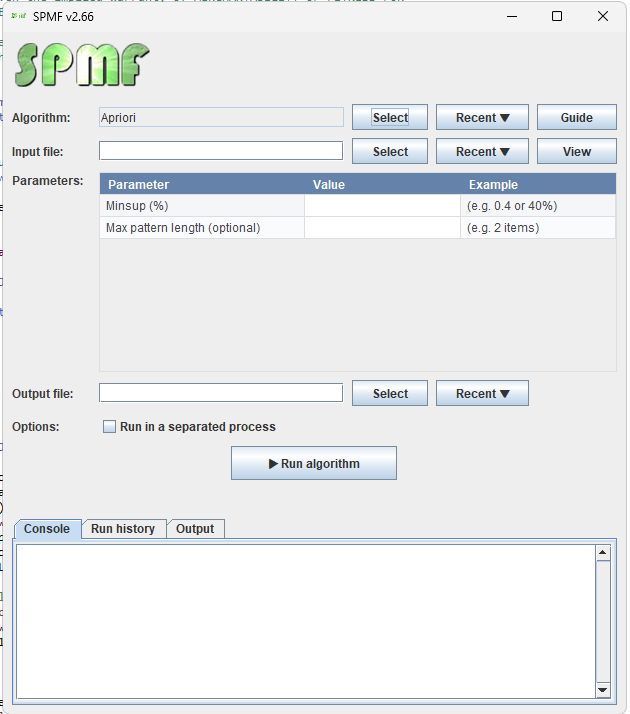
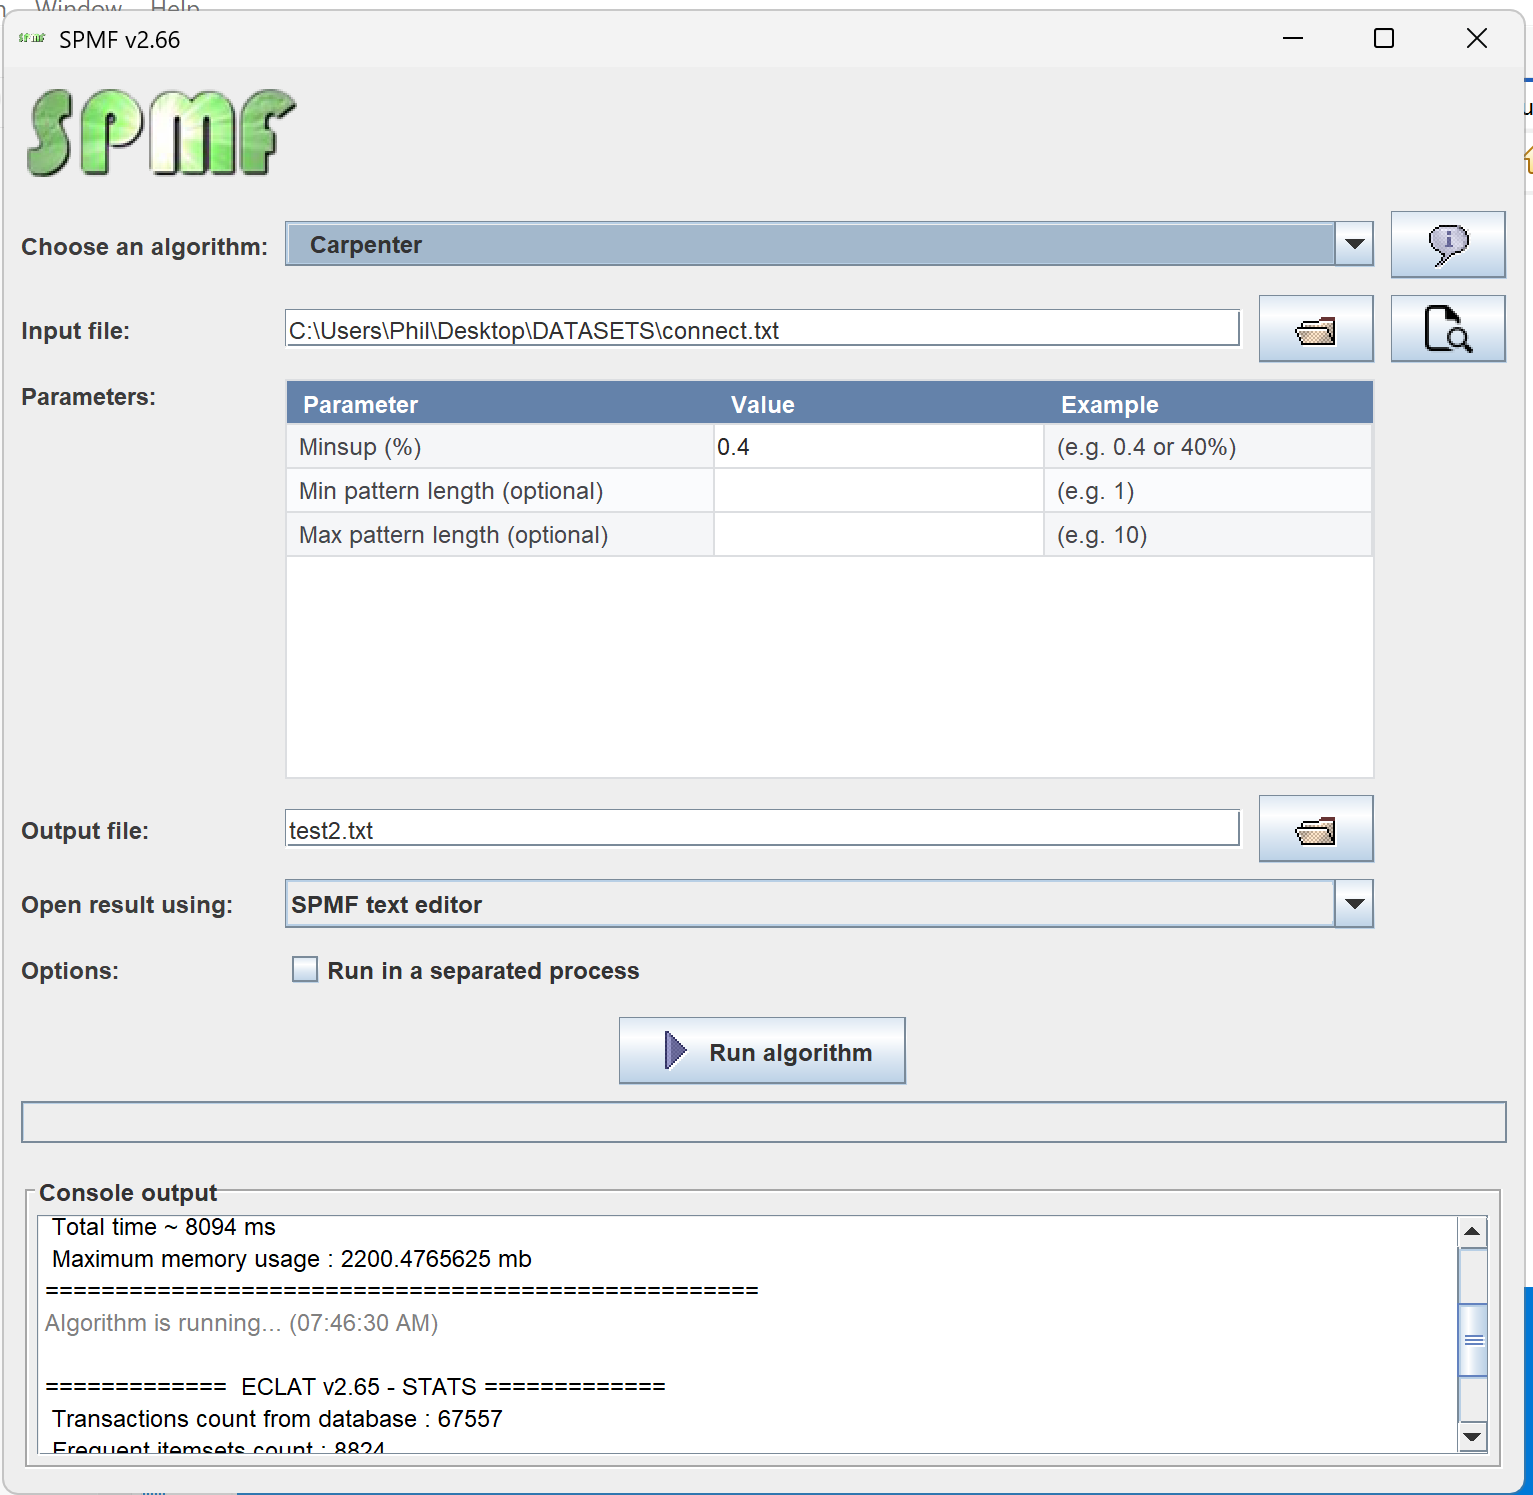
It is a long time that I did not update the main window in the user interface of SPMF. In the next version of SPMF that will be released this month (v.2.66), I have started to make some improvements. Here is a screenshot:
Can you see some improvements?
First, I have added icons for the file selection buttons instead of using text “…”.
Second, the parameter selection table is now visually more beautiful and the columns can be resized, and columns have clearer headers (“Parameter”, “Value” and “Example”).
Third, now it is possible to type the file path directly for the input and output files.
Fourth, the progress bar now show some text for more clarity:
And finally, the window can be resized.
Conclusion
I just wanted to show you this for today! I you have any suggestions, please leave me a message as a comment here or directly by email.
Today, I will talk briefly about a general topic related to research which is academic genealogy. Just as families pass knowledge and traditions across generations, researchers also inherit ideas, methods, and scientific values from their supervisors and mentors. In many fields, tracing academic genealogy offers a glimpse into how research communities evolve over time and how knowledge spreads across countries and institutions.
Usually academic genealogy relationships are defined by the PhD supervisor relationship with PhD students.
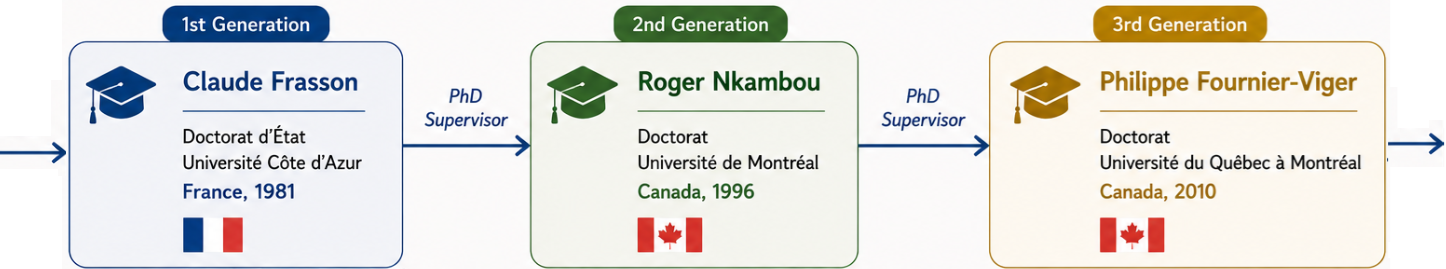
For instance, after searching online (there are different websites), my own academic genealogy is as follows:
Claude Frasson — Doctorat d’État, Université de Nice-Sophia Antipolis (devenue l’Université Côte d’Azur), France, 1981
Roger Nkambou — Doctorat, Université de Montréal, Canada, 1996
Philippe Fournier-Viger — Université du Québec à Montréal, Canada, 2010
This genealogy reflects an academic lineage spanning France and Canada, from various topics such as intelligent tutoring systems and artificial intelligence to data mining and pattern mining research.
May I could find more my own academic genelogy beyond 1981… But this would require a deeper search, and it is not so easy to go back in time.
That’s all for the blog post today. If you have time, you may ask your own PhD supervisor about his academic genealogy!