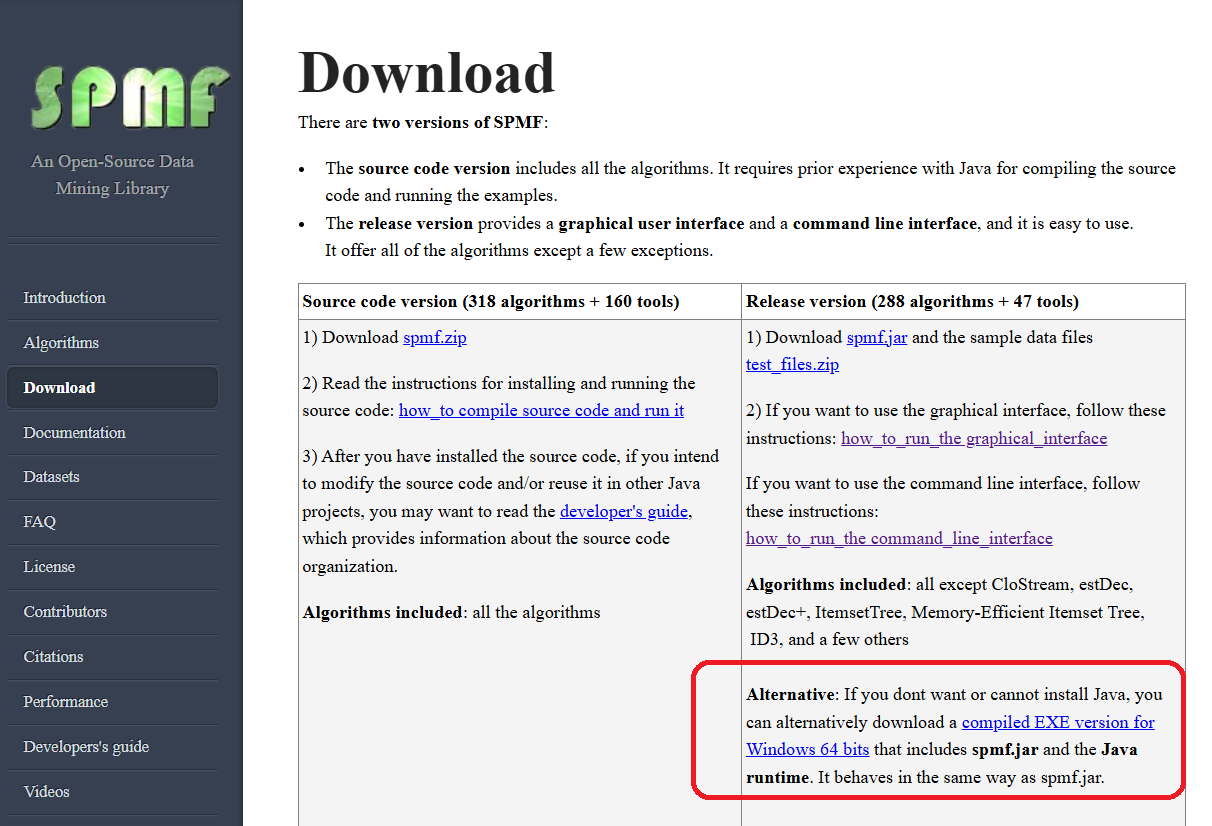
Today, I want to announce that I have included a compiled EXE version of SPMF.jar for Windows 64 bits on the Download page of SPMF. It is especially useful if you cannot or do not want to install Java on a computer.
This portable EXE version of SPMF is slightly bigger (55 mb instead of around 11 mb) because it includes the Java runtime environment.
You can download it from the download page on the website of SPMF:
Later, I might also include a compiled version for Linux and other platforms, if some people request it.
Over the years, I have developed the SPMF library with collaborators as a comprehensive toolkit for pattern mining, with the goal of making a large number of algorithms easily accessible for research and teaching. While SPMF has been widely used in its Java form and sometimes in other languages through wrappers or its command line interface, I have often felt the need to provide more ways to interact with SPMF.
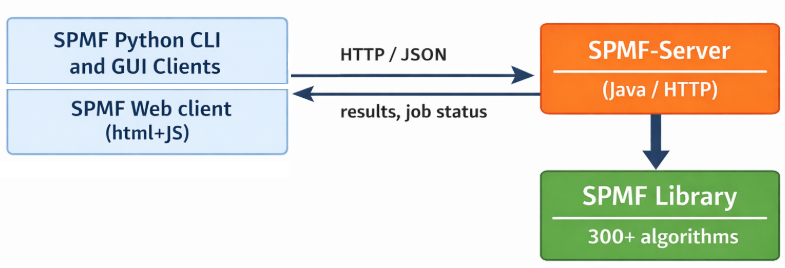
Hence, I have started a new project a few months ago, but just released a first version today: SPMF-Server. The idea is to provide a REST server implemented in Java that allows to query the SPMF library remotely or on the same computer from any language by submitting jobs to the server. The idea behind SPMF-Server is simply to decouple the mining engine from the client code. Instead of embedding SPMF directly, a user can run a server and interact with it through HTTP requests. This is an early work and comments are welcomed. In this blog post, I will give an overview
General Idea
SPMF-Server is a small REST API that exposes the algorithms of SPMF. A client sends can query it by sending the name of an algorithm, its parameters, and some input data, and the server executes the task and returns the result. Each job is executed in a separate Java process, and the client can query its status, retrieve the output, and inspect the console logs if needed. The interaction is intentionally simple and based on JSON. The overall architecture can be seen as follows:
SPMF-Server 1.0 and SPMF-Server-Clients 1.0
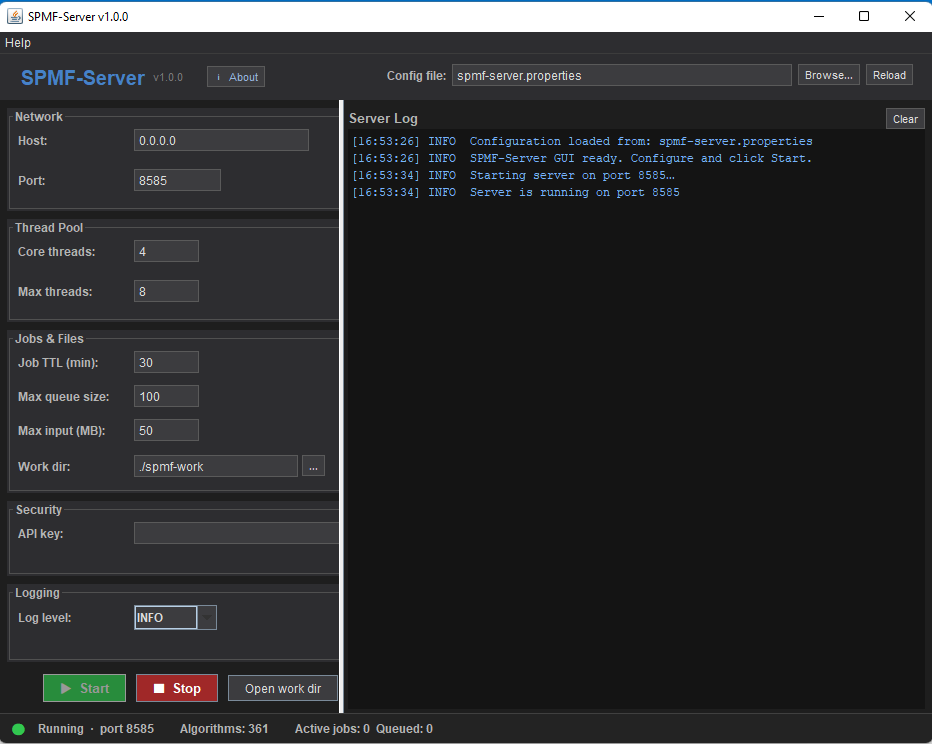
This is an initial release. The core features are implemented, including: submitting mining tasks, monitoring their execution, retrieving results and execution logs, configuration through a properties file. At this stage, the project should be seen as a working prototype and I will do further testing and improvements to fix bugs and improve performance. SPMF-server can run as a headless server or through a GUI:
SPMF-Server 1.0
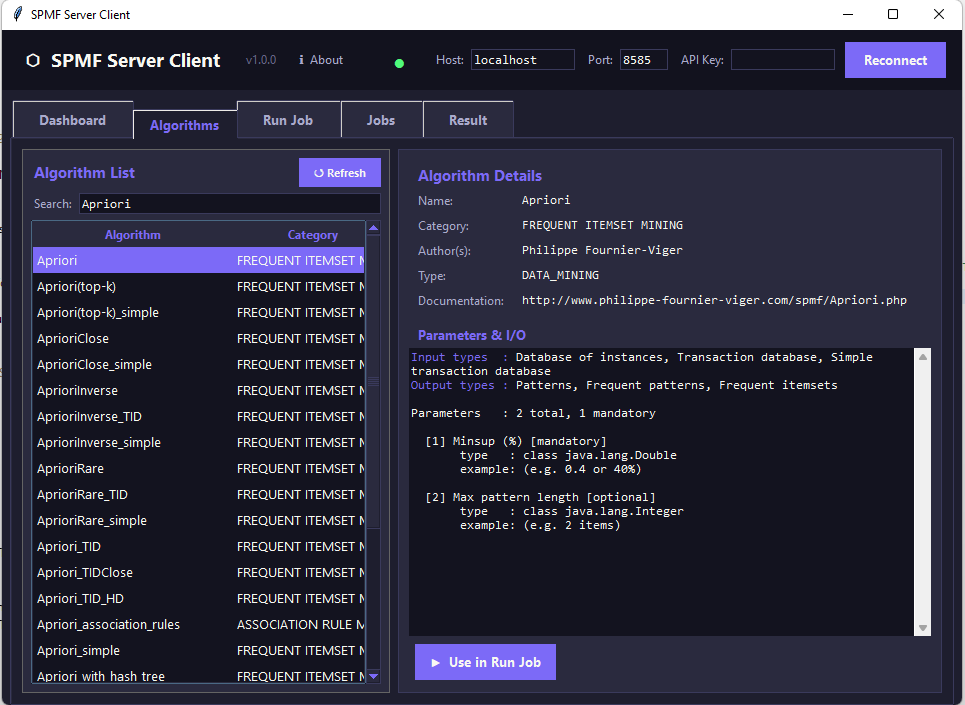
Alongside with the server, I have also started a separate project providing two simple Python clients to connect to the SPMF-Server. The first one offers a commandline interface while the second one provides a GUI. Below are a few screenshots of the GUI. This is the algorithm selection tab:
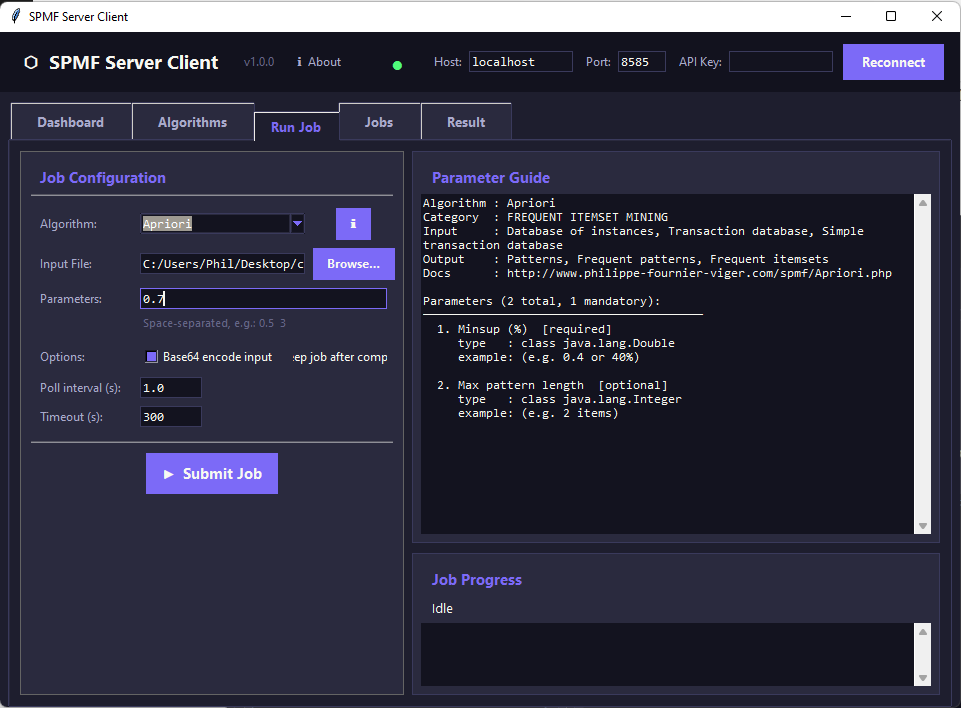
This is the tab for running a job by selecting a file and algorithm parameters:
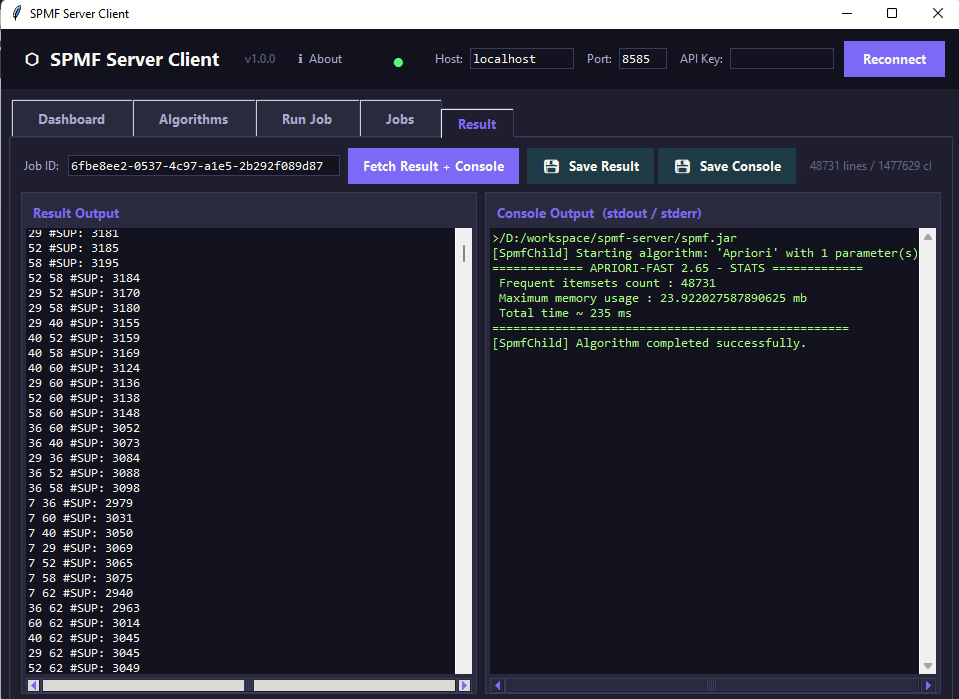
This is the tab for viewing results from any job that was run on the server:
How to try ?
You can download both the SPMF-Server and SPMF-Server clients from these Github repositories:
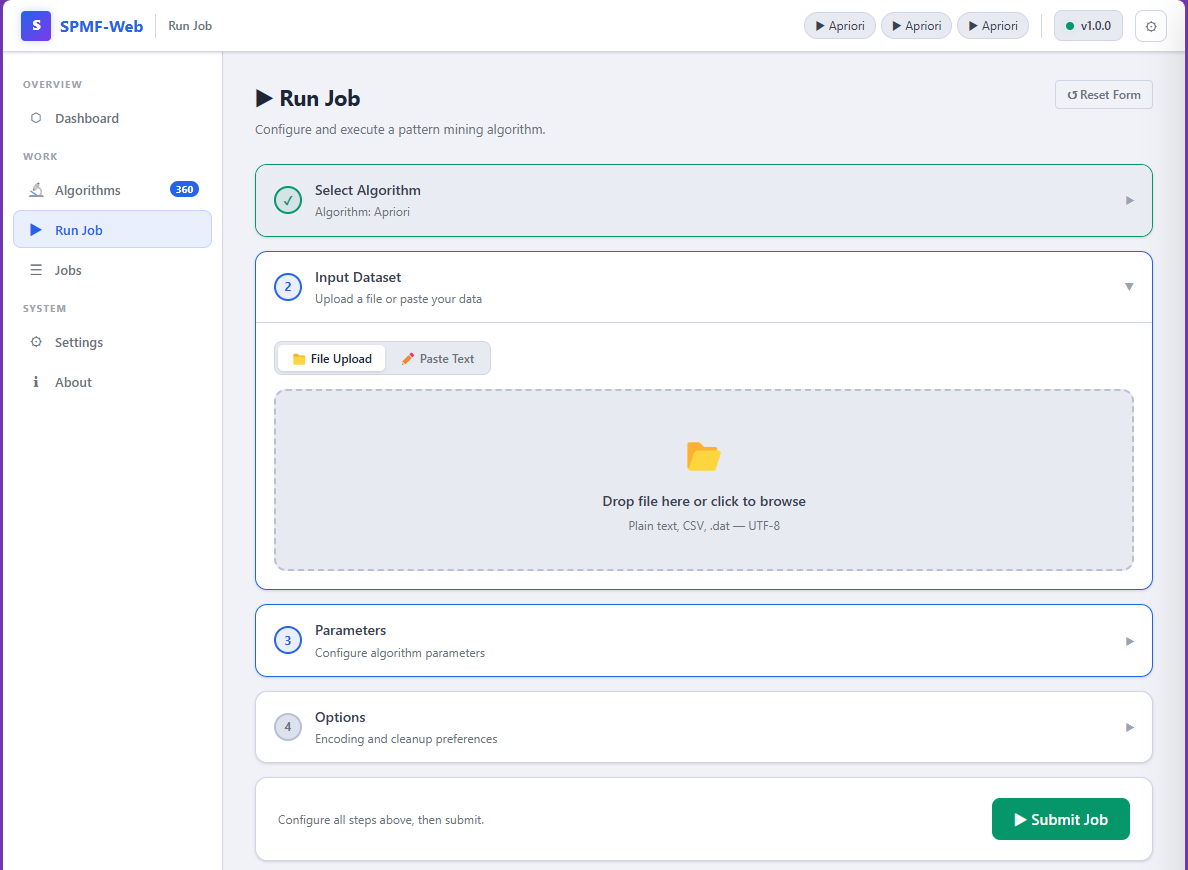
Here is a screenshot of the SPMF Server Web client:
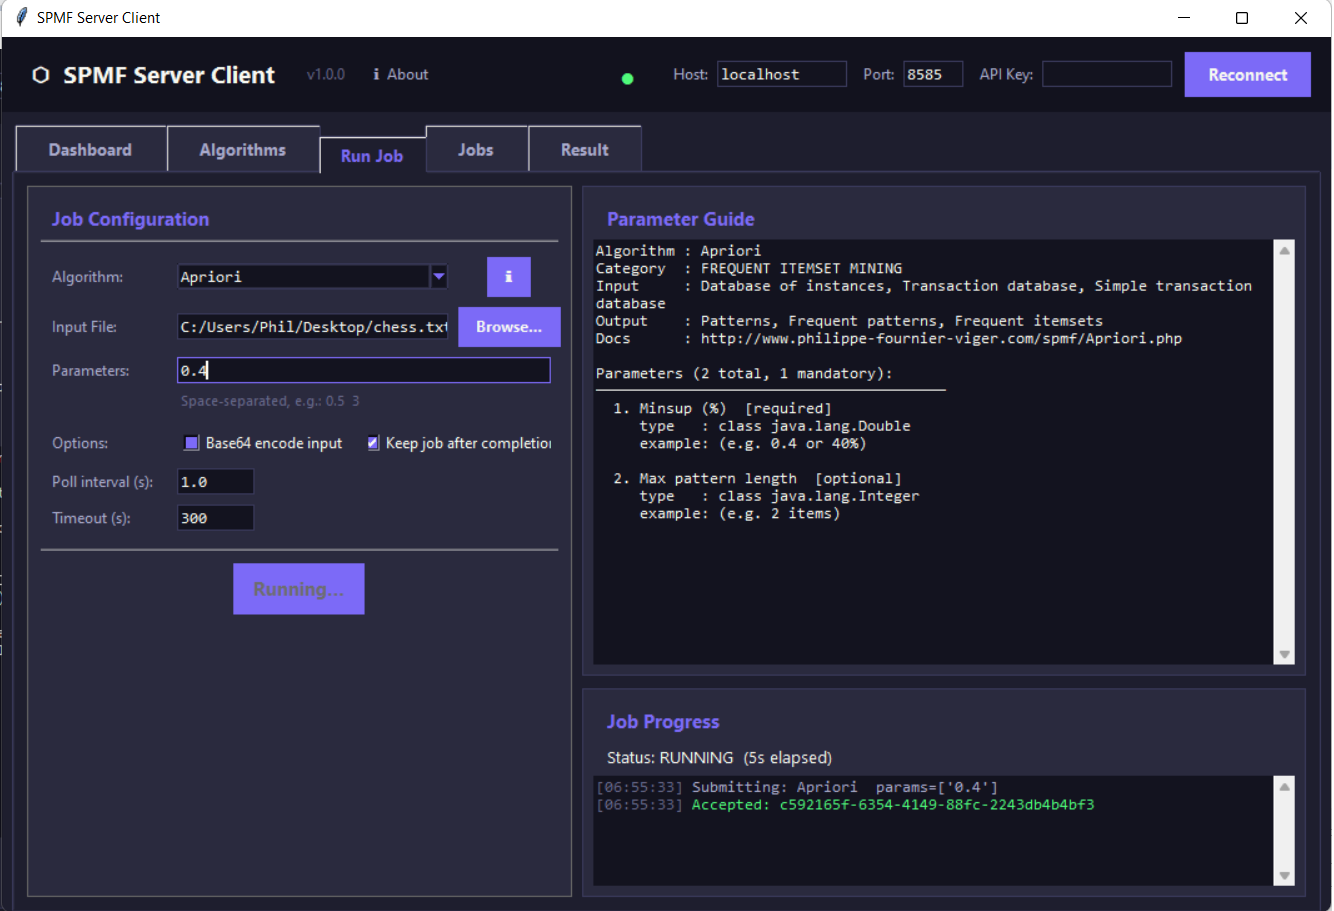
And here is a screenshot of the SPMF Server Python GUI Client:
Conclusion
In the future, there will be also clients for other programming languages, and the overall idea will be improved. If you try it and encounter issues or have suggestions, I would be very interested in hearing your feedback. Any comments are welcome!
In this post, I want to talk about a special session on Knowledge Science and Intelligent Computing (KSIC) that I am co-organizing this year at the SOMET 2026 conference (25th Int. Conf. on Intelligent Software Methodologies, Tools, and Techniques). I would like to invite you to submit your research papers!
The conference proceedings will be published by IOS Press and indexed in SCOPUS. The important dates are:
Deadline:April 14, 2026 (updated)
Notification to authors: May 10, 2026.
Camera-Ready papers: June 15, 2026.
Relevant topics include, but are not limited to, the following:
Knowledge Reasoning and Representation
Knowledge-based software engineering.
Knowledge Representation and Reasoning
Knowledge engineering application.
Ontological engineering.
Symbolic reasoning in Large Language Models
Reality automated generation
Cognitive foundations of knowledge
Intelligent systems.
Intelligent Information Systems.
Robotics and Cybernetics.
Distributed and Parallel Processing.
Aspects of Data Mining.
Bio-informatics.
Knowledge extraction from text, video, signals and images.
Search and Mining of variety of data including scientific and engineering, social, sensor/IoT/IoE.
Intelligent Computational Modeling.
Mobility and Big Data.
Session Organizers ▪ Nhon V. Do, Hong Bang International University, Vietnam. ▪ Philippe Fournier-Viger, Shenzhen University, China. ▪ Hien D. Nguyen, University of Information Technology, VNU-HCM, Vietnam.
For more information about the special session and conference, click here.
Today, I want to announce that a new version of the SPMF data mining library and software has been released, which is version 2.65. This version bring several improvements, including 8 new algorithms, several optimizations, and new user interface tools for data analysis, and some tools for data processing. The details of this new version can be found on the download page of SPMF. Here is a brief overview.
Eight new algorithms:
the LinearTable algorithm for mining frequent itemsets, which can work especially well when the number of items is relatively small. This algorithm has very low memory usage in some cases (Lu et al. 2023)
The SAM algorithm for mining frequent itemsets (Borgelt et al., 2009)
The TM algorithm for mining frequent itemsets (Song et al., 2006)
The NEWCHARM algorithm for mining frequent closed itemsets (Ye et al., 2015)
The DBVMiner algorithm for mining frequent closed itemsets (Vo et al., 2012)
The FTARM algorithm for top-k association rule mining, which is a variation of ETARM with additional strategies (Liu et al., 2019)
The ETARM algorithm for top-k association rule mining, which is a variation of TopKRules with additional pruning strategies (Nguyen et al., 2017)
The AprioriTID_HD algorithm, a modification of AprioriTID for better performance (thanks to Harshil Damania for proposing this improvement )
Performance improvement
I have added several optimizations to improve the performance of algorithms such as Apriori, AprioriClose, Eclat, Relim, AprioriInverse, AprioriRare, AprioriTopK, dEclat, Charm, dCharm, TopKRules, TopKClassRules, etc. In some case, the speed can be improved by several times and the memory performance reduced considerably.
New user interface tools
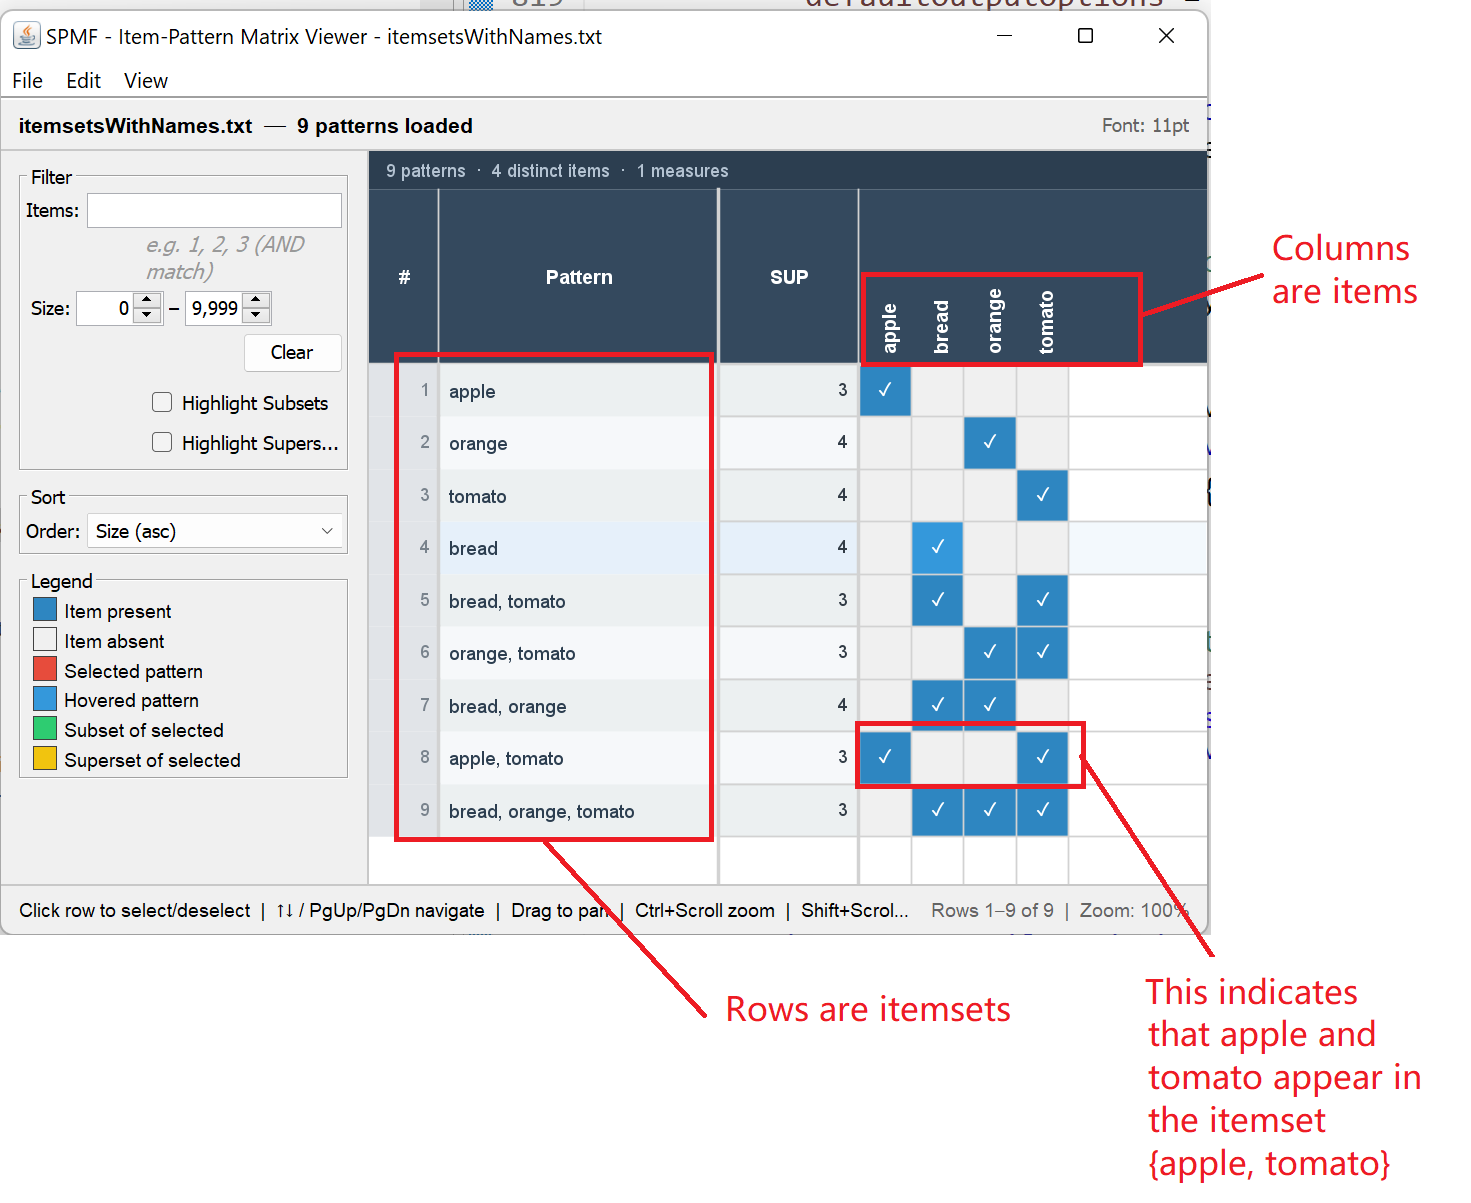
One new user interface tools is the Itemset-Item Matrix Viewer, which allows to visualize the relationship and similarities between itemsets discovered by itemset mining algorithms. Here is a screenshot:
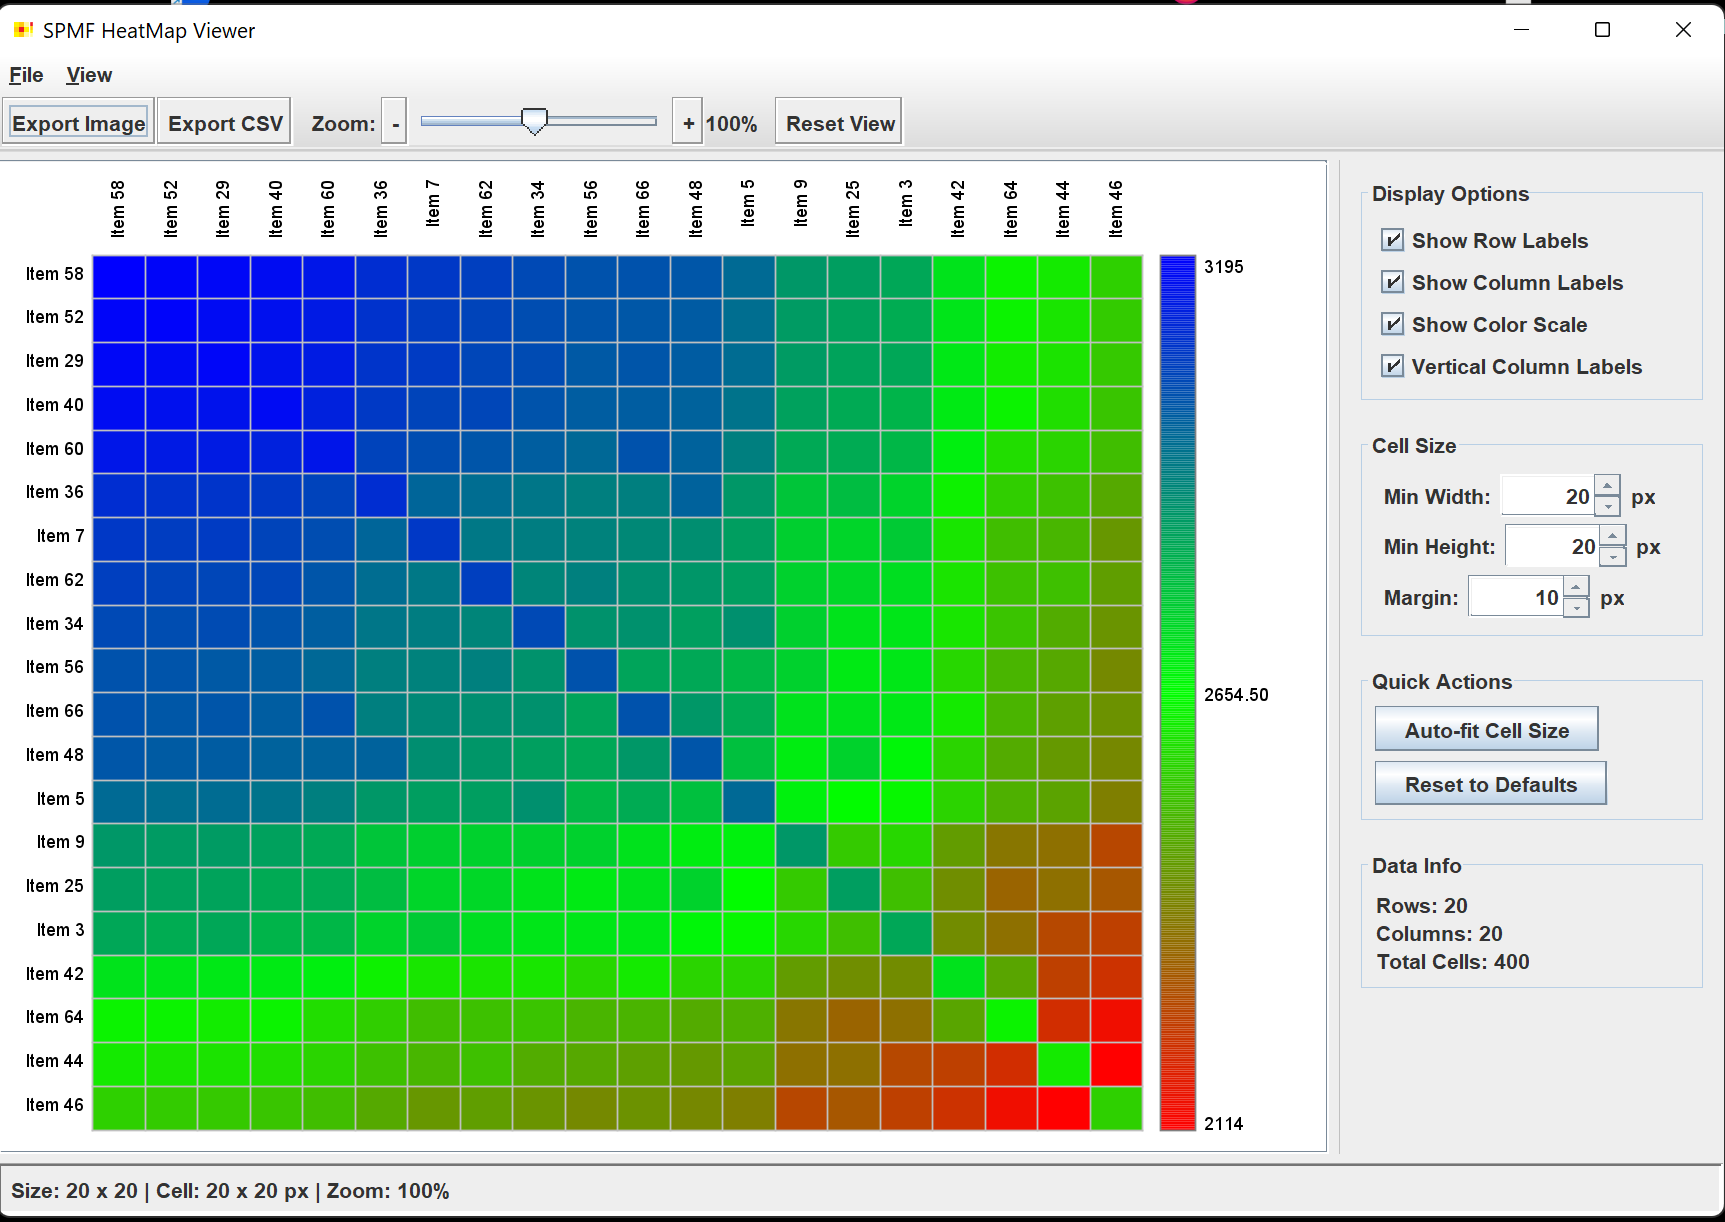
There is also a new Item Co-Occurrence HeatMap Viewer to visualize co-occurrences between items in transaction databases. For example, here is a visualiztion of the co-occurrences of the top 20 most frequent items in the Chess dataset:
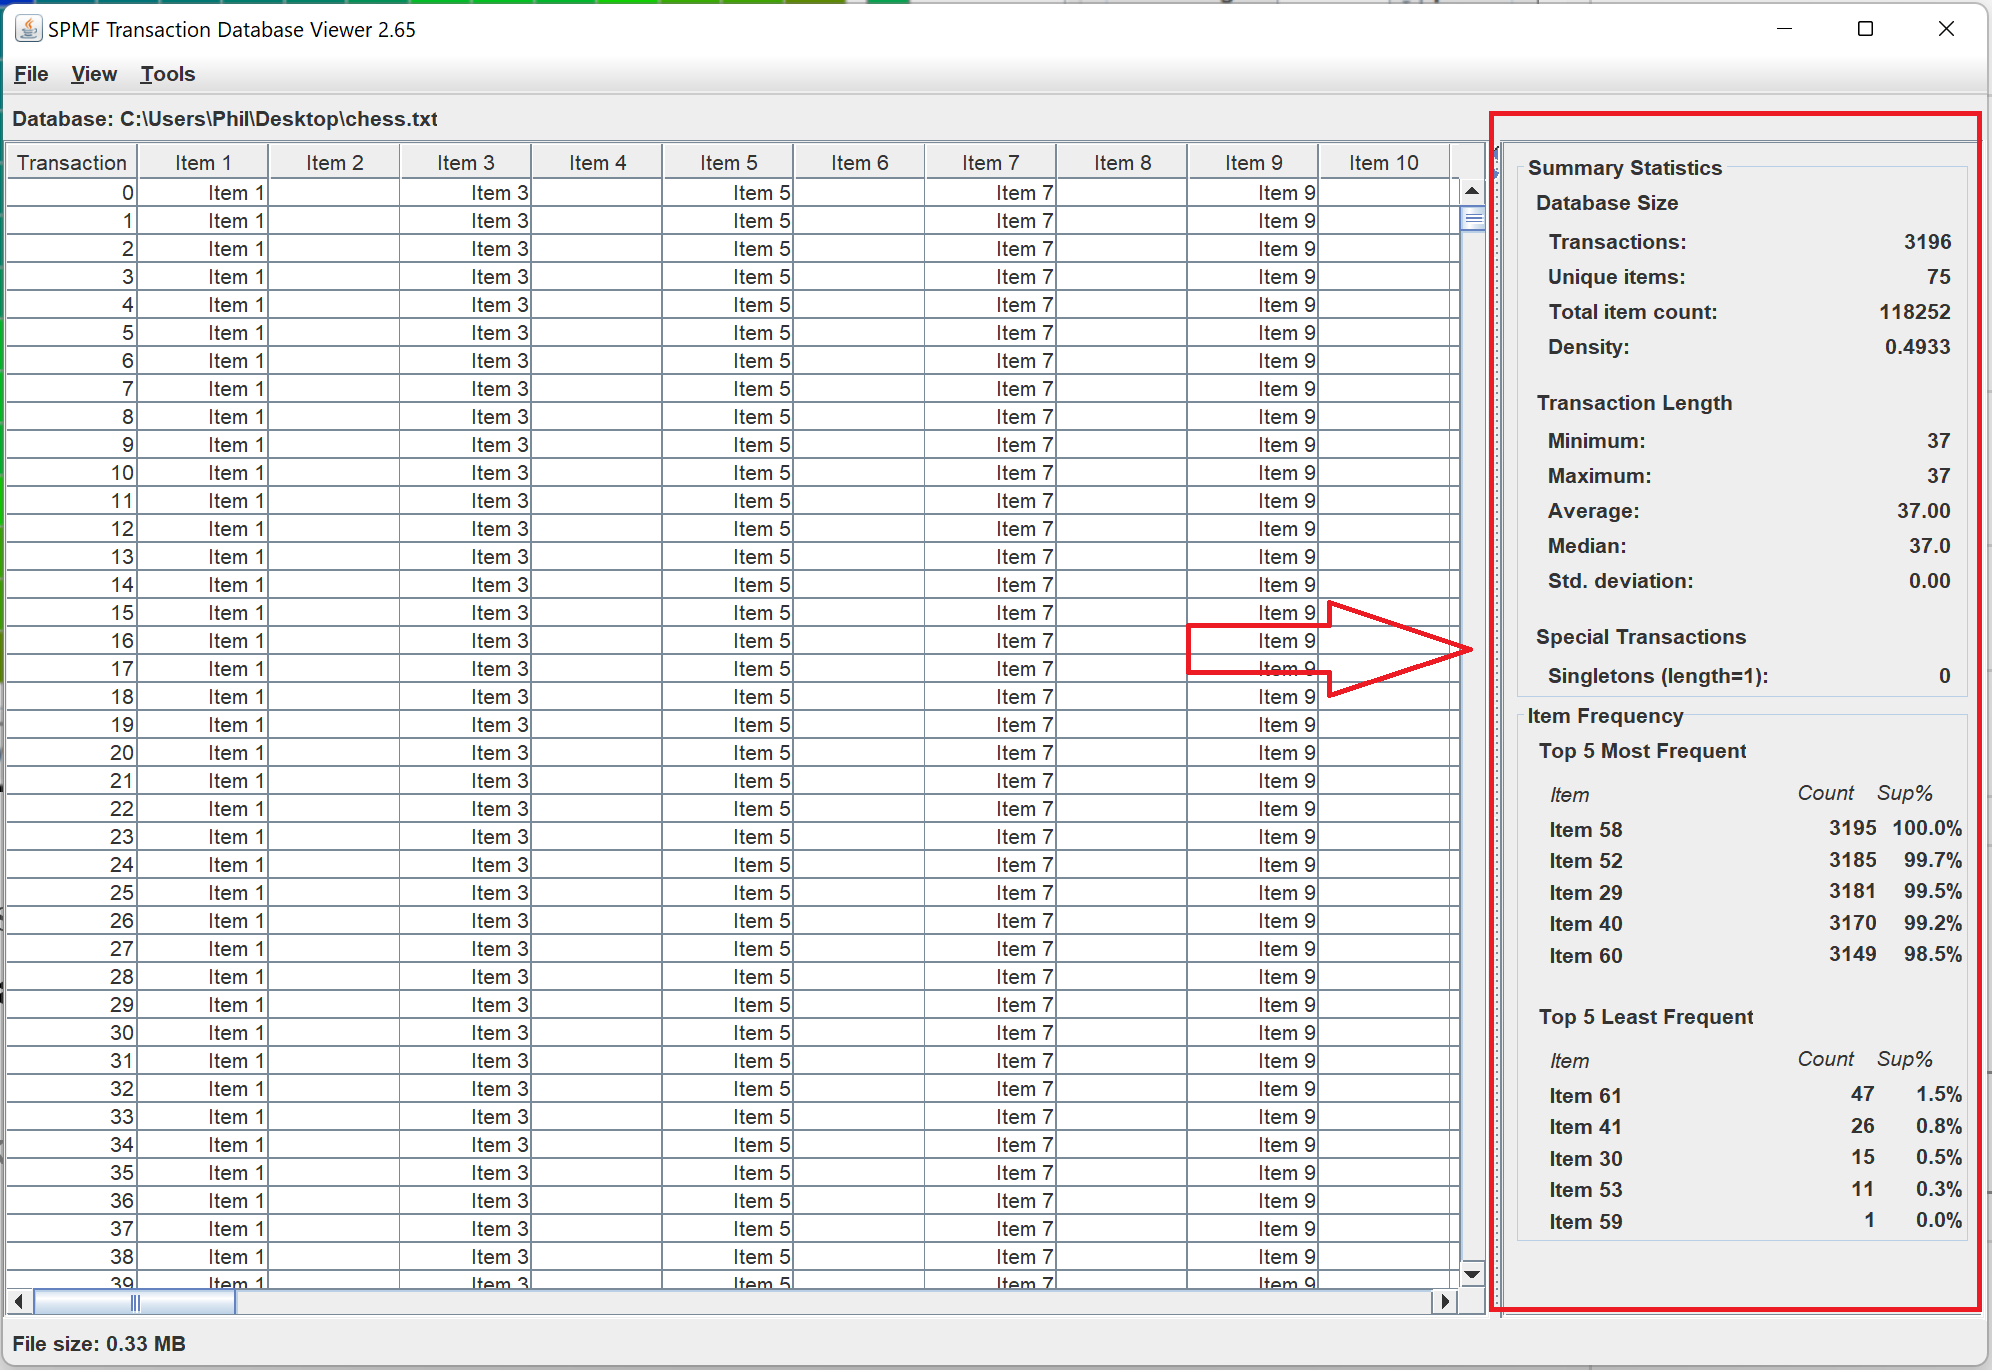
I have also added panels in the dataset viewers to provide interesting statistics about datasets. For example, for the Transaction dataset viewer:
Bug fixes
I have also fixed various small bugs.
Conclusion
This is just a quick overview of this new version of the SPMF pattern mining software, version 2.65. Thanks again to all users of SPMF and contributors for your support!
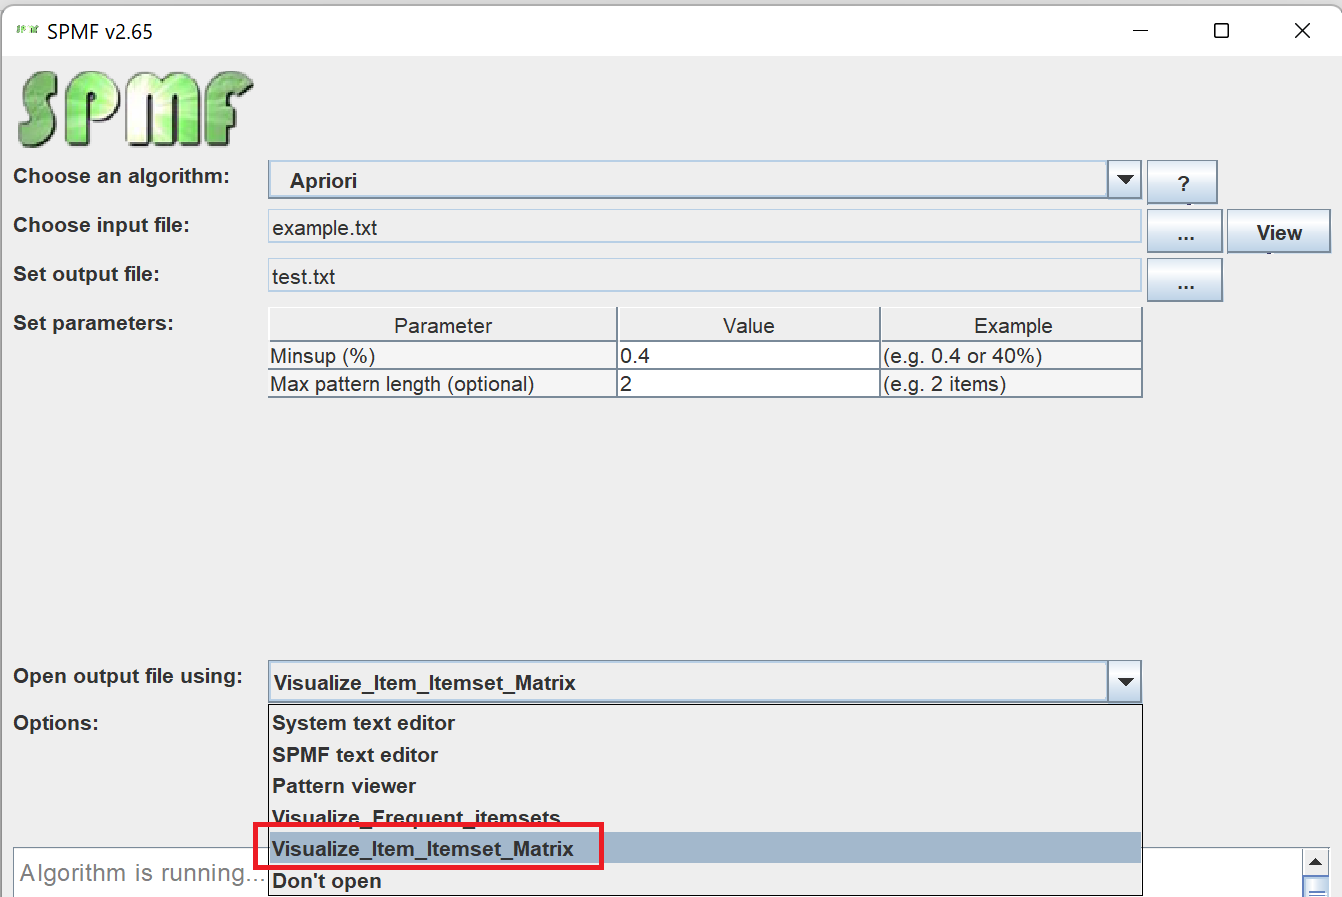
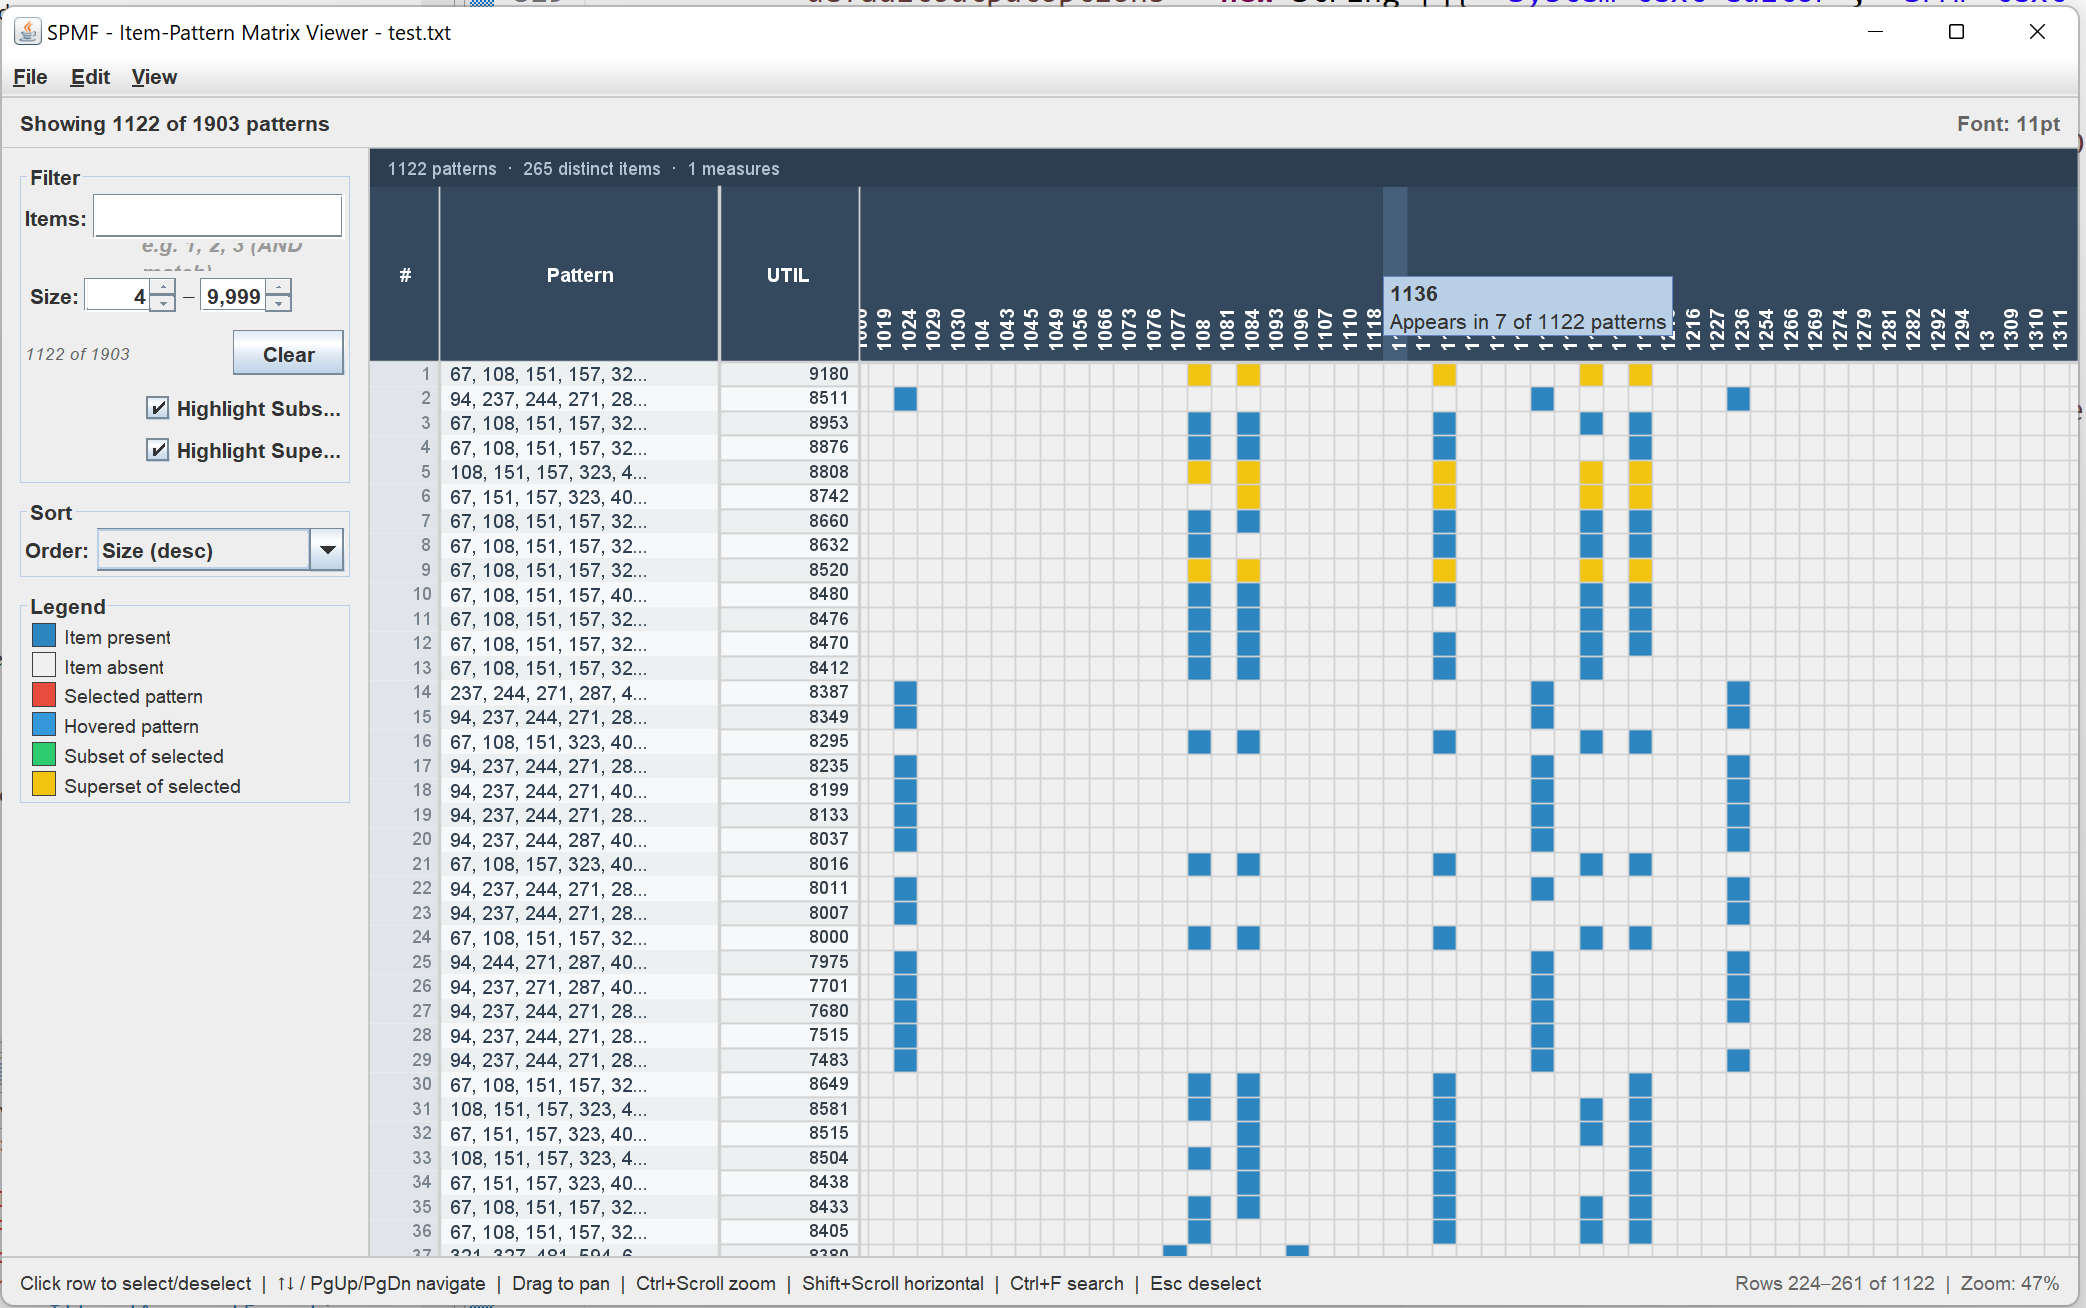
Today, I will talk to you about a new for visualizing itemsets that will be released soon in SPMF 2.65. This tool called the Itemset-Item Matrix Viewer will be available for any algorithm that produce itemsets to visualize results in an intuitive way. To use it, the user will have to select an itemset mining algorithm and then select the Itemset-Item Matrix Viewer as the method for visualizing the result:
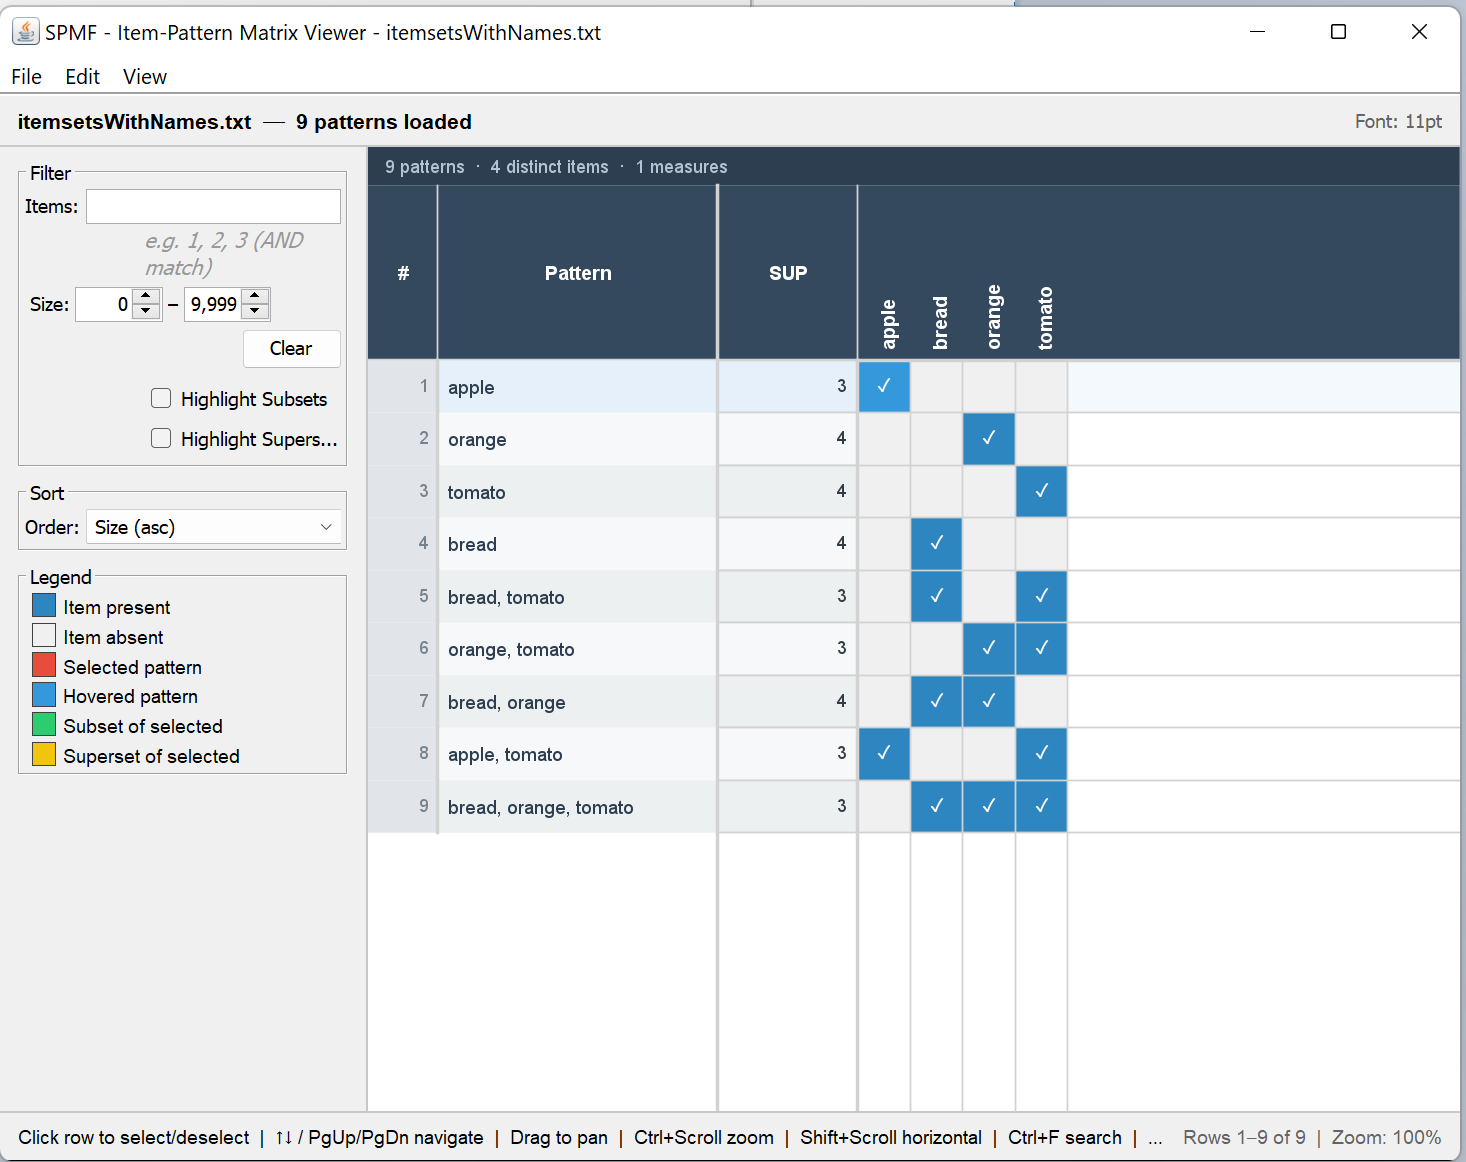
Then, after running the algorithm, the matrix viewer will be opened to display the results. For example, lets say that I run the Apriori algorithm to mine frequent itemsets in a simple dataset. The interface of the Matrix Viewer will present the itemsets found as follow:
I will explain the main features. First, on the right, there is a matrix view, where rows represent itemsets and columns represent items from the dataset. The presence of an item in an itemset is represented by a colored blue rectangle:
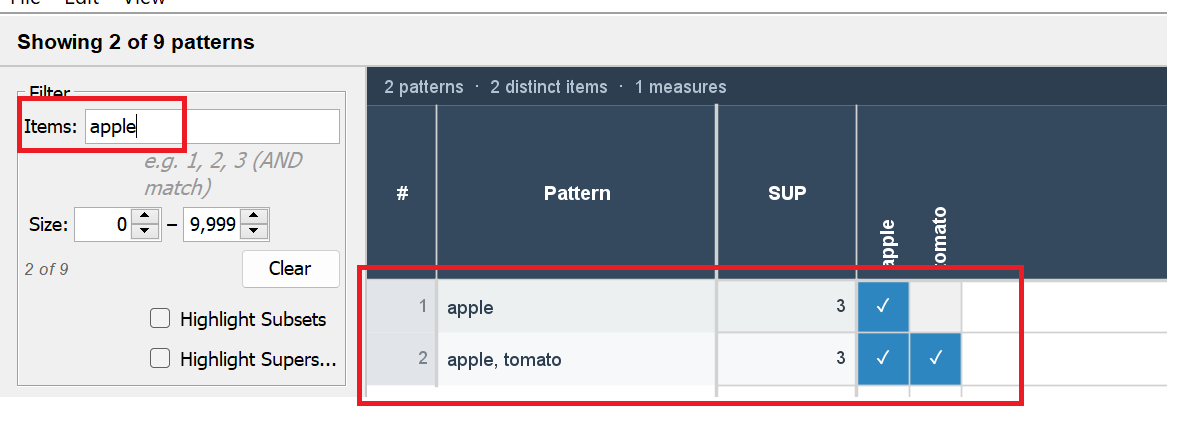
This matrix representation is useful as it allows to quickly see items that are common to different itemsets and to have a clear representation of the size of an itemset. Besides, on the left panel of the interace, it is possible to filter itemsets by item. For example, here I apply a filter to display only patterns with Apple:
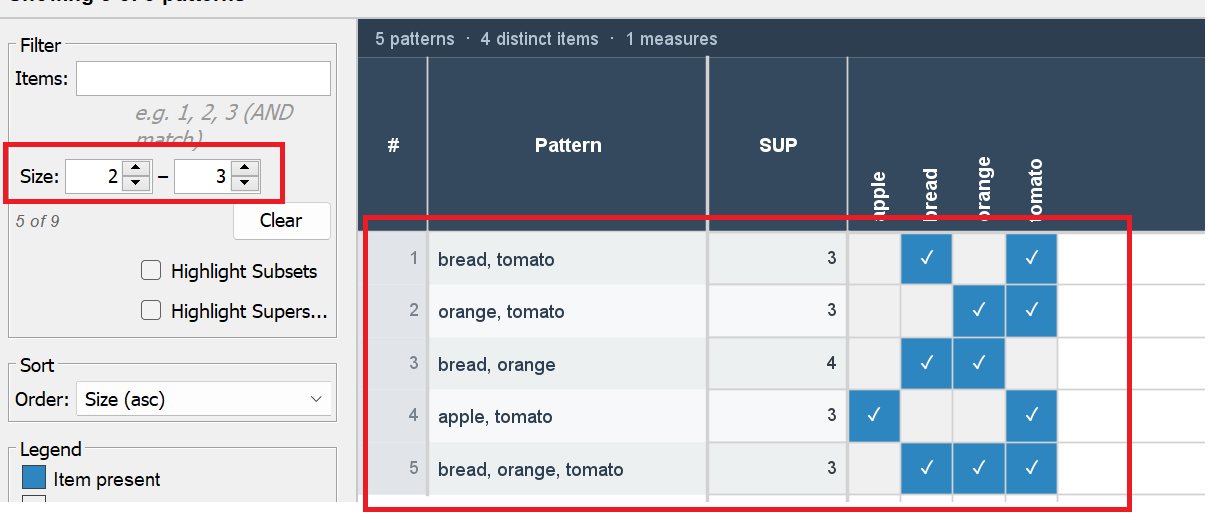
It is also possible to filter patterns by size. For example, I here apply a filter to see only patterns with 2 to 3 items:
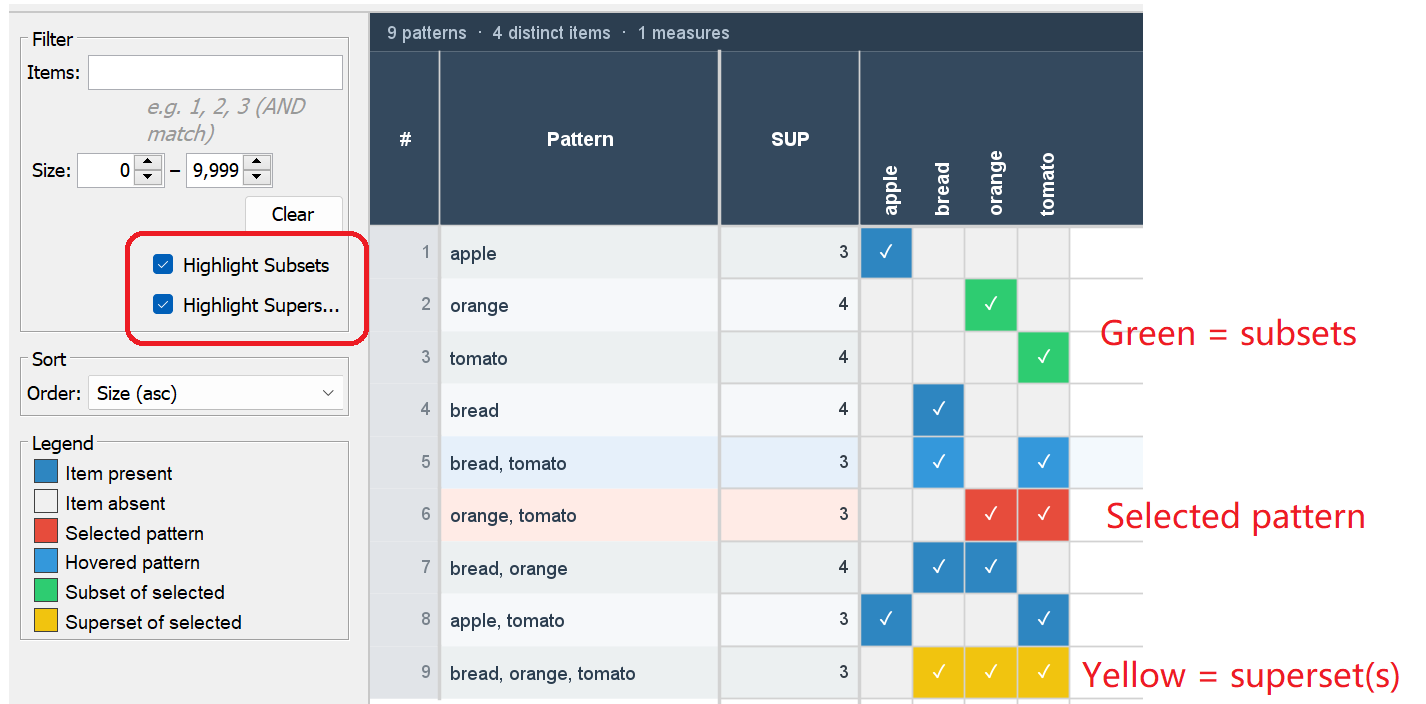
Besides that another interesting features is to highlight the subsets and supersets of the currently selected itemset. For example:
This matrix viewer is quite intuitive and can display larger set of patterns as well. For example, here is an example with high utility itemsets found in the foodmart dataset with hundreds of patterns:
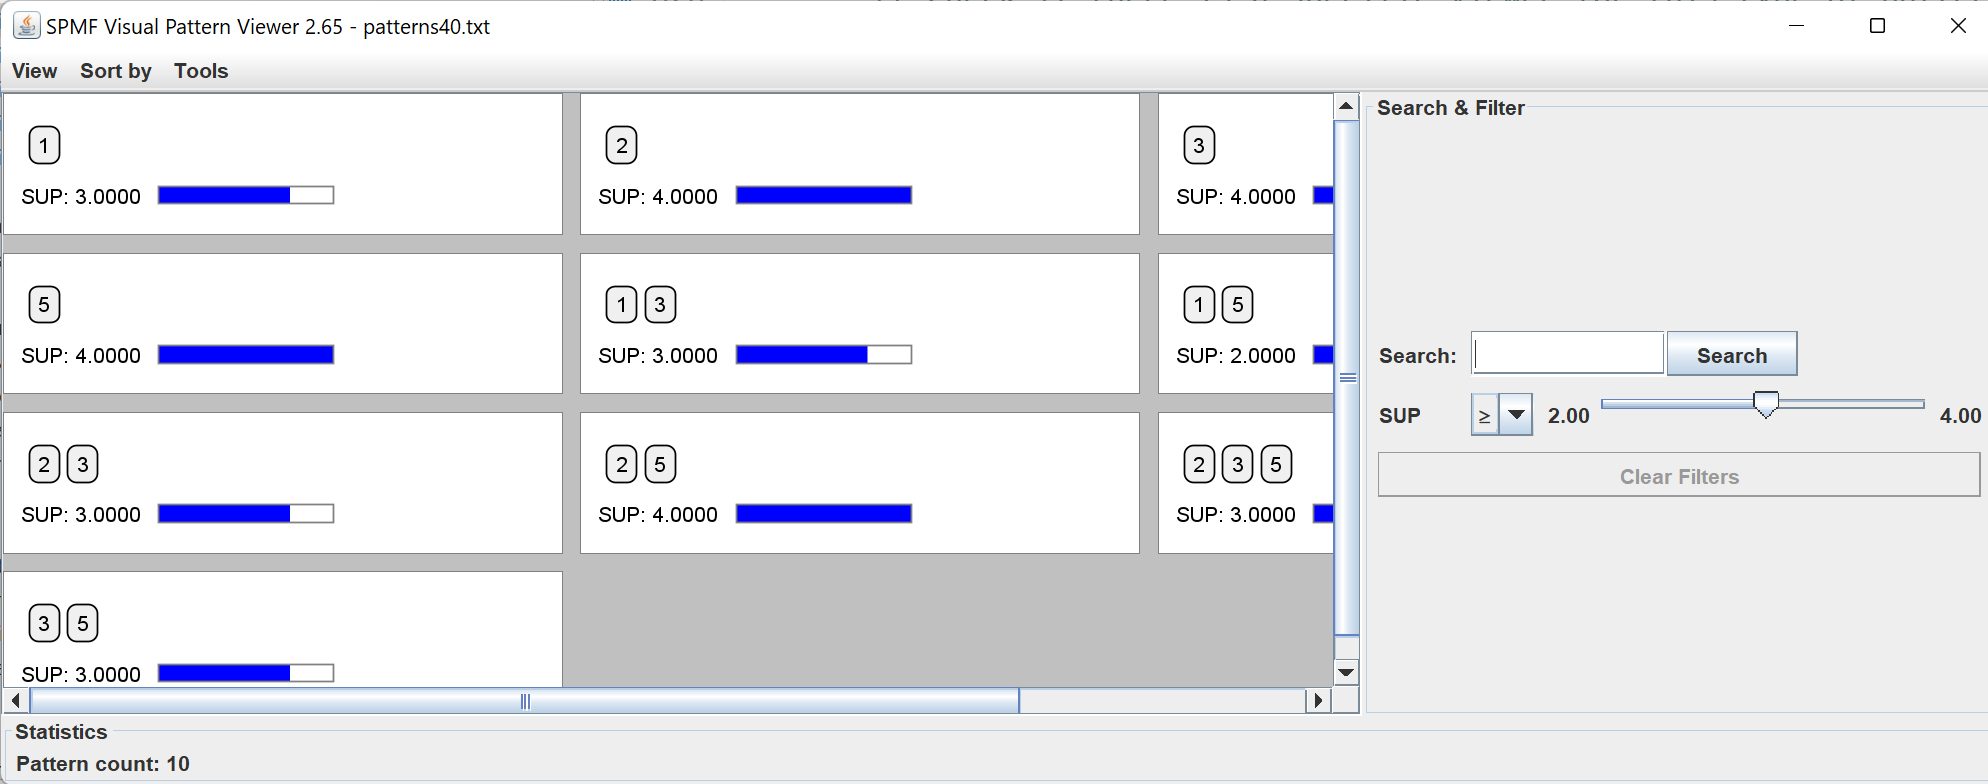
Note that in SPMF, the itemset can also be displayed using the Visual Pattern Viewer, introduced last year in SPMF:
This is just a brief overview of what is upcoming in SPMF. More algorithms and features will be coming soon… I will give you more details later.
Thanks again to all users and contributors of SPMF.
Just a short blog post today to wish you happy holidays and Merry X-Mas to those who are celebrating it, among the users of SPMF! Thanks again for your support!
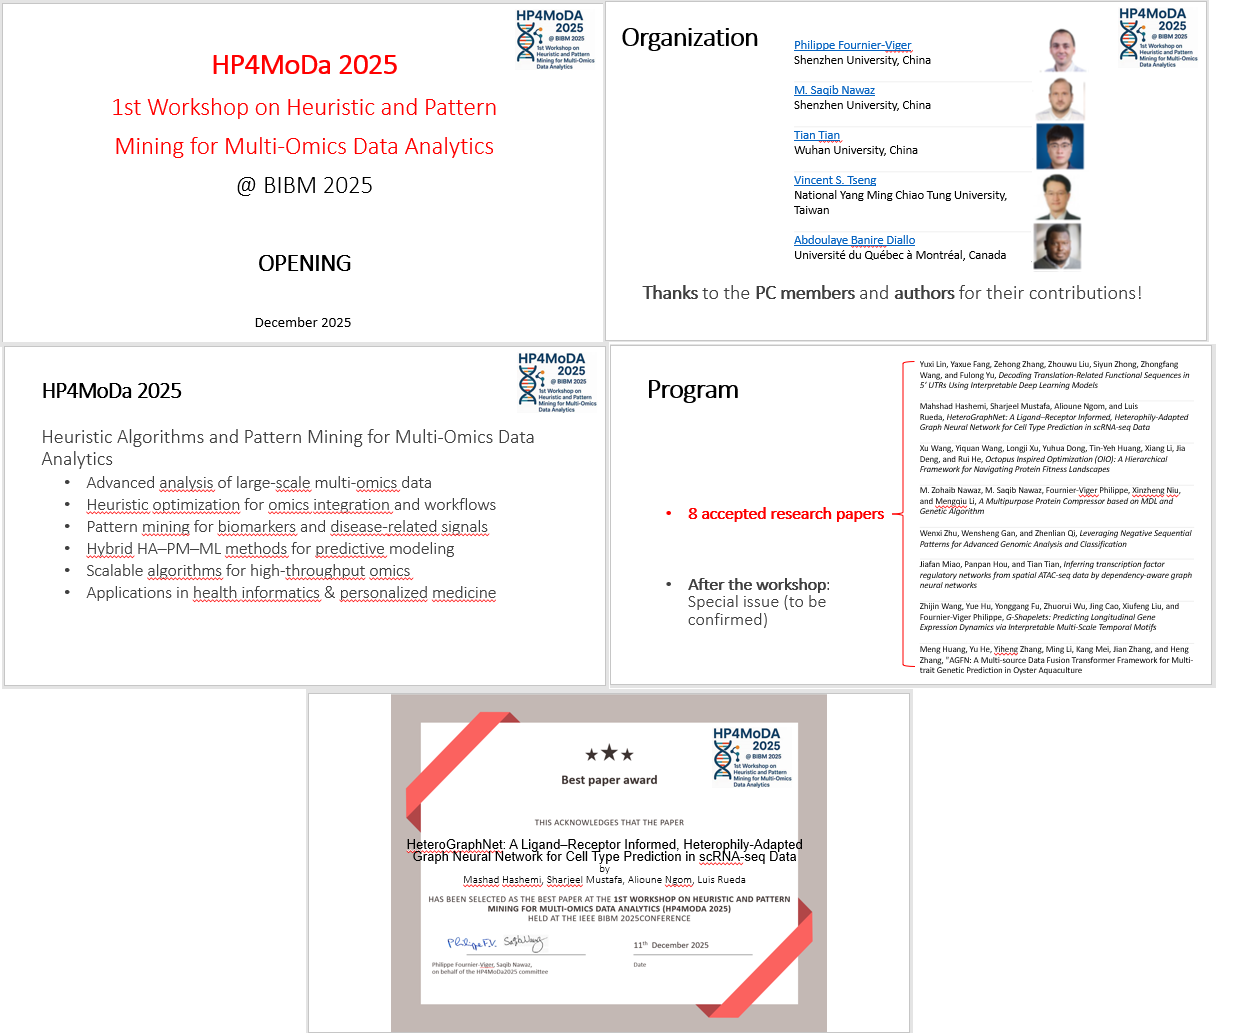
Today, the first workshop 1st Workshop on Heuristic and Pattern Mining for Multi-Omics Data Analytics was held at IEEE BIBM 2025, online. I co-organize this workshop with M. Saqib Nawaz and other collaborators. The workshop focus on various machine learning and pattern mining methods and their applications to the analysis of multi-omics data.
Here are the slides from the opening ceremony:
It was announced that 8 papers have been accepted by the workshop this year. They cover multiple topics such as interpretable deep learning for regulatory sequence analysis, graph neural networks for single-cell and spatial omics data, heuristic and bio-inspired optimization for protein fitness landscapes, minimum description length and evolutionary approaches for protein compression, advanced sequential and temporal pattern mining methods, and multi-source data fusion models for predicting complex genetic traits.
We also mentioned that we are currently working to organize a special issue for extensions of the papers (to be confirmed later).
We also announced that the best paper award of the workshop was given to this paper by researchers from Canada:
Mahshad Hashemi, Sharjeel Mustafa, Alioune Ngom, and Luis Rueda, HeteroGraphNet: A Ligand–Receptor Informed, Heterophily-Adapted Graph Neural Network for Cell Type Prediction in scRNA-seq Data
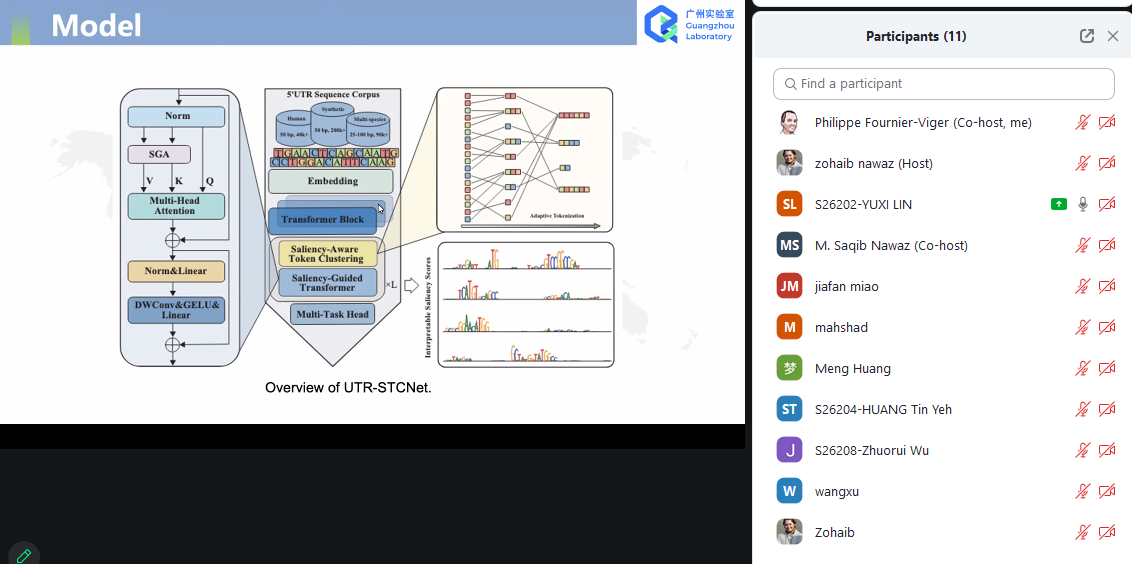
There was several interesting presentations on diverse topics. Here for example, a screenshot from the first paper presentation by Lin, Yuexi et al. about Decoding Translation-Related Functional Sequences in 5’ UTRs Using Interpretable Deep Learning Models:
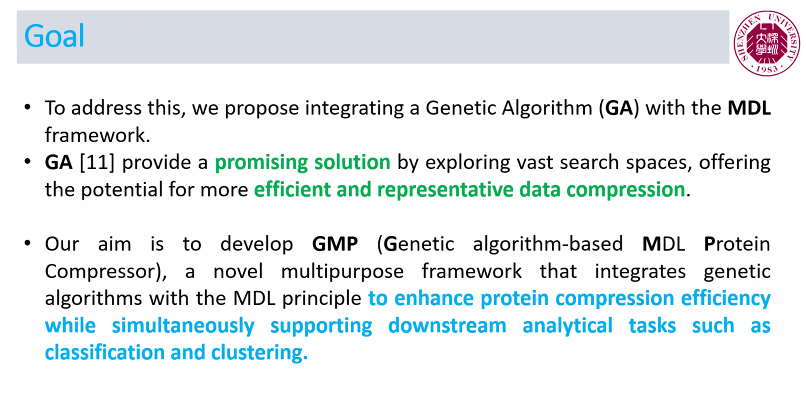
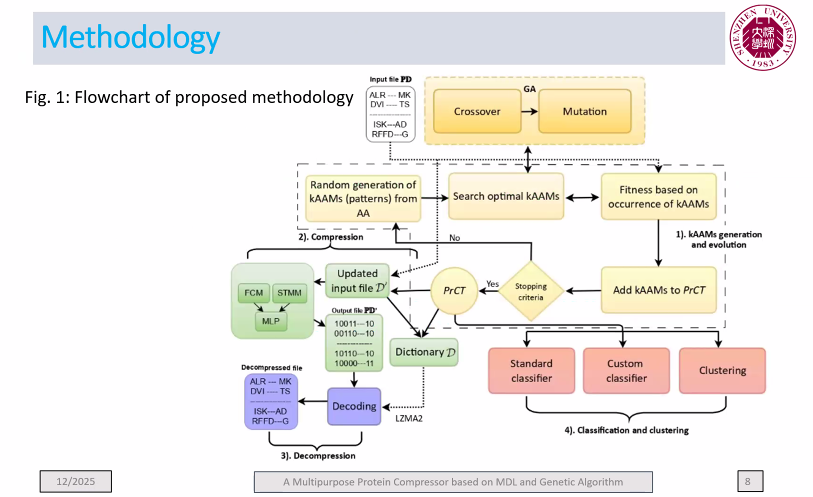
Among the papers, my PhD student presented a new algorithm called GMP for protein sequence compression based on pattern mining. Here are a few slides to show an overview:
This is just a short report about the workshop. It has been a success for the first edition of this workshop. We thus plan to organize it again next year!
Thus, today, I make a new release of SPMF for December 2025, called version 2.64b. This release has several new algorithms:
The HMP-SA algorithm for discovering compressing itemsets in a transaction database using a simulated annealing approach (Chen, E. et al., 2026).
The HMP-HC algorithm for discovering compressing itemsets in a transaction database using a hill-climbing approach (Chen, E. et al., 2026).
the GENMAX algorithm for mining frequent maximal itemsets from a transaction database (Gouda et al., 2005)
the DIC algorithm for mining frequent itemsets in a transaction database using dynamic itemset counting (Brin et al. 1997)
the Talky-G and Talky-G-Diffset algorithms for mining frequent generator itemsets in a transaction database (Szathmary, 2009)
the iMEFIM algorithm for high utility itemset mining, a variation of EFIM that can be faster but can consume more memory (Nguyen et al., 2019)
the PUCPMiner algorithm for high utility itemset mining, a variation of FHM with a potentially tighter upper bound (Patel et al., 2022
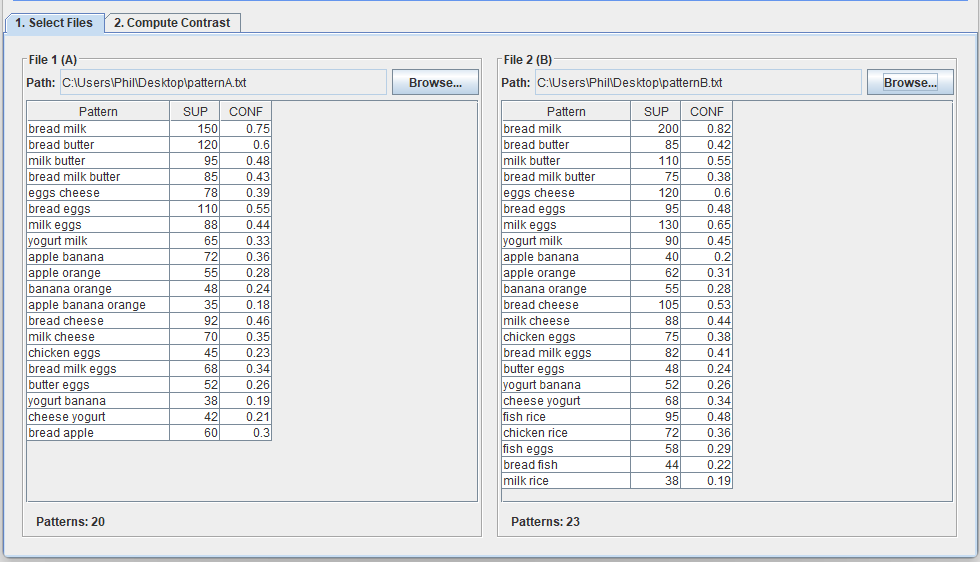
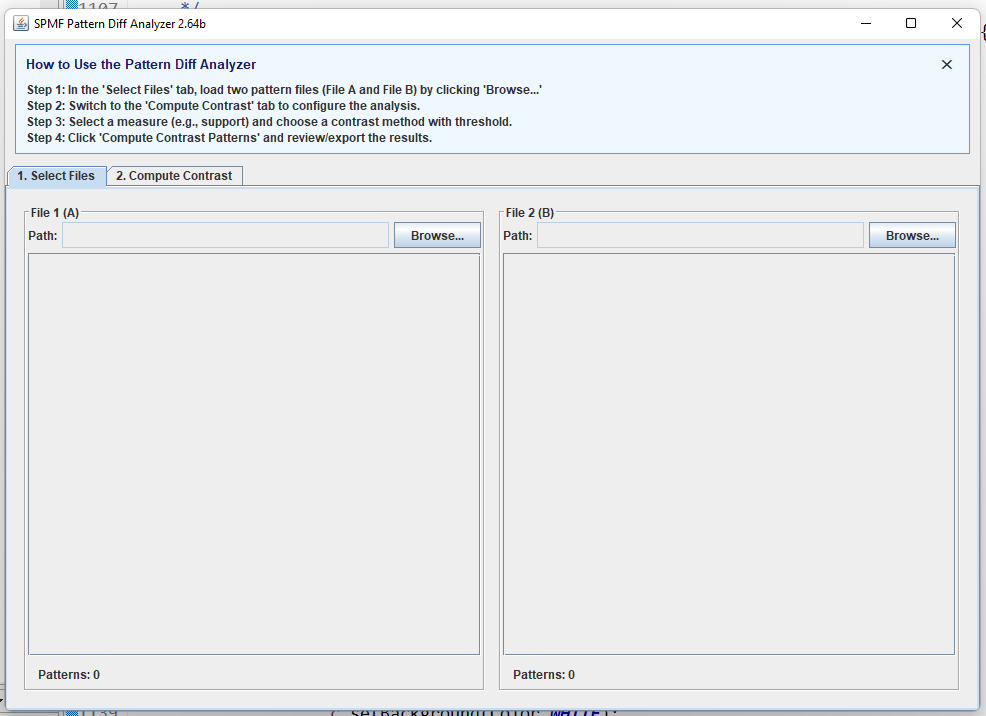
Moreover, there is a new Pattern Diff Analyzer tool that allows to compare two pattern files to find contrast patterns. This tool works letting the user first select two files containing patterns:
And then we can compute the differences between these files using different contrast methods. For example, we can identify all patterns that are in the first file but not in the second, among multiple other options for identifying contrast patterns:
That is all I wanted to share about this new version! Hope that you will enjoy this new release of the SPMF pattern mining software. So far we have released 18 new algorithms this year! And more features are coming soon…
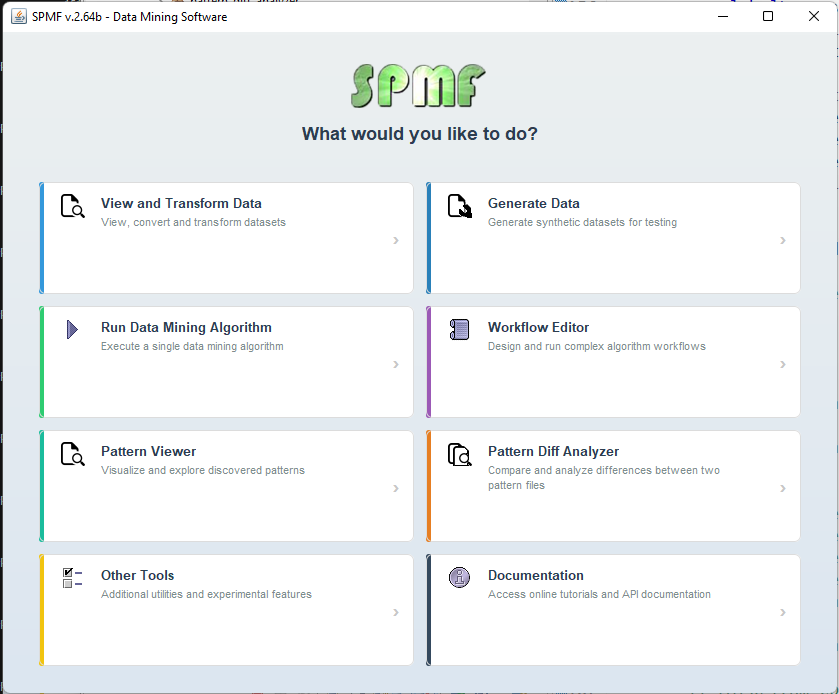
Recently, I have been working on improving the SPMF data mining software. Something good about SPMF is that it has a simple user interface. But as SPMF has evolved with more and more algorithms, the list of algorithms in the software has become very long and it may be not so easy to browse through the list of algorithms. Thus, I have started to think about upgrading the user interface to make it more user-friendly. Here is some new prototype welcome window for SPMF that I am working on:
This window provides access to all the main features of SPMF through a centralized screen. Thus, the user can clearly focus on the different tasks such as generating data, or choosing a data mining or pattern mining algorithm, or viewing and transforming data. When the user will click on “View and transform data” for example, he will access only the algorithms and tools for viewing and transforming data.
I think that this type of interface can be an improvement over the existing user interface. However, for now, this is only a prototype and I am working on putting this all up together, and testing. I will not release a new interface for SPMF until I am sure that everything works well and that it is good. And I might also leave the option of choosing between the traditional user interface and the new user interface. If you have any ideas or suggestions to make this better, please leave me a comment below or email me! I think that if work on this user interface go well, maybe it could be released early next year. Again, thanks for all users of the SPMF pattern mining library for your support!
Today, I will talk to you about an upcoming feature of SPMF pattern mining software 2.64b, which I think will be very useful to many people. It is a new tool, called the Pattern Diff Analyzer that allows to calculate the contrast between two files containing patterns.
For example, lets say that you extract sequential patterns from two text documents. You can now use this tool to find variations in the patterns found in both document to discover patterns that distinguish each document. Another example is you extract patterns from the genome sequences of two viruses and want to find patterns that differ in the two sequences.
The new Pattern Diff Analyzer tool is very simple to use and looks like this:
In this screen, we can select two files containing patterns found by a pattern mining algorithm. For example, I will use two files called patternsA.txt and patternsB.txt.
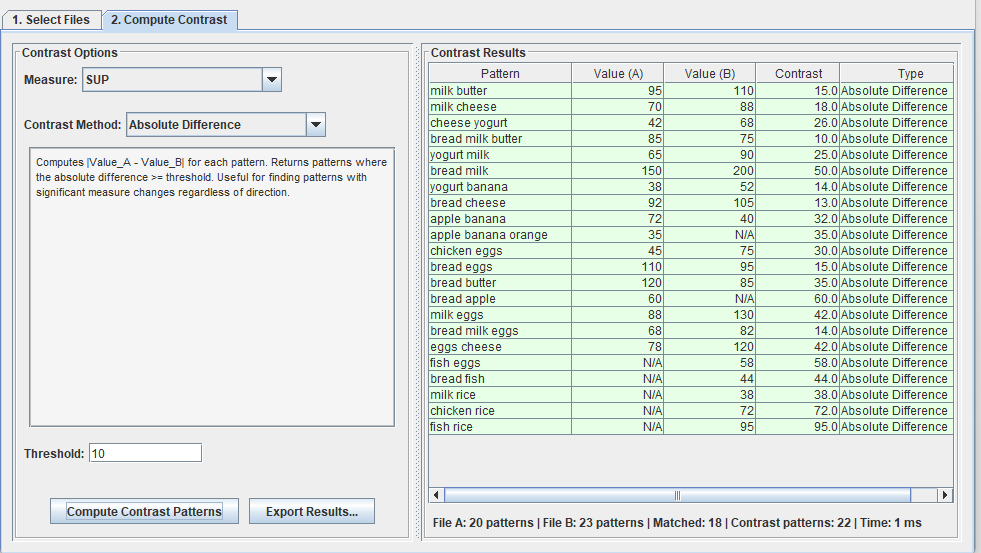
After that, we can go to the second tab called “Compute contrast” to find the differences in patterns between these two files. In the picture below, I choose the “SUP” measure (support) for calculating the difference, and I choose “Absolute difference” with the threshold of 10. This means that I want to find all the patterns where the difference in support is more than 10 between the two files. The result is 20 patterns:
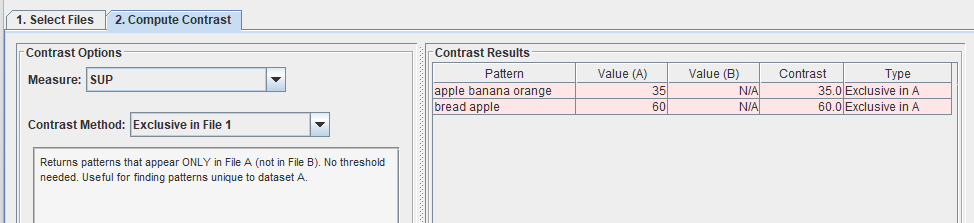
I can also choose other contrast methods such “Exclusive in file 1“, which means all patterns that only appear in the first file but not in the second file:
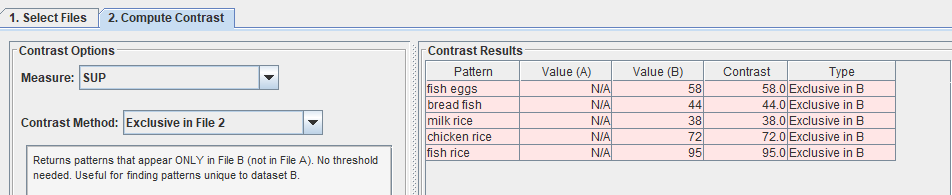
Or similarly, I can choose “Exclusive in file 2“:
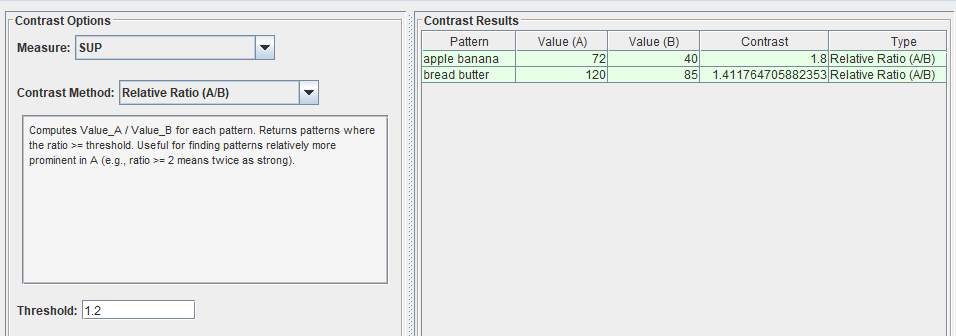
There are also other contrast methods available such as the ratio of a pattern’s measure value for file A to that in file B. For example, here I select patterns where the ratio of A to B is at least 1.2:
After discovering the contrast patterns, we can also Export them to a text file for saving these results!
I think this tool will be very useful for classification problems where we want to compare patterns from different classes. Related to classification, note that in SPMF, we also have multiple algorithms for classification using association rules. But this is a different approach.
So today, I just wanted to show you a preview of this upcoming tool in SPMF. I will continue testing and may made some changes before the final release. Also, I will provide an algorithm that could be called from the command line to do the same thing as this Pattern Diff Analyzer tool so that it can be used without the graphical user interface as well.