
Today, I will give an example of how to draw a figure containing three subgraphs that appear side by side in Latex using the TIKZ library, and where each subgraph has a caption. This can be useful when writing research papers, where we want to discuss different types of subgraphs.
The result will be like this:
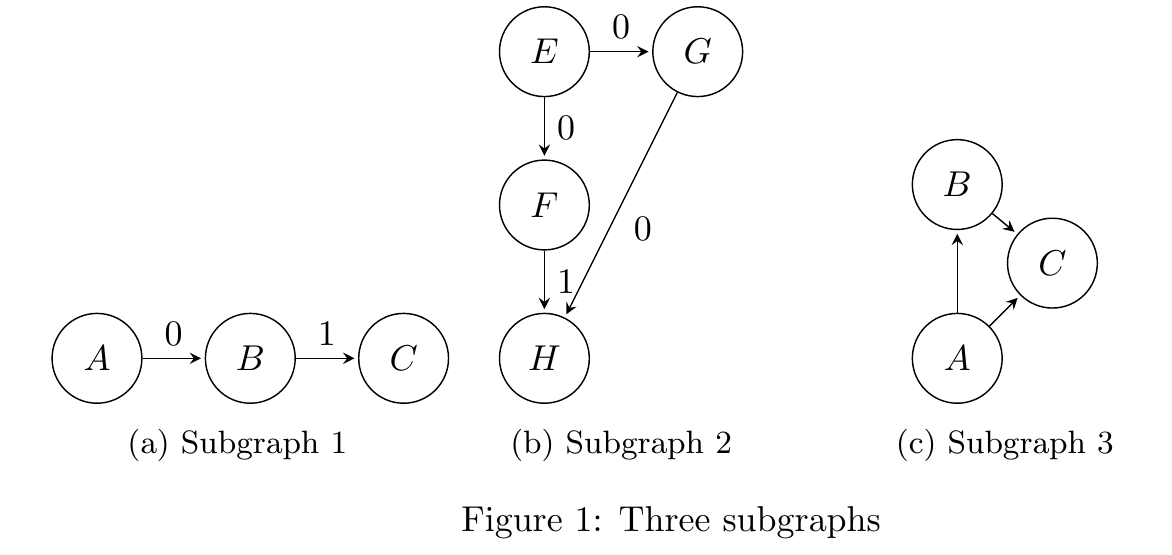
And here is the Latex code:
\documentclass{article}
\usepackage{caption}
\usepackage{subcaption}
\usepackage{tikz}
\usetikzlibrary{automata,arrows,positioning,calc}

\begin{document}


\begin{figure}
  \begin{subfigure}[b]{0.30\textwidth}
    \centering
      \begin{tikzpicture}[> = stealth,  shorten > = 1pt,   auto,   node distance = 1.5cm]
        \node[state] (v) {$A$};
        \node[state] (w) [right of=v] {$B$};
        \node[state] (t) [right of=w] {$C$};

		\path[->] (v)  edge node {0} (w);
		\path[->] (w) edge   node  {1}(t);
      \end{tikzpicture}
    \caption{Subgraph 1}
  \end{subfigure}
  \begin{subfigure}[b]{.30\textwidth}
    \centering
      \begin{tikzpicture}[> = stealth,  shorten > = 1pt,   auto,   node distance = 1.5cm]
        \node[state] (x) {$E$};
        \node[state] (y) [below of=x] {$F$};
        \node[state] (n) [right of=x] {$G$};
        \node[state] (z) [below of=y] {$H$};


		\path[->] (x)  edge node {0} (y);
		\path[->] (x)  edge node {0} (n);
		\path[->] (n)  edge node {0} (z);
		\path[->] (y) edge   node  {1}(z);
      \end{tikzpicture}
    \caption{Subgraph 2}
  \end{subfigure}
  \begin{subfigure}[b]{.30\textwidth}
    \centering
      \begin{tikzpicture}[> = stealth,  shorten > = 1pt,   auto,   node distance = 1.7cm]
        \node[state] (g) {$A$};
        \node[state] (h) [above of=g] {$B$};
        \node[state] (e) [above right= 0.3 cm and 0.3 cm of g] {$C$};
		\path[->] (g)  edge node {} (e);
		\path[->] (g)  edge node {} (h);
		\path[->] (h) edge   node  {}(e);
      \end{tikzpicture}
    \caption{Subgraph 3}
  \end{subfigure}
\caption{Three subgraphs}
\end{figure}
In this code, I use the automata package of TIKZ, which is great for drawing graphs. You could also use other packages and tweak the above example.
Hope this is useful.
—
Philippe Fournier-Viger is a distinguished professor working in China and founder of the SPMF open source data mining software.


The idea of drawing subgraphs side by side in Latex using the TIKZ library is really useful when you want to discuss different types of subgraphs. I was particularly interested in the example given, where each subgraph has a caption. As someone who spends a lot of time analyzing data on reef conditions, I can see how this would be helpful in comparing the health of different reefs. One practical tip I might add is to consider using a consistent scale for each subgraph, so that comparisons between them are more straightforward.