
In this blog post, I introduce a new interactive tool for showing a demonstration of the K-Means algorithm for students (for teaching purposes).
The K-Means clustering demo tool can be accessed here:
philippe-fournier-viger.com/tools/kmeans_demo.php
The K-Means demo, first let you enter a list of 2 dimensional data points in the range of [0,10] or to generate 100 random data points:
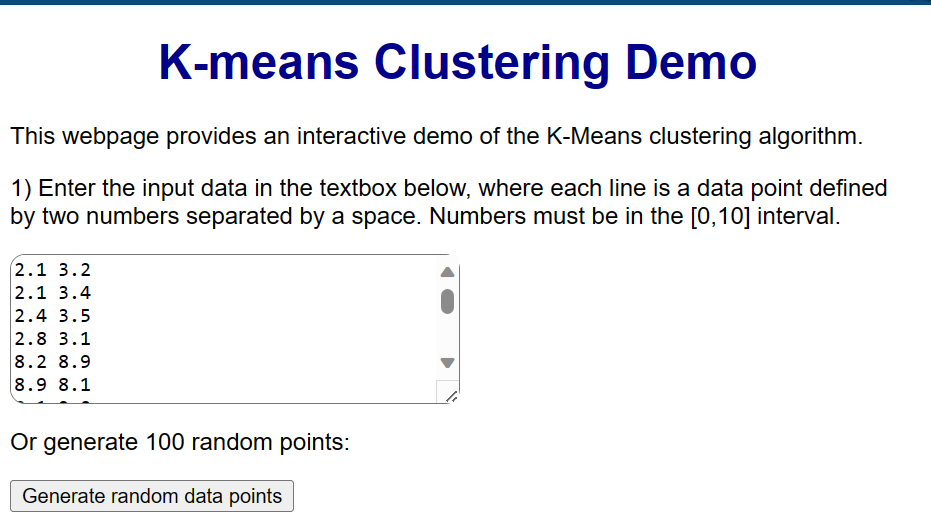
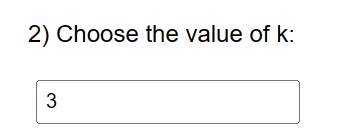
Then the user can choose the value of K, adjusts other settings, and run the K-Means algorithm.
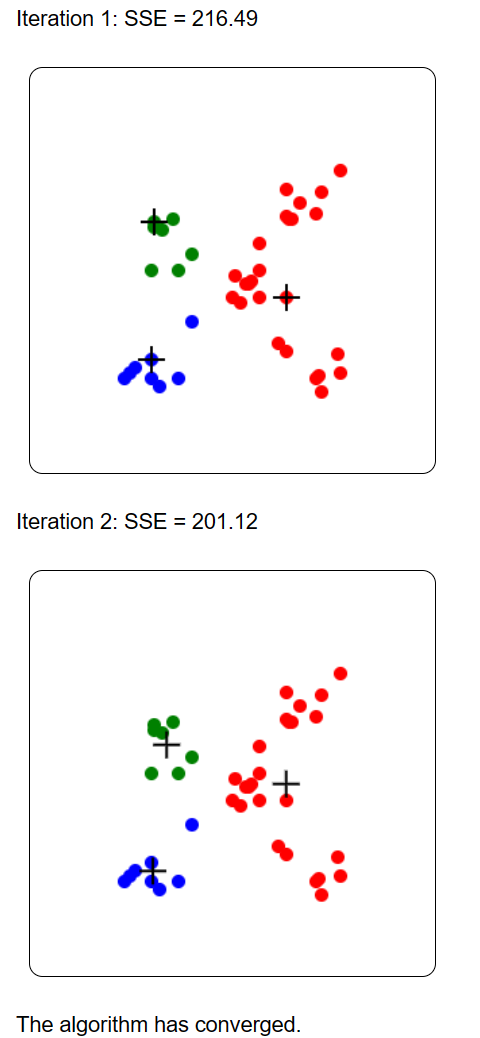
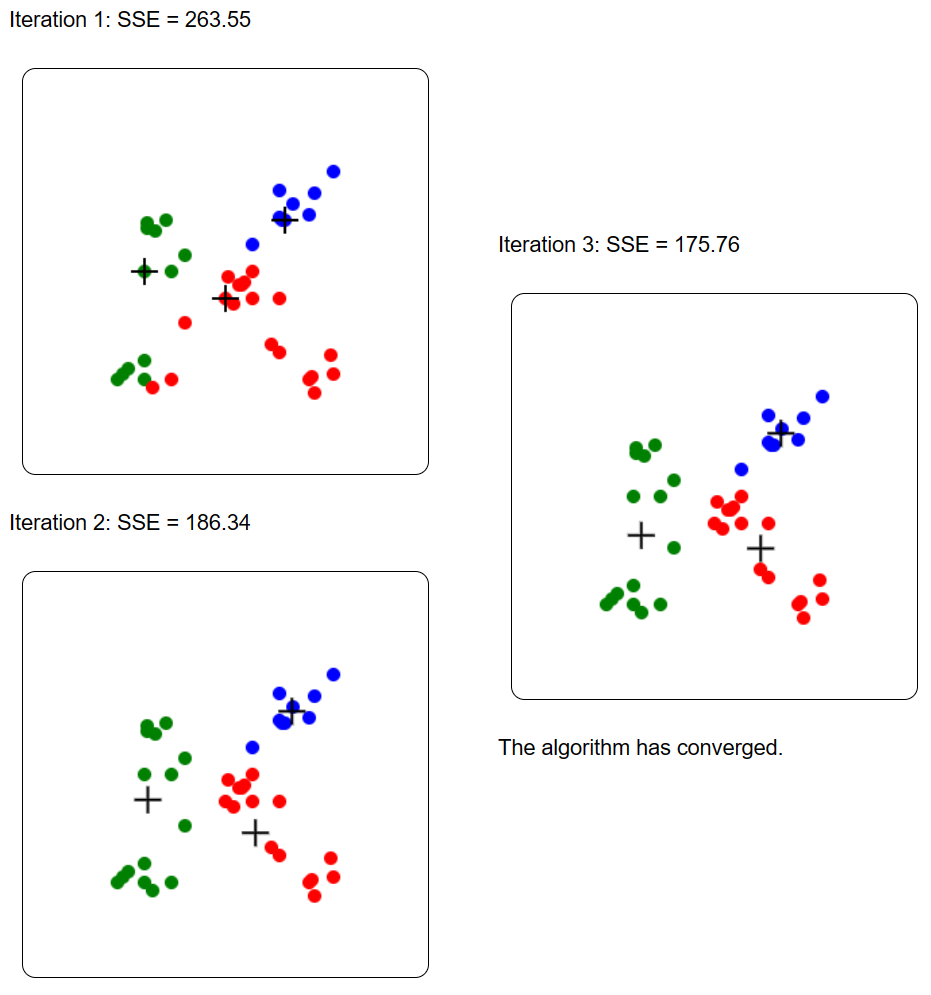
The result is then displayed for each iteration, step by step. Each cluster is represented by a different color. The SSE (Sum of Squared Error) is displayed, and the centroids of clusters are illustrated by the + symbol. For example, this is the result on the provided example dataset:
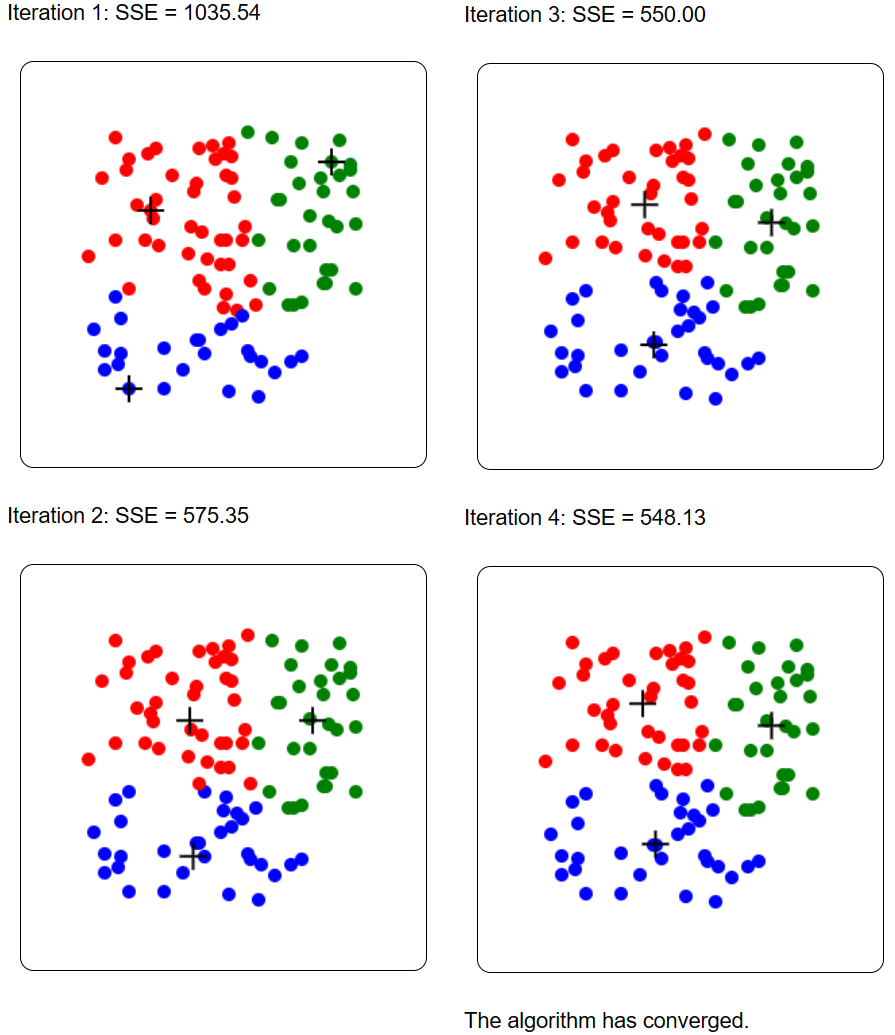
Because K-Means is a randomized algorithm, if we run it again the result may be different:
Now, let me show you the feature of generating random points. If I click the button for generating a random dataset and run K-Means, the result may look like this:
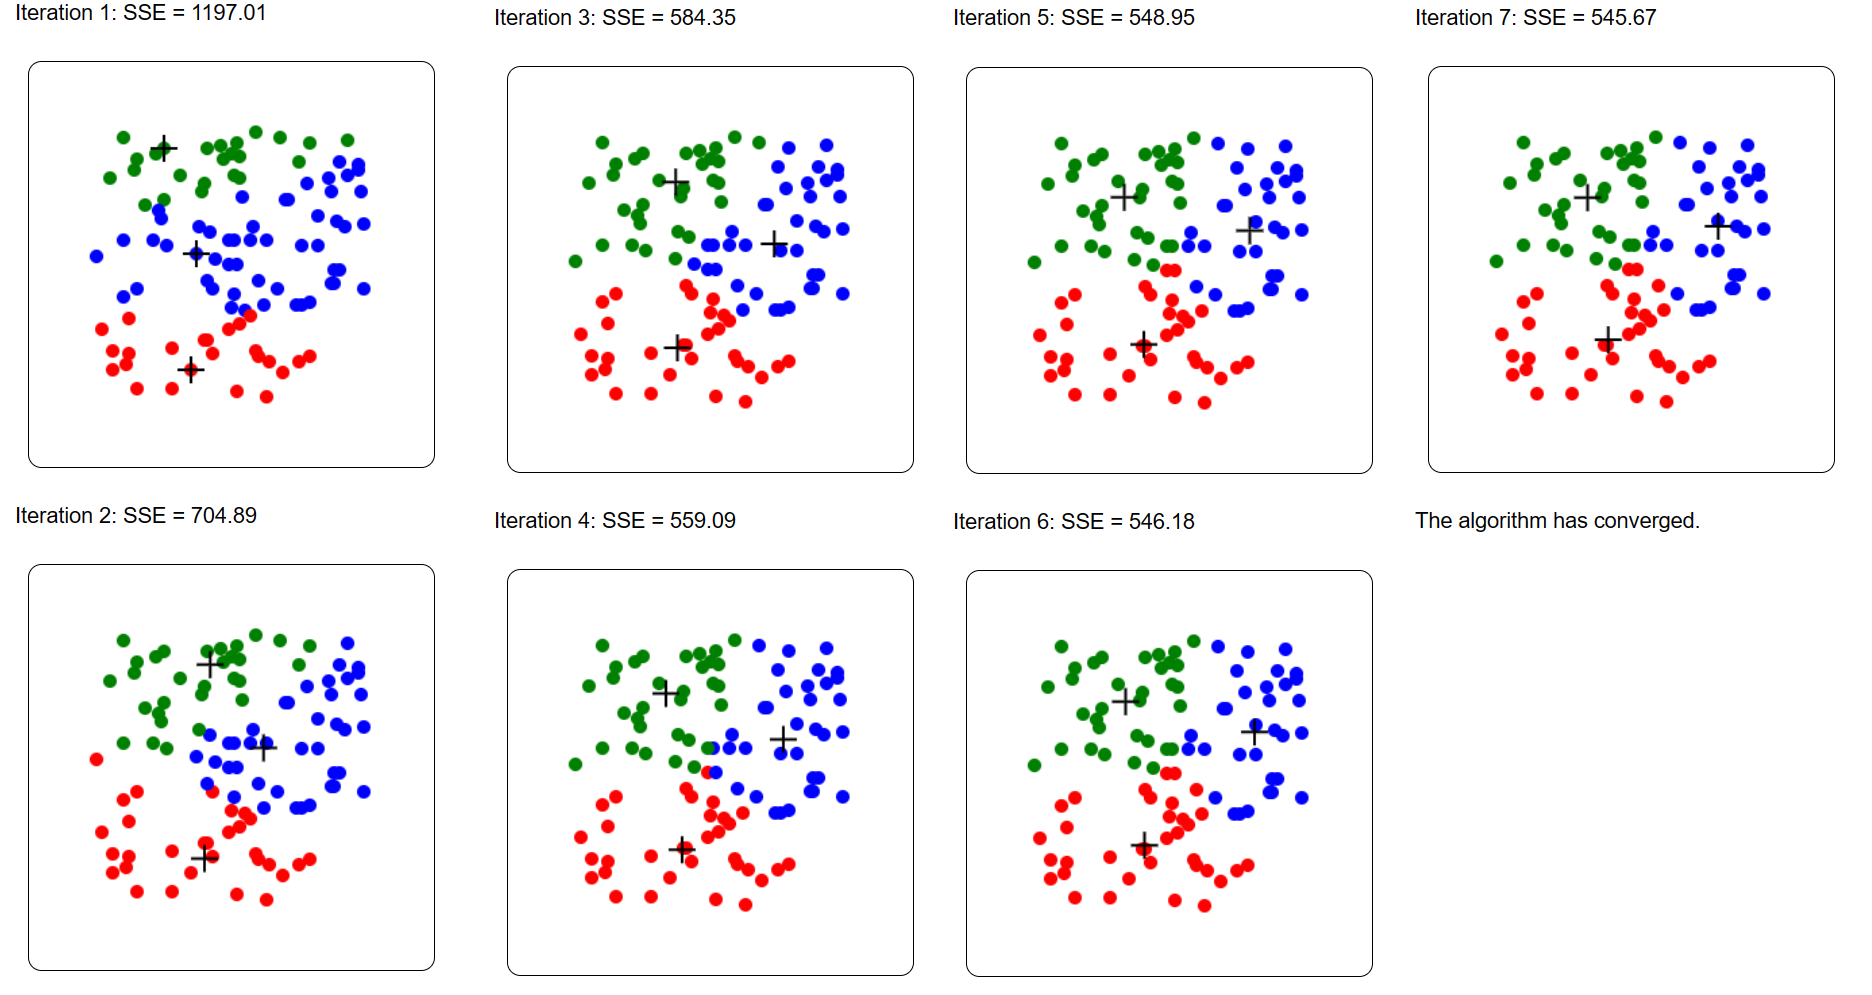
And again, because K-Means is randomized, I may execute it again on the same random dataset and get a different result:
I think that this simple tool can be useful for illustrating how the K-Means algorithm works to students. You may try it. It is simple to use and allows to visualize the result and clustering process. Hope that it will be useful!
—
Philippe Fournier-Viger is a distinguished professor working in China and founder of the SPMF open source data mining software.


