
Today, I want to talk to you about other new features in SPMF. 2.66, which will be released in the next few days. I have also improved the Visual Pattern Viewer. Now it can be also used to visualized subgraphs:
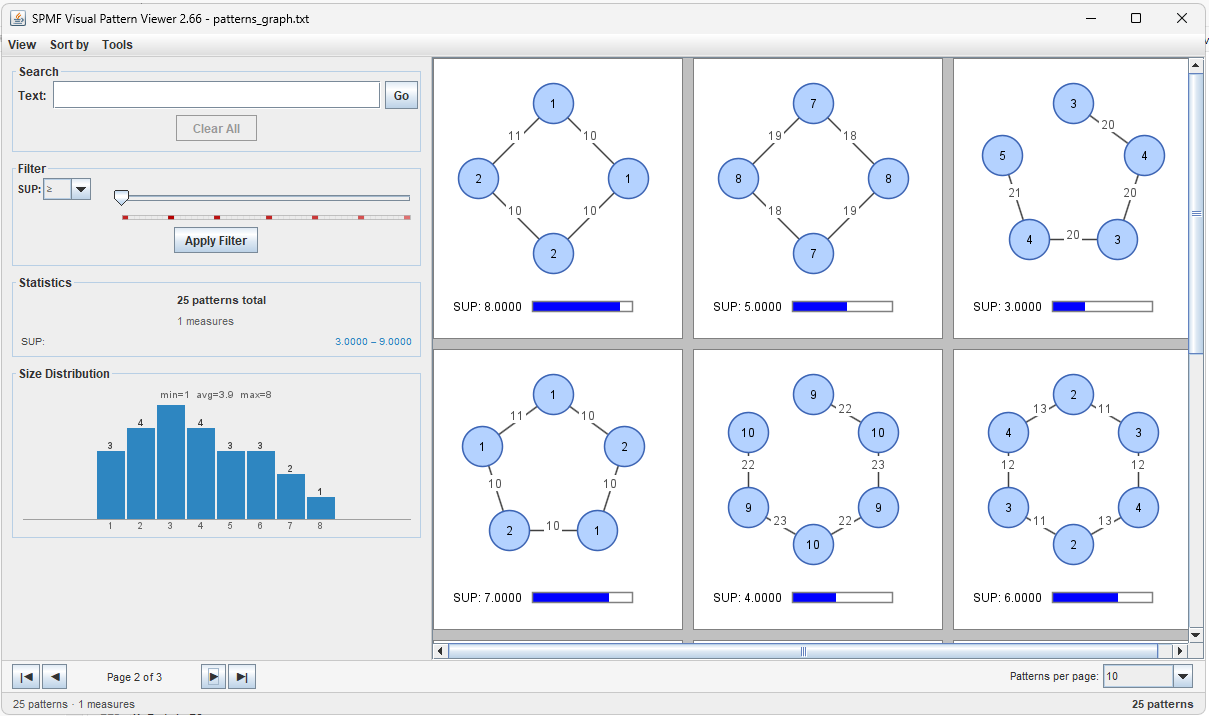
Visualizing subgraphs was previously done with the SPMF GraphViewer. But integrating this feature in the Visual Pattern Viewer is more appropriate as the Visual Pattern Viewer provides several more advanced fonctionnalities such as showing subgraphs as pages, providing statistics, and the filter and search functions!
Also, you may see another new function in the Visual Pattern Viewer if you look closely. For each measure, the slider now displays the distribution of values for patterns:
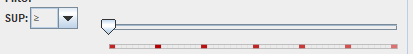
In that picture, you can see that red blocks indicate that some patterns have the corresponding support value and this gives hints about how to set the filter based on these support values. Here is another example for association rules:
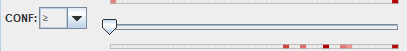
The colored bar under the slider for the confidence measure indicates that most rules have a confidence closer to 1 (the maximum) than 0 (the minimum). And more precisely, from this picture, it appears that all rules have a confidence greater than 0.5.
Hope that this is interesting. It is just to give you a preview of upcoming features in SPMF!


