
Today, I am happy to announce a cool new feature in SPMF 2.54, which is a tool to automatically run performance experiments to compare several algorithms when a parameter is varied. This is a useful feature to compare algorithms when writing a research paper. The new tool to do performance experiments let you choose oneor more algorithms, indicate default parameter values and that a parameter must be varied. A time-out can be specified to avoid running algorithms for too long. Besides, each algorithm execution is done in a separate Java virtual machine to ensure that the comparison is always fair (e.g. memory will not accumulate from previous algorithm executions). When running the tool, the results can also be easily exported to Excel and Latex to generate charts for research papers. This tool can save a lot of time for performing experimental comparisons of algorithms!
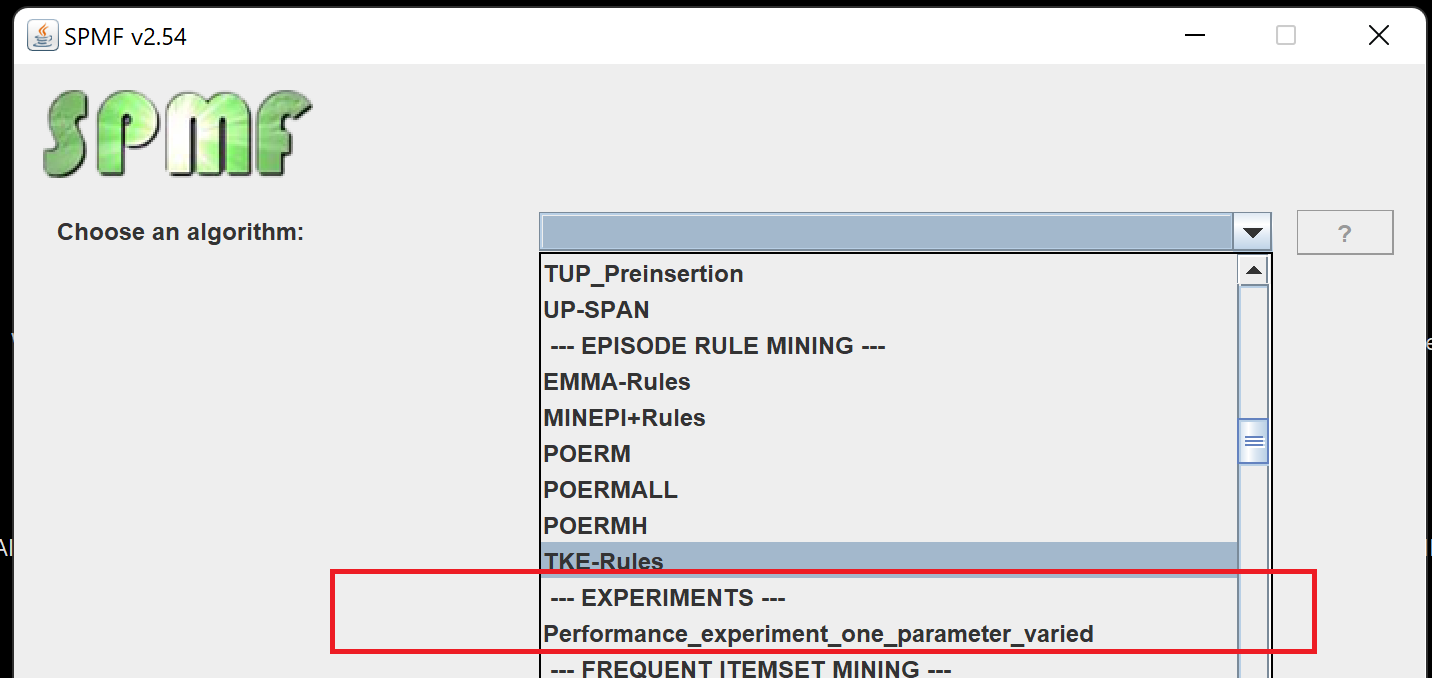
Briefly the main way to use the new tool is to run the graphical user interface of SPMF and then select the tool from the list of algorithms:
This will open-up a new window, where we can configure the parameters for running the experiment:
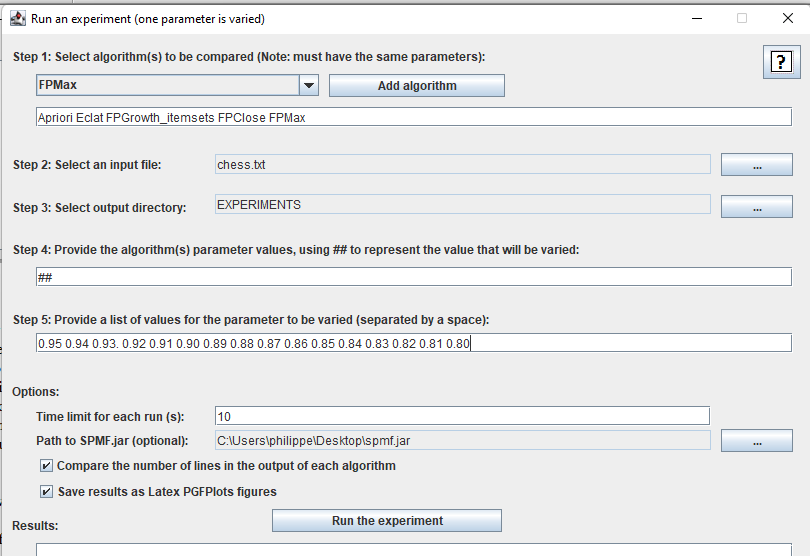
For example, without going into details, here we choose five algorithms called Apriori, Eclat, FPGrowth_itemsets, FPClose and FPMax. We also select an input file called Chess.text on which we will run the algorithms and we select a directory called EXPERIMENTS to save all the results that will be generated to files. We also say that the algorithms have one parameter which will be varied (We indicate that a parameter is varied using a special code ##), and the parameter will be varied from 0.95 to 0.80. We say that the time limit for each execution will be 10 seconds, and we select the option that we want not only to compare time and memory usage but also the number of patterns (lines in the output) and save all results as Latex figures, as well.
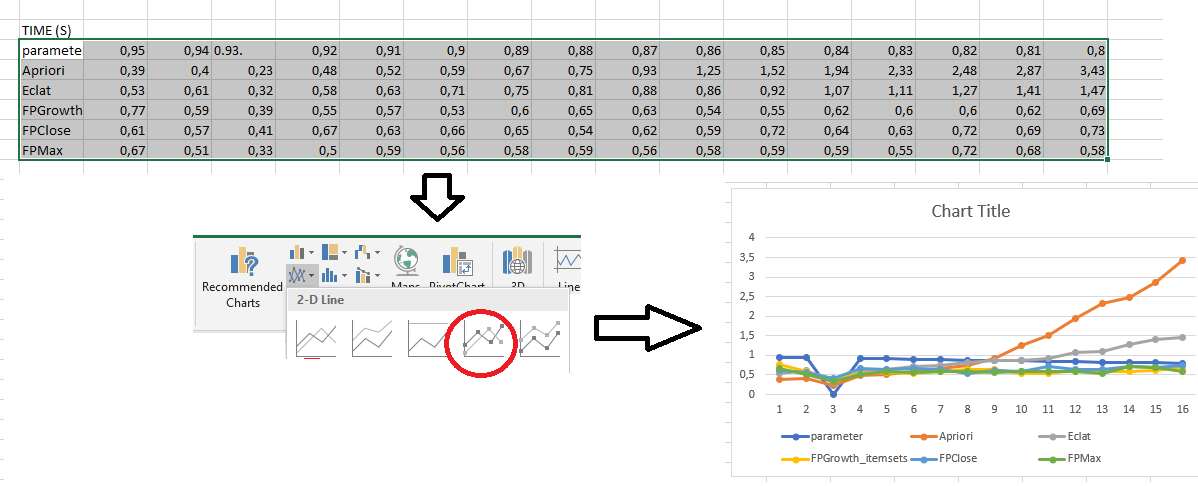
Then we click “Run the experiments” to run the experiments. We will get summarized results as shown below for execution time, memory and number of patterns:
TIME (S)
parameter 0,95 0,94 0.93. 0,92 0,91 0,9 0,89 0,88 0,87 0,86 0,85 0,84 0,83 0,82 0,81 0,8
Apriori 0,39 0,4 0,23 0,48 0,52 0,59 0,67 0,75 0,93 1,25 1,52 1,94 2,33 2,48 2,87 3,43
Eclat 0,53 0,61 0,32 0,58 0,63 0,71 0,75 0,81 0,88 0,86 0,92 1,07 1,11 1,27 1,41 1,47
FPGrowth_itemsets 0,77 0,59 0,39 0,55 0,57 0,53 0,6 0,65 0,63 0,54 0,55 0,62 0,6 0,6 0,62 0,69
FPClose 0,61 0,57 0,41 0,67 0,63 0,66 0,65 0,54 0,62 0,59 0,72 0,64 0,63 0,72 0,69 0,73
FPMax 0,67 0,51 0,33 0,5 0,59 0,56 0,58 0,59 0,56 0,58 0,59 0,59 0,55 0,72 0,68 0,58

MEMORY (MB)
parameter 0,95 0,94 0.93. 0,92 0,91 0,9 0,89 0,88 0,87 0,86 0,85 0,84 0,83 0,82 0,81 0,8
Apriori 18,88 18,88 18,88 18,88 18,88 19,32 19,76 19,76 19,76 20 20,44 21,32 21,32 22 3,34 3,36
Eclat 19,92 27,93 27,93 26,76 11,96 38,9 72,43 110,26 154,03 94,25 141,23 91,27 176,8 71,23 15,29 172,98
FPGrowth_itemsets 6,75 7,43 7,43 7,43 7,44 7,44 8,11 8,1 8,78 9,44 10,1 10,77 11,44 12,78 14,12 15,45
FPClose 6,76 7,43 7,43 7,43 7,43 7,43 8,1 8,77 8,76 9,43 10,1 11,43 12,11 12,1 13,45 15,45
FPMax 6,76 7,44 7,44 7,42 7,43 7,43 7,44 7,43 8,1 8,1 8,77 9,44 9,43 9,44 10,11 10,78

OUTPUT_SIZE (LINES)
parameter 0,95 0,94 0.93. 0,92 0,91 0,9 0,89 0,88 0,87 0,86 0,85 0,84 0,83 0,82 0,81 0,8
Apriori 77 139 -1 305 421 622 883 1195 1553 1987 2669 3484 4243 5312 6656 8227
Eclat 77 139 -1 305 421 622 883 1195 1553 1987 2669 3484 4243 5312 6656 8227
FPGrowth_itemsets 77 139 -1 305 421 622 883 1195 1553 1987 2669 3484 4243 5312 6656 8227
FPClose 73 124 -1 269 362 498 689 922 1183 1457 1885 2400 2883 3487 4216 5083
FPMax 11 18 -1 26 30 34 51 75 69 89 119 145 133 163 221 226
This was generated in just a few seconds. If we would have run these experiments by hand, it would have took us a lot more time. Now, after we have these results, since they are tab-separated we can directly import them into Excel to generate charts:
Besides, since we selected the option to generate PGFPlots figures for Latex, SPMF will have generated latex documents as output, that we can directly compile to use in Latex documents:
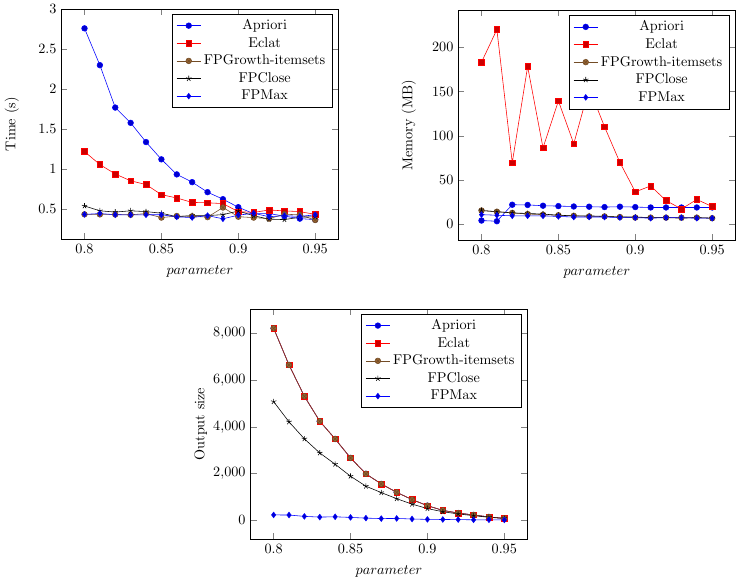
As you can see these figures are quite beautiful.
This is just a brief overview of this new feature to do performance experiments. There are more explanations about how it works in the documentation of SPMF, here:
Example: Run Experiments To Compare The Performance of One or More Algorithms on a Dataset (One Parameter Is Varied) (SPMF – Java)
I will continue improving this tool to generate experiments in the next few weeks. In particular, I am now working on an option to generate scalability experiments as well, which should be released soon. Also, I will modify the tool to make it easier to compare algorithms from SPMF with algorithms that are not in SPMF.
—
Philippe Fournier-Viger is a distinguished professor working in China and founder of the SPMF open source data mining software.


