This blog post provides a brief report about the IEEE ICDM2021 conference (International Conference on Data Mining), which was held virtually from New Zealand from the 7th December to the 10th December 2021.
What is ICDM?
ICDM is one of the very top data mining conferences. ICDM 2021 is the 21st edition of the conference. The focus of this conference is on data mining and machine learning. I have attended ICDM a few times. For example, you can read my report about ICDM 2020.
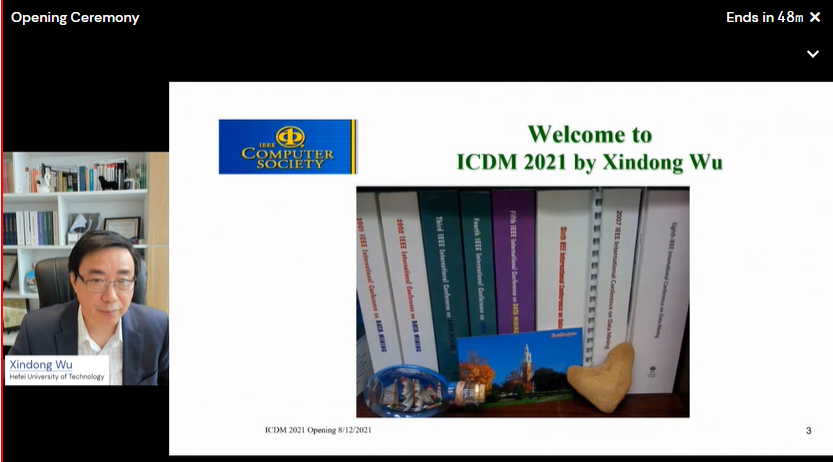
Opening ceremony
The opening ceremony started by a performance from local people. Then, there was some greetings from the general chair Prof. Yun Sing Koh.

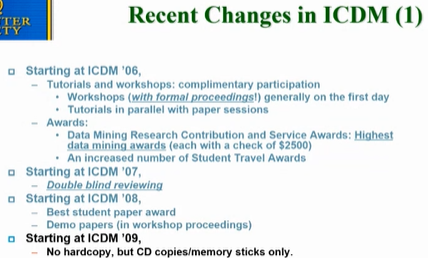
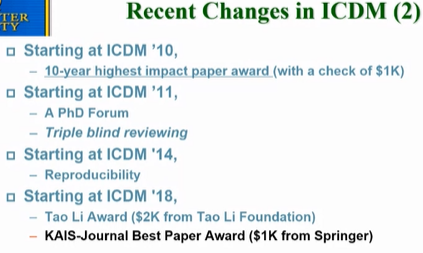
Then Prof. Xingdong Wu, the founder of the conference, talked about ICDM. Here are a few slides from this presentation:

It was said that this year, that there is over 500 participants.
This is the acceptance rate of ICDM over the years:
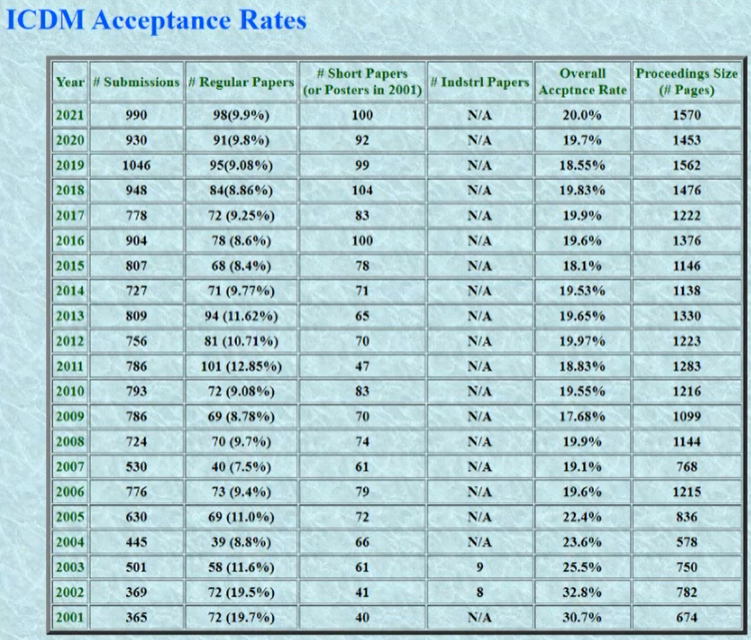
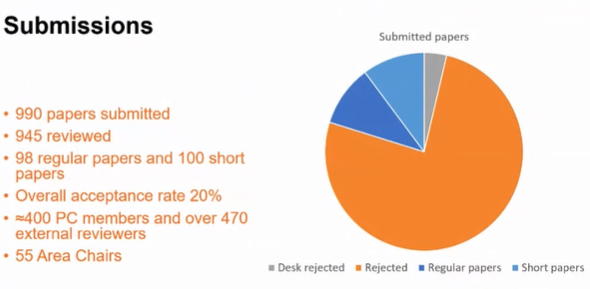
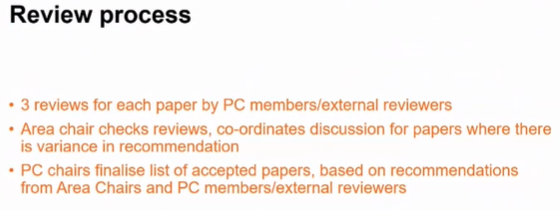
The program co-chairs then gave some more details about the ICDM 2021 review process. In particular, this year, there was 990 submission, and 98 were accepted as regular papers (9.9% acceptance rate), and 100 as short papers, for a global acceptance rate of 20%. All papers have been reviewed in a triple-blind way.
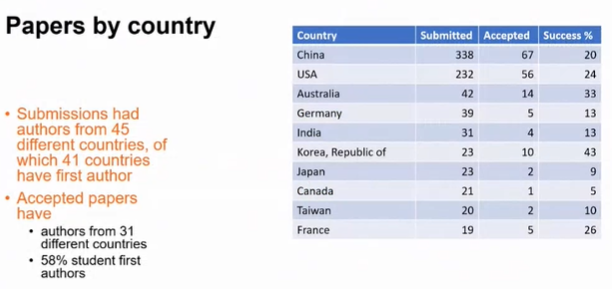
In terms of papers by country, the largest number of accepted papers came from China, and then from the USA.
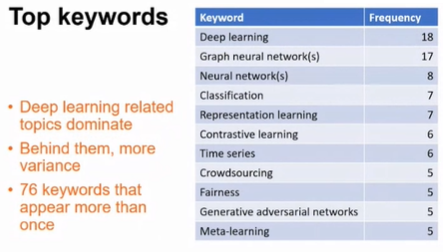
The most popular topics were about deep learning, neural networks and classification.
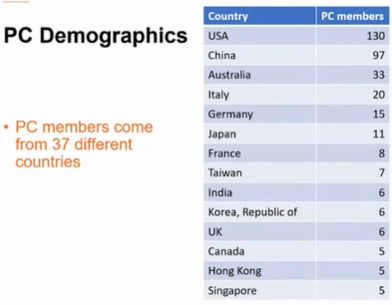
Most of the program committee members are from USA and China
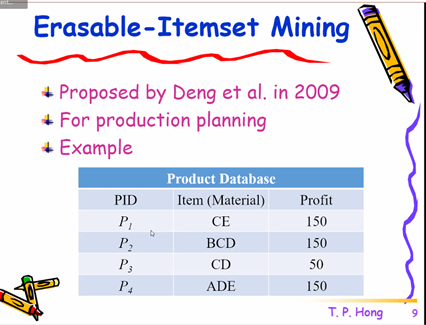
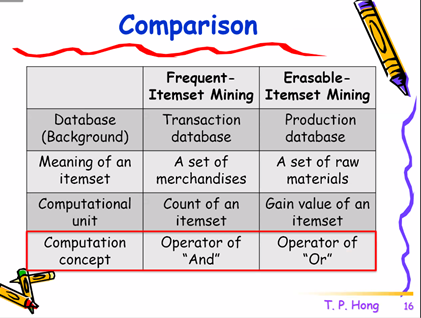
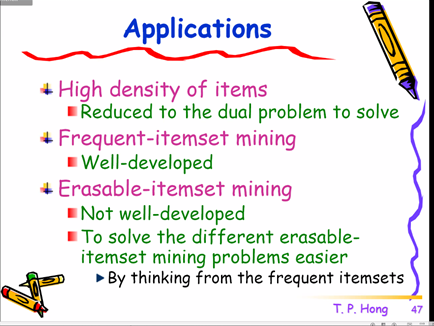
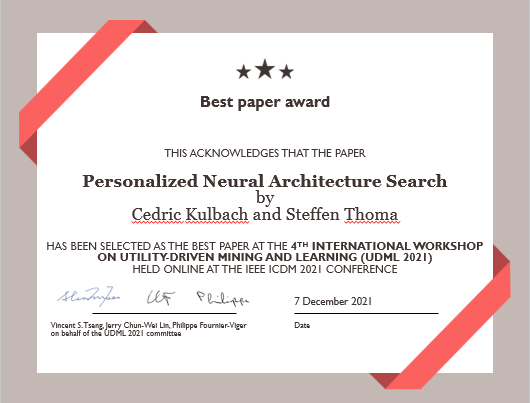
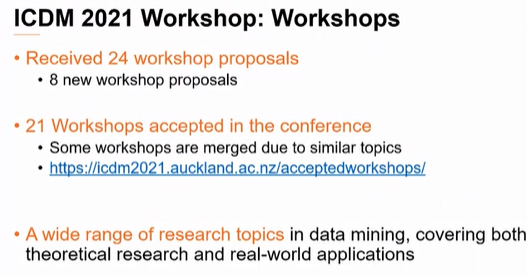
The workshop chairs then talked about the workshops. This year, there was 18 workshops on various topics. On overall, the acceptance rate for workshop papers was about 50%. All the workshop papers are published in formal proceedings by IEEE and indexed by EI and stored in the IEEE Digital Library. In particular, this year, I have co-organized the UDML 2021 workshop on utility-driven mining and learning. Here are more details about the workshops:
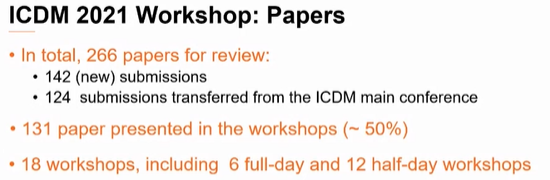
Each workshop had from 4 to 12 accepted papers.
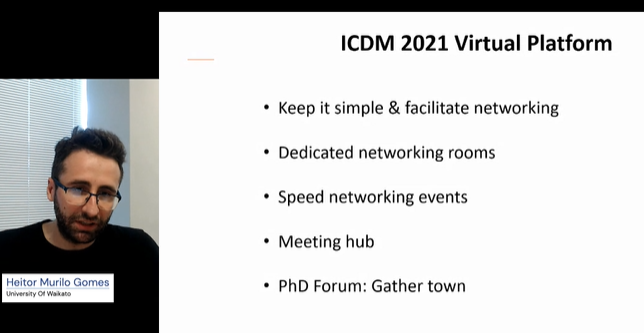
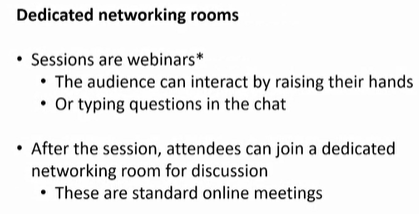
Then, the virtual platform chair Heitor Murilo Gomes introduced the virtual platform used by ICDM2021.
Keynote talks
There was several keynote talks.
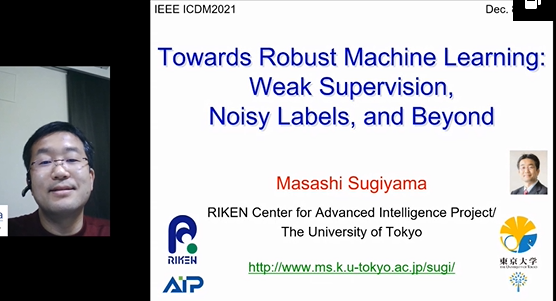
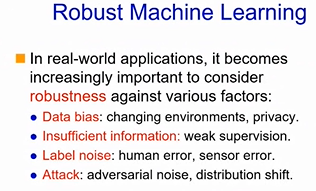
The first keynote talk was by Prof. Masashi Sugiyama from Japan about robust machine learning against various factors (weak supervision, noisy labels and beyond). Here are a few slides:
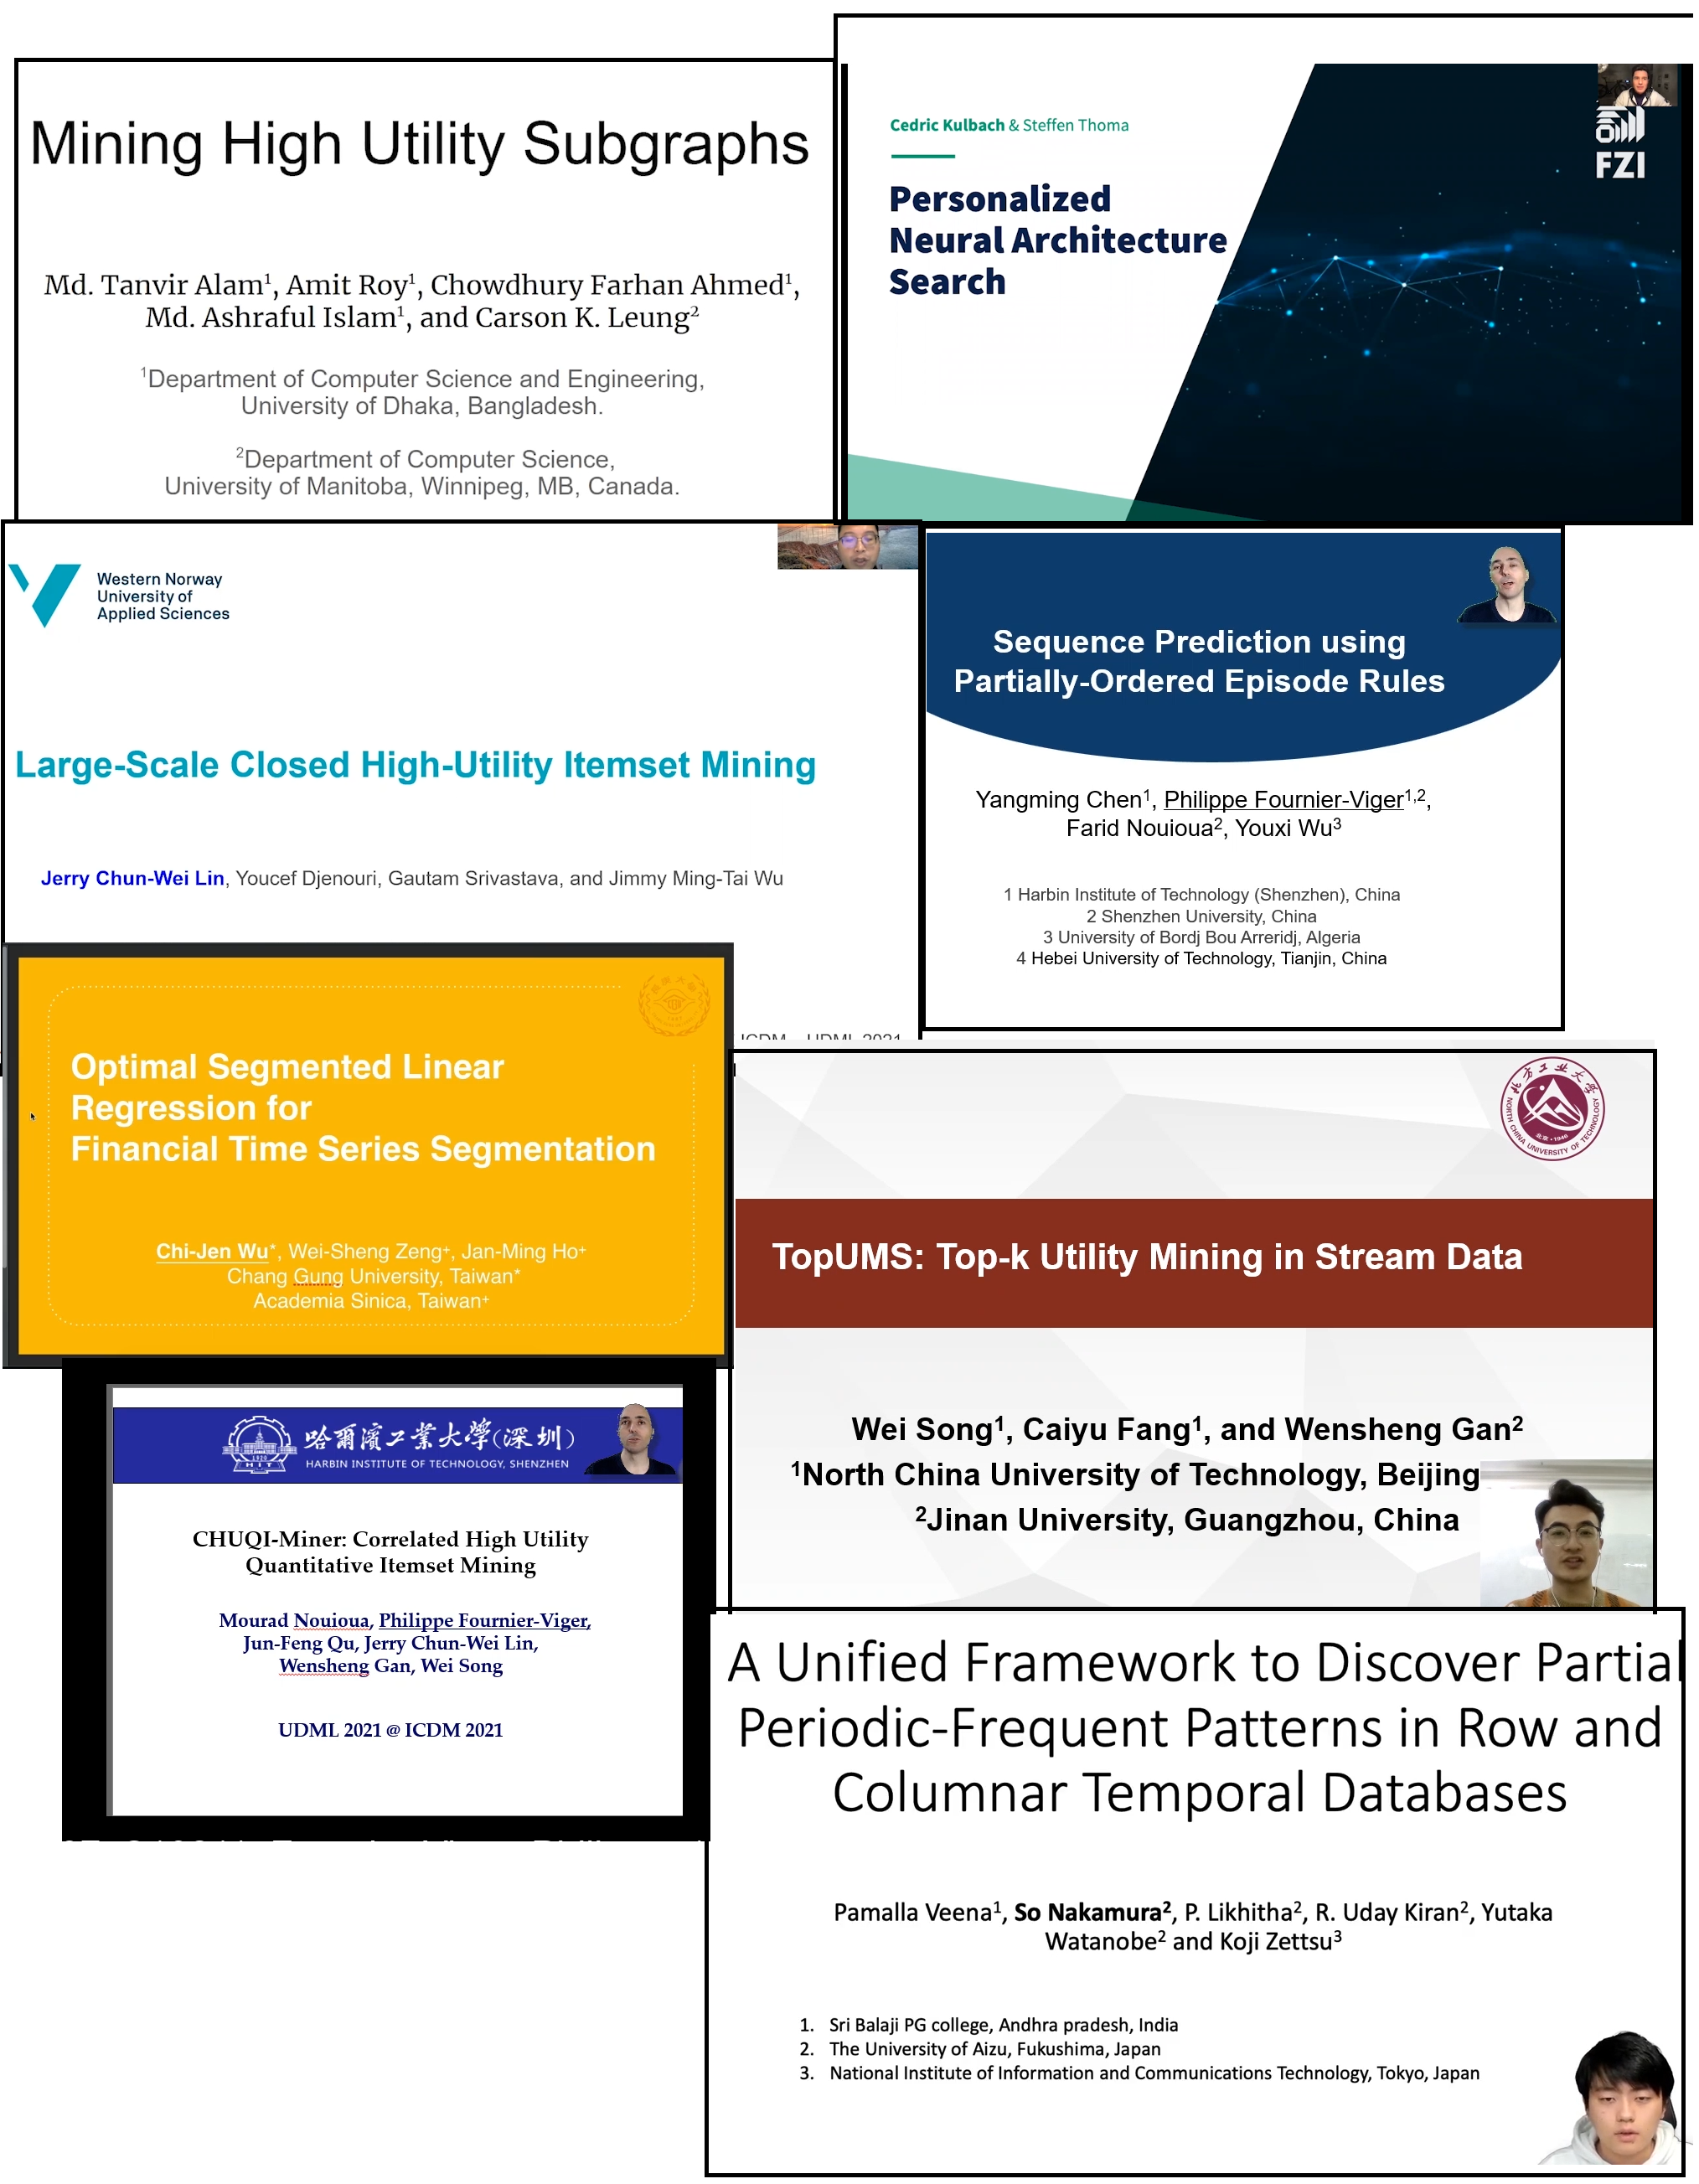
Paper presentation
There was many paper presentations. I will not report in details about them.
Conclusions
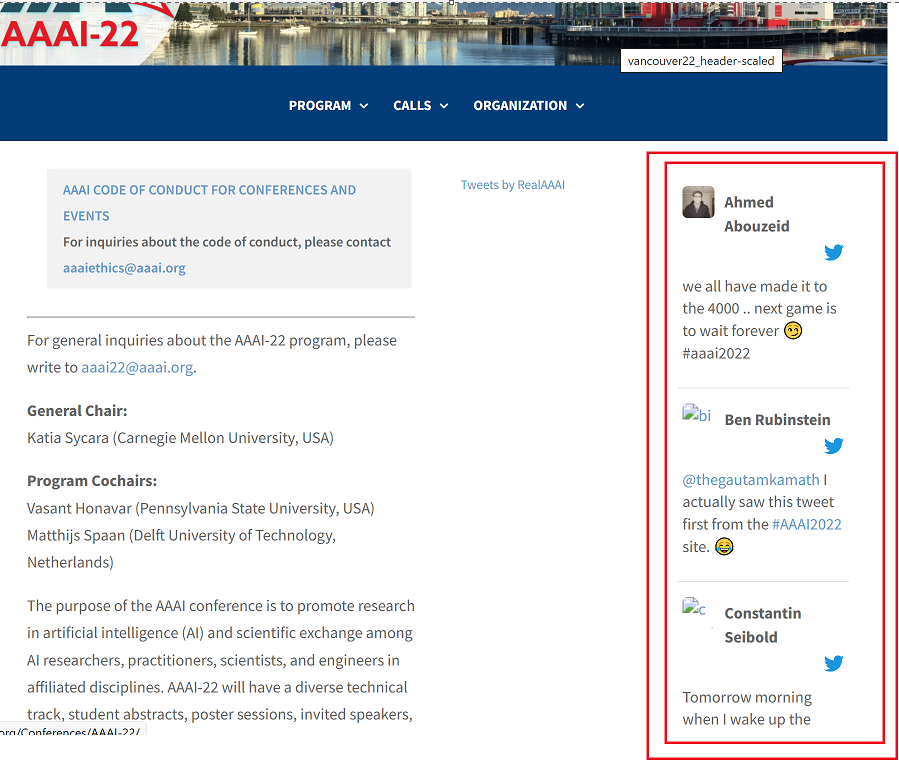
The ICDM 2021 conference was interesting. It is a leading conference in data mining. Looking forward to attending it again next year for ICDM 2022 in Orlando, Florida.
—
Philippe Fournier-Viger is a full professor working in China and founder of the SPMF open source data mining software.