
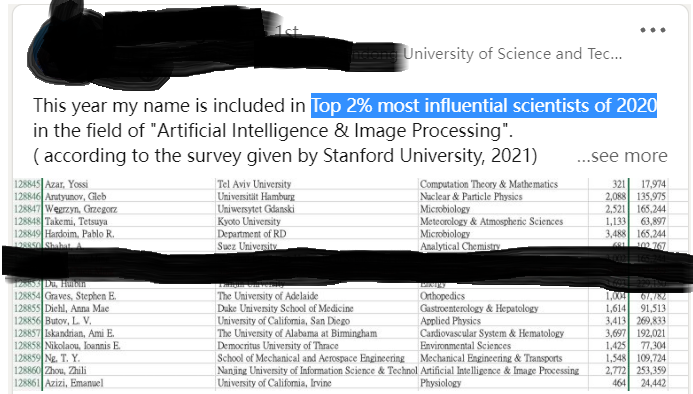
In recent days, I see many posts on Linkedin about researchers that mention that they are in the list of the top 2% most influential scientists of 2020 according to Stanford. Here is an example:
I understand why people post about this. The reason is that they are happy to be in the ranking and to see that their research is impactful.
To see more about how this ranking works, I downloaded the data from : https://elsevier.digitalcommonsdata.com/datasets/btchxktzyw/3
I see that my name is also in that ranking, somewhere around rank #48,000. But this is not very important for me. Let’s talk instead about the data.
The data is provided as Excel files and there is also some Python code that was used to generate the ranking.
In the Excel files, it is interesting to see that each author is described by numerous metrics such as the number of citations as first author, the number of citation as corresponding author, the number of self-citations, the percentage of self-citations, etc.
Of course, all these metrics are not perfect. For example, in some fields it is easier to be cited than in some other fields and some researchers will try to manipulate these metrics for example by asking other researchers to cite their papers rather than deserving the citations. Thus, a higher rank does not necessarily mean that someone is a better researcher in real-life. But nonetheless, it is still interesting to look at this data.
By looking at the data for year 2020, I make a few observations that I find interesting.
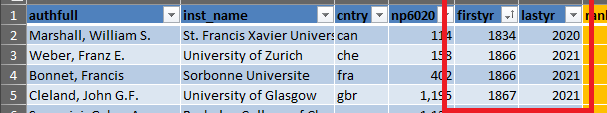
- After sorting the authors by the year of their first paper, I find that some authors have published papers for more than 180 years. For example, below, Marshall, William S. had his first paper in 1834 and his last paper in 2020. I guess that it must be some error in the data and that two persons must have the same name.
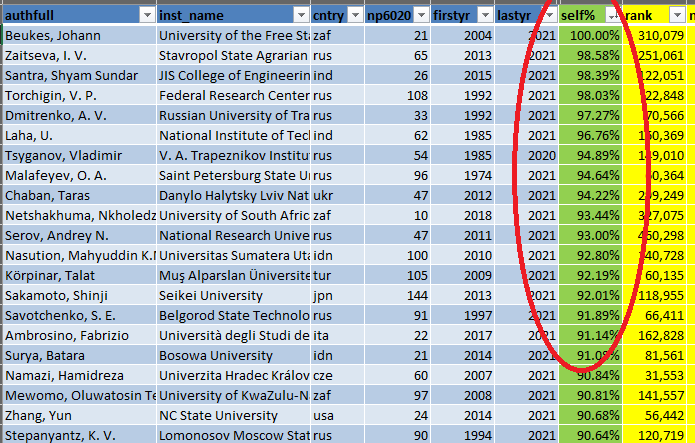
2. The attribute that I perhaps find the most interesting is “self %” which indicates the percentage of self-citations. If I sort from largest to smallest, I can see that some persons have from 90% to 100% self-citations in year 2020, which appears to be very high. Some of these persons also have a quite high “rank”. There can be some reasons for these high percentages… It perhaps that these authors work in some smaller research communities or on very specialized research topics.
If I look more closely at the data (year 2020), I find that:
– about 0.6% of the researchers have more than 50% self-citations,
– about 4.2% have more than 30% citations
– about 13.7% have more than 20% self-citations
– about 48% have more than 10% self-citations
If I look at the top 30 persons in the ranking, the self-citations percentage is all below 15% and sometimes even below 1 %:
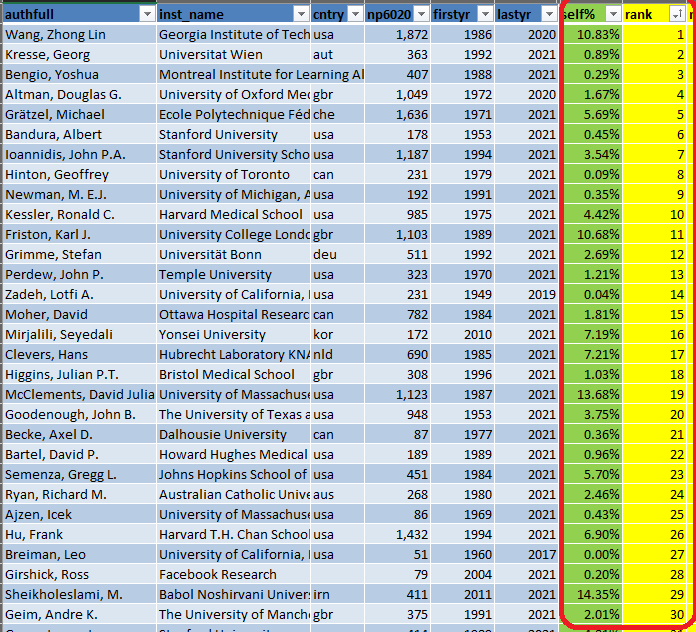
For me this makes sense. I think a young researcher will typically have more self-citations while a very famous researcher should have less self-citations and more from other people.
That is the most interesting thing that I have found so far in this data.
I did not do a very deep analysis of this data, as I am quite busy. But I just wanted to share a few observations. It would be interested to go beyond that and look for example at the data by countries or to draw some charts to see the distribution of values for different attributes, and to measure the correlation between attributes.. If you find something interesting in this data, you may share it in the comment section below!
—
Philippe Fournier-Viger is a distinguished professor working in China and founder of the SPMF open source data mining software.


