The importance of using standard terminology in research papers

Today, I will talk about the importance of using standard terminology in research papers in computer science. The idea to talk about this on the blog came after reading an interesting letter about research on optimization called “Metaphor‑based metaheuristics, a call for action: the elephant in the room” by Aranha et al. (DOI: 10.1007/s11721-021-00202-9).

This paper explains that in the field of optimization, there have been a growing list of articles in the last decade proposing seemingly new approach for optimization but explained using a wide range of metaphors some related to animals (e.g. bats, grey wolves, termites, spiders), natural phenomena (e.g. invasive weed, the big bang, river erosion), and many other weird sources of inspirations (e.g. how musicians play music together, how interior design is carried and the political behavior of countries).

A key issue pointed by the authors and other researchers is that many metaphor-based optimization algorithms introduce new terminology that are unnecessary to explain the new algorithms, as they could be explained more simply using the existing terminology. For example, it was shown by Camacho-Villalon (DOI: 10.1007/s11721-019-00165-y) that some optimization algorithms such as Intelligent Water Drop (IWD) optimization are nothing but a special case of Ant Colony Optimization (ACO). However, the terminology is changed and pheromone in ACO is now called the soil in IWD, and ants are water drops, and so on. Another example is black hole optimization, which was shown to be a special case of particle swarm optimization.

The main problem with authors proposing seemingly new algorithms using non standard terminology is as Aranha explains: ” (i) creating confusion in the literature, (ii) hindering our understanding of the existing metaphor-based metaheuristics, and (iii) making extremely difficult to compare metaheuristics both theoretically and experimentally.”

This problem has become quite big in optimization research with several papers proposing new metaphors that are unrealistic or unnecessary to explain small modifications to existing algorithms, so as to publish more papers with little innovation. However, this problem also appears in other fields of computer science where researchers use non standard terminology in their papers. As a result, it often become difficult to verify where an idea truly came from, some work may be duplicated, and finding other papers related to an idea can become quite difficult (if several papers use different terminology.

This is why, it is important to always use standard terminology when proposing a new paper, and also to clearly indicate the relationship with previous papers, and give credit when credit is due. This helps the research community in making it easier to find papers and understanding the relationships between them.

Hope that this has been an interesting blog post. If you have time, you may read the above papers that I have mentioned. They are quite interesting and highlight this issue.

—
Philippe Fournier-Viger is a distinguished professor working in China and founder of the SPMF open source data mining software.

Posted in Academia | Tagged , , , , | Leave a comment

UDML 2024 @ PAKDD 2024 (deadline extended)

This is a short blog post to let you know that the deadline for submitting your papers to the UDML 2024 workshop at the PAKDD 2024 conference has been extended to the 7th February.

Website: https://www.philippe-fournier-viger.com/utility_mining_workshop_2024/

Note that this year, all accepted papers from UDML 2024 will be invited for an extended version in a special issue of the Expert Systems journal.

So this is a very good opportunity for your papers at PAKDD!

And happy new year 2024!

—
Philippe Fournier-Viger is a distinguished professor working in China and founder of the SPMF open source data mining software.

Posted in cfp | Tagged , , , , , , | Leave a comment

Your social network on DBLP as a graph

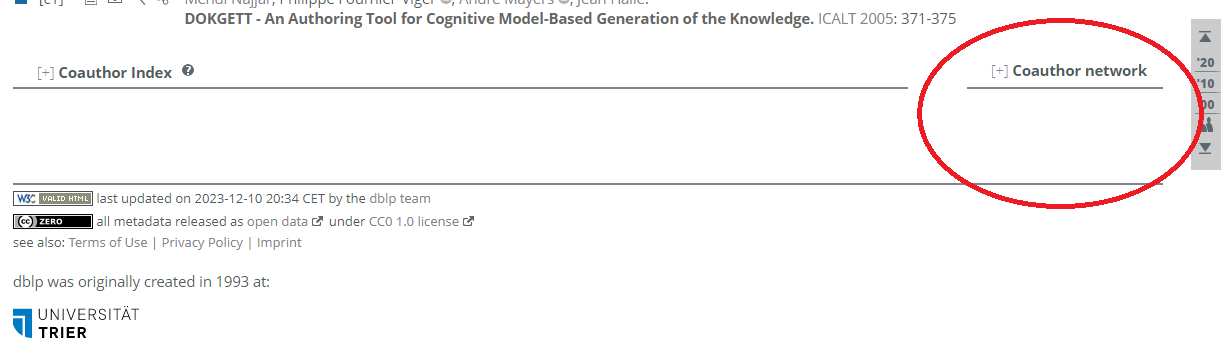
Today, I discovered an interesting function of DBLP which is to draw your social network as a graph (assuming that you have a DBLP page). To use that feature, it is simple. Open your DBLP webpage, and then click here at the bottom of the page:

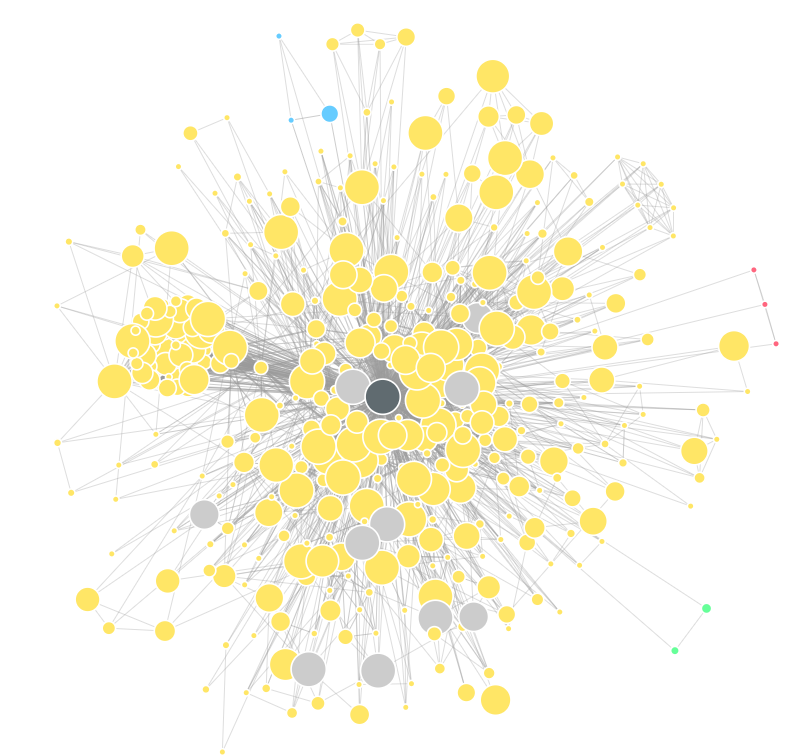
Then, your social network will be displayed (it can take a little while). For example, this is mine:

What is interesting is that it shows not only the direct co-authorship links, but also some transitive links thus highlighting some potential connections that one could create through his current network.

In the above picture, the graph is quite dense since I have 390 co-authors on DBLP.

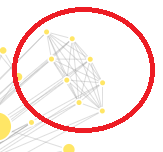
By observing this graph, we can also see some strange structures like this one:

This structure seems too perfect (all the authors are connected between themselves). Thus, I have investigated why. The reason is simple. It is a paper that I participated in, where there was 8 authors and most of them were not from computer science. Thus, most of the authors on that paper had only one paper on DBLP, which was the same.

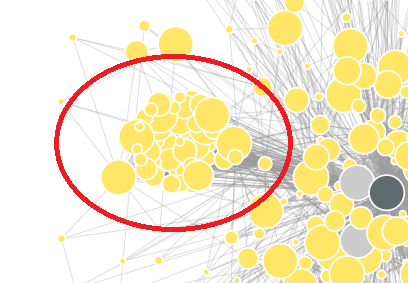
There is also a dense cluster here:

which is mostly European researchers.

I just wanted to share this interesting function with you in this blog post, as I have discovered it today (but it might have been available for a while!).

Posted in Academia, Research | Tagged , , , , , , | Leave a comment

Call for papers: UDML 2024 workshop @ PAKDD 2024

I am glad to announce that the 6th UDML 2024 workshop on Utility-Driven Mining and Learning will be held next year at the PAKDD 2024 conference.

IMPORTANT DATES

  • Workshop Paper Submission: January 17, 2024
  • Workshop Paper Acceptance Notification: February 7, 2024
  • Workshop Paper Camera-ready: February 21, 2024

PUBLICATIONS

All the accepted papers will be invited for publication in a special issue of the Expert Systems journal (Wiley, indexed in EI and SCI).

The website of UDML 2024 will be put online soon!

Posted in Uncategorized | Leave a comment

A new survey paper on episode mining!

I am pleased to announce today that my collaborators and I have published a new survey paper about episode mining to give an introduction to this nice and interesting subfield of pattern mining. To our knowledge this is the most complete and up-to-date survey paper on this topic.

What is Episode mining? Put simply, it is about analyzing a long sequence of events with timestamps to discover interesting patterns in it such as that some events often appear before other events within some interval of times. This has many applications in real-life such as analyzing relationships between alarms in computer networks.

I have previously written a blog post that gives and introduction to episode mining, and also published a video introduction to episode mining. But this time, it is a survey paper that is more detailed and give a broad and detailed overview of this research topic. You can read the new survey paper here:


Ouarem, O., Nouioua, F., Fournier-Viger, P. (2023). A Survey of Episode Mining. WIREs Data Mining and Knowledge Discovery, Wiley, to appear.

I hope that you will enjoy this new survey!
—
Philippe Fournier-Viger is a distinguished professor working in China and founder of the SPMF open source data mining software.
Posted in Data Mining, Data science, Pattern Mining | Tagged , , , , , , , | Leave a comment

How to write answers to reviewers for a journal using LaTeX?

Today, I will explain how to write the answer to reviewers for an academic journal using Latex. The advantage of using Latex instead of a software like Microsoft Word to write answers to reviewers is that it allows using all the features of LaTeX such packages for managing references, figures, and tables.

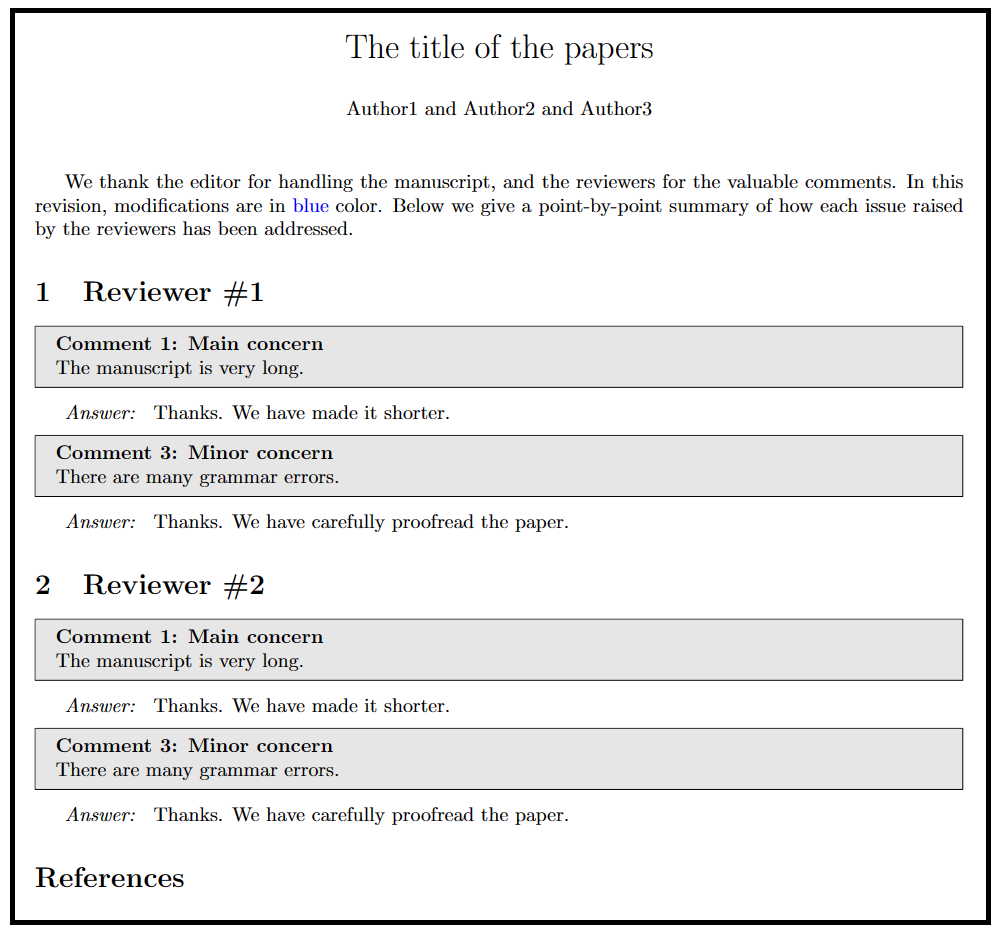
Since the LaTeX code that I will explain is very simple, let me first show you the result that we want to achieve. It will be a document where we can display the comments and corresponding answers for each reviewer. The result that we will achieve is a neat document that will look like this:

To do something like this, we will create two new LaTeX environments to display comments and solutions (answers), respectively. To draw the box around each comment, we will use a package called mdframed.

The code of the above document will then look like this:

\documentclass{article}
\usepackage{graphicx}
\usepackage{verbatim}
\usepackage[margin=1in]{geometry} 
\usepackage{xcolor}
\usepackage{mdframed}

\newenvironment{Comment}[2][Comment]
    { \begin{mdframed}[backgroundcolor=gray!20] 
    \textbf{#1 #2} \\}
    {  \end{mdframed}}


\newenvironment{solution}
    {\textit{Answer:} }
    {}

\begin{document}
\title{The title of the papers}

\author{\normalsize Author1 and Author2 and Author3}

\date{}
\maketitle

We thank the editor for handling the manuscript, and the reviewers for the valuable comments. In this revision, modifications are in {\color{blue}blue} color. Below we give a point-by-point summary of how each issue raised by the reviewers has been addressed.  

\section{Reviewer \#1}

\begin{Comment}{1: Main concern}
The manuscript is very long.
\end{Comment}

\begin{solution}
Thanks. We have made it shorter.
\end{solution}

\begin{Comment}{3: Minor concern}
There are many grammar errors.
\end{Comment}

\begin{solution}
Thanks. We have carefully proofread the paper.
\end{solution}

\bibliographystyle{plain}
\bibliography{mybib.bib}
\end{document}

Now let me explain the code. If you are familiar with LaTeX, you will see that this code is very simple. This code :

\newenvironment{Comment}[2][Comment]
    { \begin{mdframed}[backgroundcolor=gray!20] 
    \textbf{#1 #2} \\}
    {  \end{mdframed}}


\newenvironment{solution}
    {\textit{Answer:} }
    {}

defines two new environments for comments and solutions, respectively. Then, it is followed by code to display the title of the paper, show the author names and creates a section for each reviewer using the \section command. Then, the comment and solution environments are used to display comments and answers.

Conclusion

This was just a short blog post to show how to write answers to reviewers using LaTeX. The above template was provided by some collaborator, and I am not sure about where it originally came from. If someone knows, I could add the credit to the original author to this blog post.

This is the end of this blog post about writing a response to reviewers using LaTeX. I hope this blog post has been helpful and informative. If you have any questions or comments, please leave a comment below. Thank you for reading, and happy LaTeXing! 😊

Posted in Latex | Tagged , , , , , | Leave a comment

TexWorks: How to add a command to change the text color (using a script)

In this blog post, I will show how to add a script (commands) to TexWorks for adding a color to your Latex document. This is easy and can be used also for other types of commands.

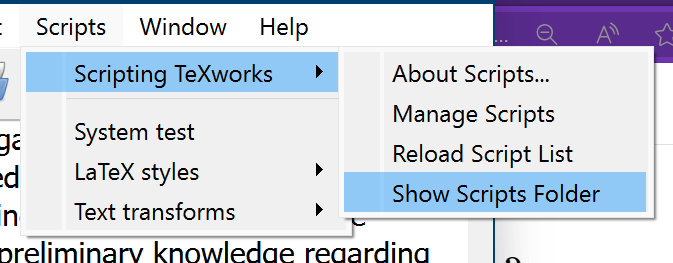
1) In TexWorks, go to the menu Scripts and then choose Show Scripts Folder:

This will open the folder containing the scripts.

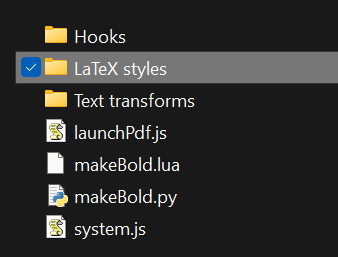
2) Open the subfolder Latex styles as we will add our new script to this folder:

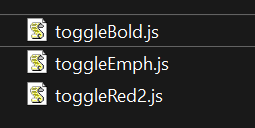
3) Make a copy of the file toogleBold.js and call it toogleRed.js:

4) Edit the file toogleRed.js as follows and save it:

// TeXworksScript
// Title: Toggle Red
// Shortcut: Ctrl+Shift+G
// Description: Encloses the current selection in \textcolor{red}{}
// Author: based on toogleBold by Jonathan Kew
// Version: 0.3
// Date: 2010-01-09
// Script-Type: standalone
// Context: TeXDocument

function addOrRemove(prefix, suffix) {
  var txt = TW.target.selection;
  var len = txt.length;
  var wrapped = prefix + txt + suffix;
  var pos = TW.target.selectionStart;
  if (pos >= prefix.length) {
    TW.target.selectRange(pos - prefix.length, wrapped.length);
    if (TW.target.selection === wrapped) {
      TW.target.insertText(txt);
      TW.target.selectRange(pos - prefix.length, len);
      return;
    }
    TW.target.selectRange(pos, len);
  }
  TW.target.insertText(wrapped);
  TW.target.selectRange(pos + prefix.length, len);
  return;
}

addOrRemove("\\textcolor{red}{", "}");

Here, what I have done is to make a new command that will automatically add \textcolor{red}{} arround some selected text when the user presses CTRL+SHIFT+G.

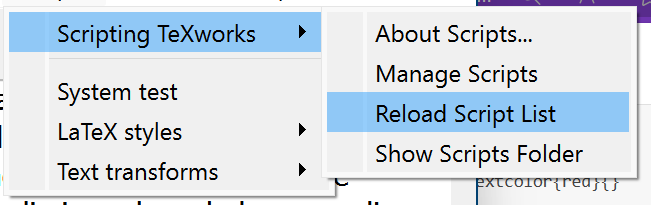
5) Go back to TexWorks, and reload the script list using the menu “Reload script list”:

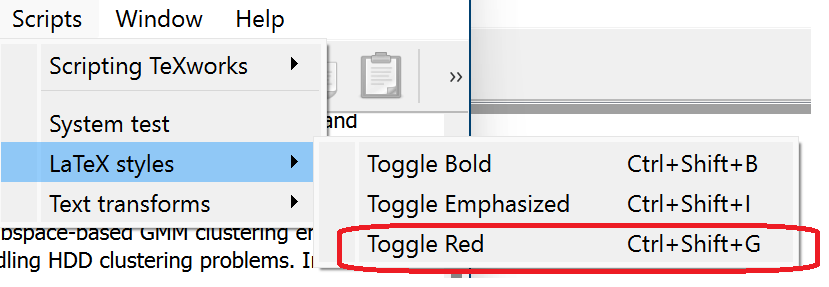
Then, the new command will appear in the menu Latex Styles:

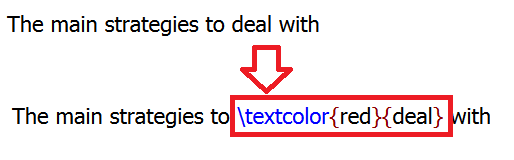
6) Then, you can try it by selecting some text in a latex document and then pressing CTRL+Shift+G:

That’s all!

And of course, to compile the LaTeX document, I assume that you are using the color package.

It is very convenient to make scripts for new commands in TexWorks!

And, If you want to do the same for the blue color, we could make another script like this:

// TeXworksScript
// Title: Toggle Blue
// Shortcut: Ctrl+Shift+D
// Description: Encloses the current selection in \textcolor{blue}{}
// Author: based on toogleBold by Jonathan Kew
// Version: 0.3
// Date: 2010-01-09
// Script-Type: standalone
// Context: TeXDocument

function addOrRemove(prefix, suffix) {
  var txt = TW.target.selection;
  var len = txt.length;
  var wrapped = prefix + txt + suffix;
  var pos = TW.target.selectionStart;
  if (pos >= prefix.length) {
    TW.target.selectRange(pos - prefix.length, wrapped.length);
    if (TW.target.selection === wrapped) {
      TW.target.insertText(txt);
      TW.target.selectRange(pos - prefix.length, len);
      return;
    }
    TW.target.selectRange(pos, len);
  }
  TW.target.insertText(wrapped);
  TW.target.selectRange(pos + prefix.length, len);
  return;
}

addOrRemove("\\textcolor{blue}{", "}");
Posted in Latex | Tagged , , , , | Leave a comment

KNN Interactive demo in your browser

Today, I want to show you a new interactive demo of the KNN (K-Nearest Neighbors) algorithm that I have added to my website. It is designed to be used for teaching purpose to illustrate how the K-Nearest Neighbors algorithm works.

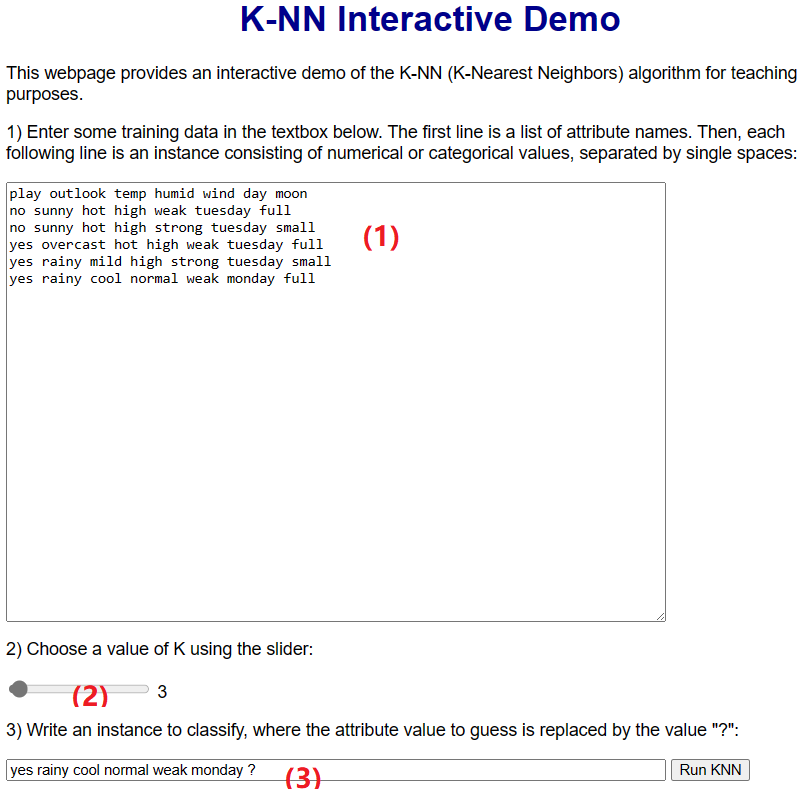
You can try the KNN Interactive demo here. The interface is like this:

In the section 1 of the webpage, you can enter some data that is a list of records or instances to be used by KNN to make predictions. The first line is the list of attributes. Then, each following line is a record, wich is a list of values separated by single spaces. The values can be categorical or numerical.

Then, the value of K can be selected in section 2 of the webpage. For the purpose of teaching, values of K are restricted to be between 1 to 100.

Then, you can provide an instance to classify in section 3 of the webpage. The instance to classify is a list of attribute values but one of them must be replaced by ? meaning that we want to predict this attribute value using KNN.

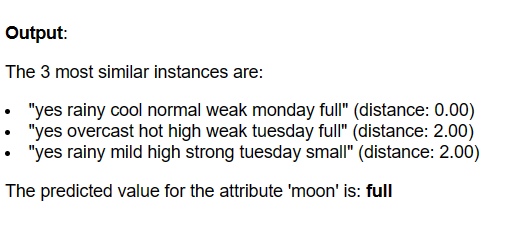
Finally, by clicking Run KNN button, the result are displayed like this:

It indicates the K most similar instances, the calculated distances between those instances and the instance, and the predicted attribute value.

It is possible to run the demo with different values of K and different data to observe the result, which can be good for learning.

Conclusion

This tool is for teaching purpose. If you want to try a more efficient implementation in Java, you could try the one from the SPMF data mining software, which is free and open source.

Posted in Uncategorized | Leave a comment

K-Means Interactive Demo in your browser

In this blog post, I introduce a new interactive tool for showing a demonstration of the K-Means algorithm for students (for teaching purposes).

The K-Means clustering demo tool can be accessed here:

philippe-fournier-viger.com/tools/kmeans_demo.php

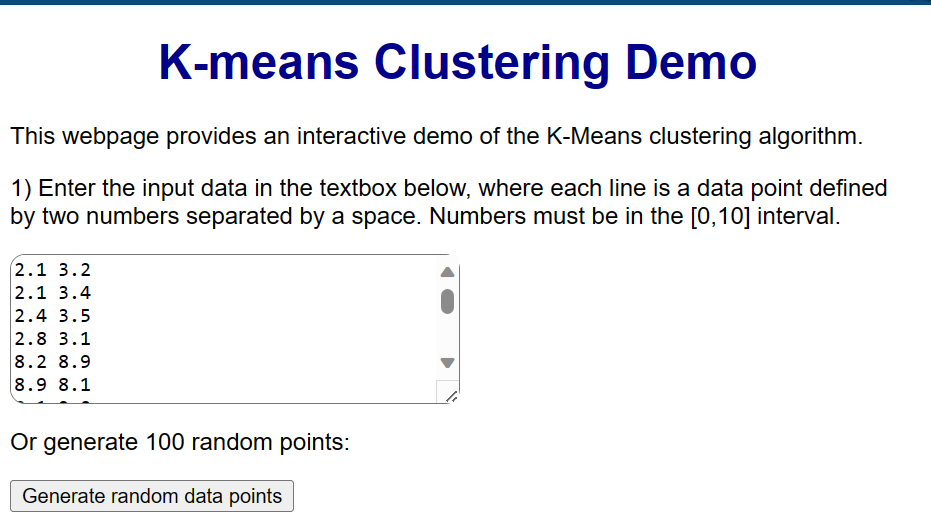
The K-Means demo, first let you enter a list of 2 dimensional data points in the range of [0,10] or to generate 100 random data points:

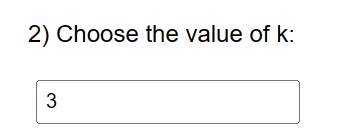
Then the user can choose the value of K, adjusts other settings, and run the K-Means algorithm.

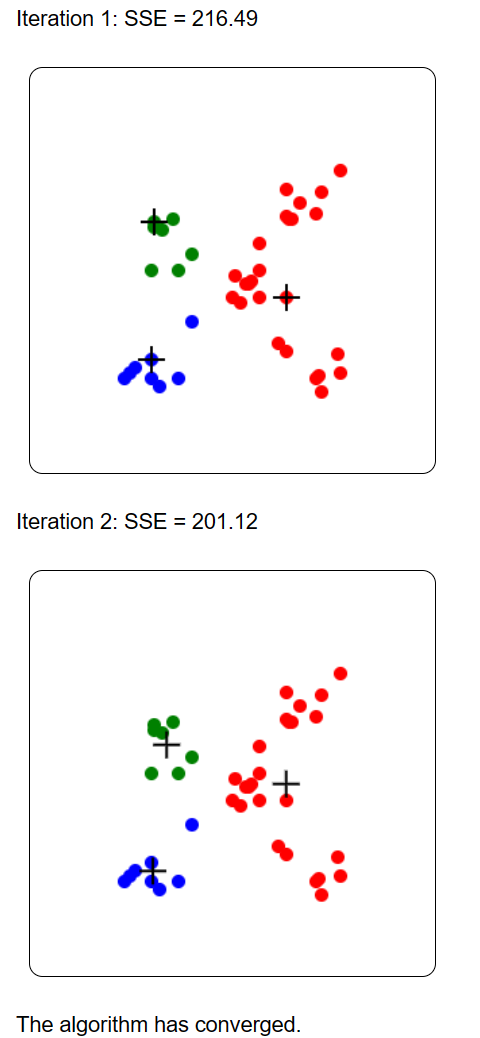
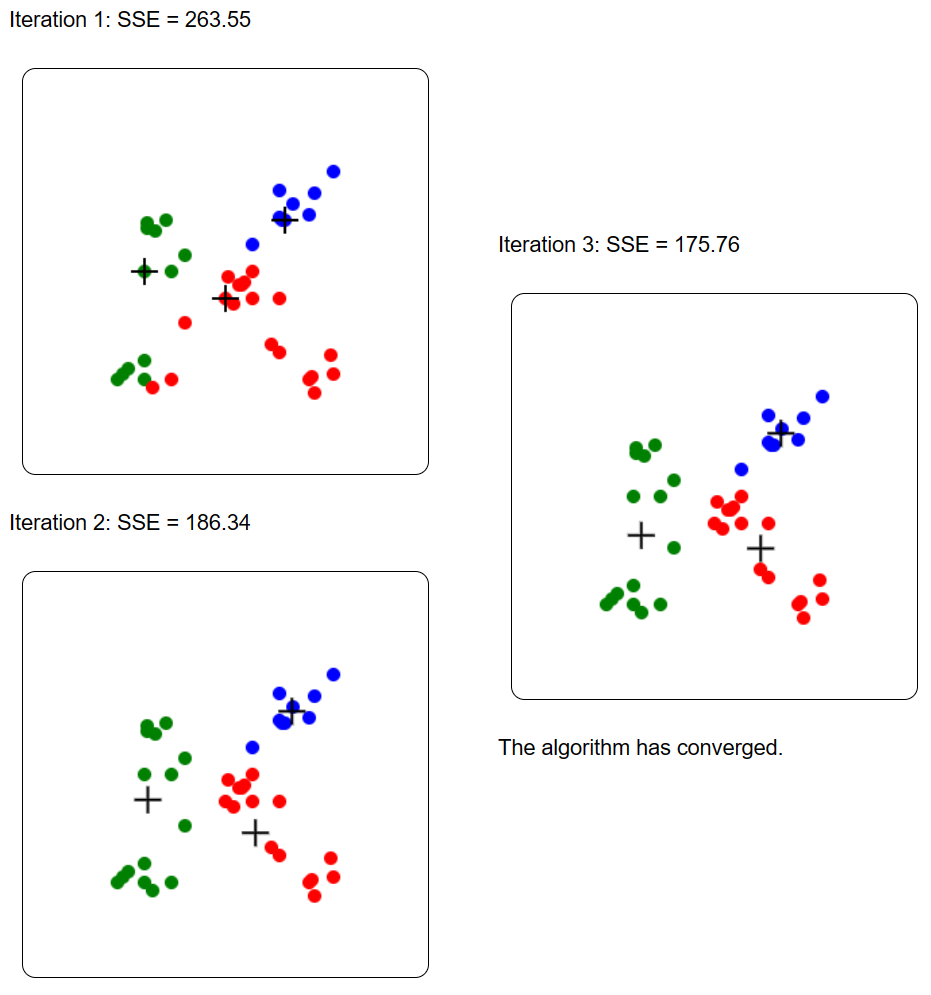
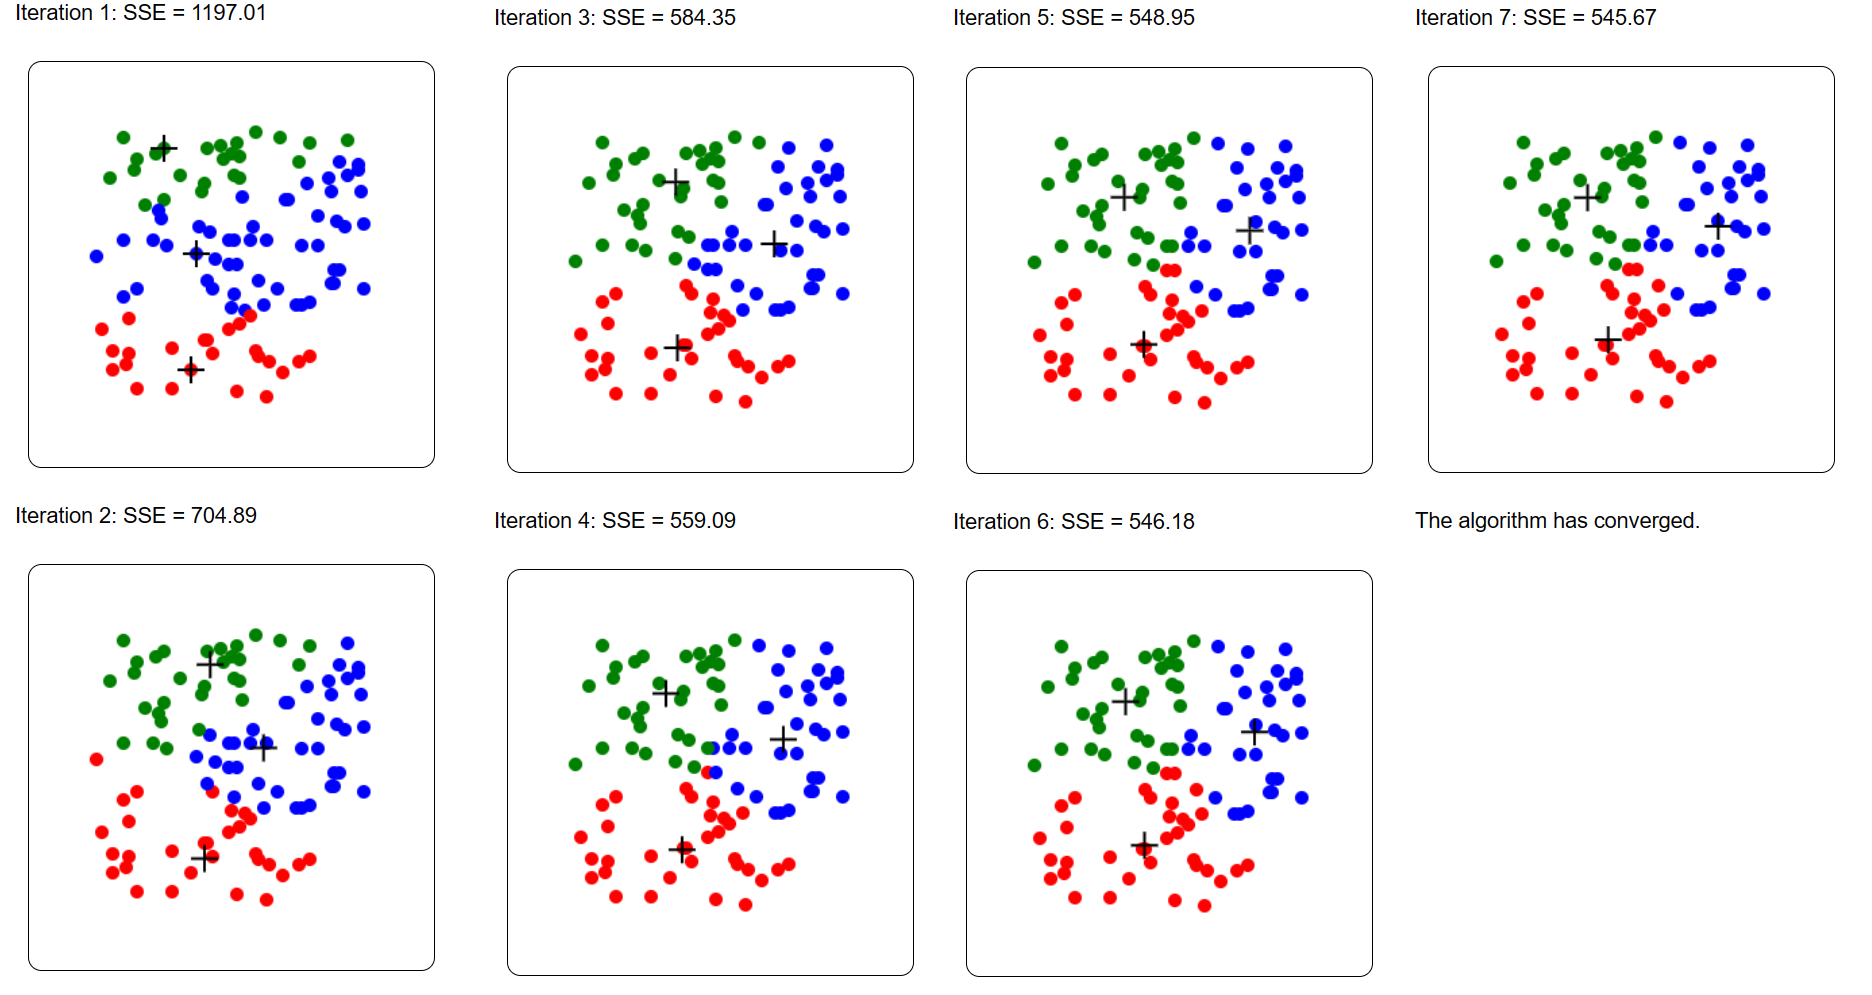
The result is then displayed for each iteration, step by step. Each cluster is represented by a different color. The SSE (Sum of Squared Error) is displayed, and the centroids of clusters are illustrated by the + symbol. For example, this is the result on the provided example dataset:

Because K-Means is a randomized algorithm, if we run it again the result may be different:

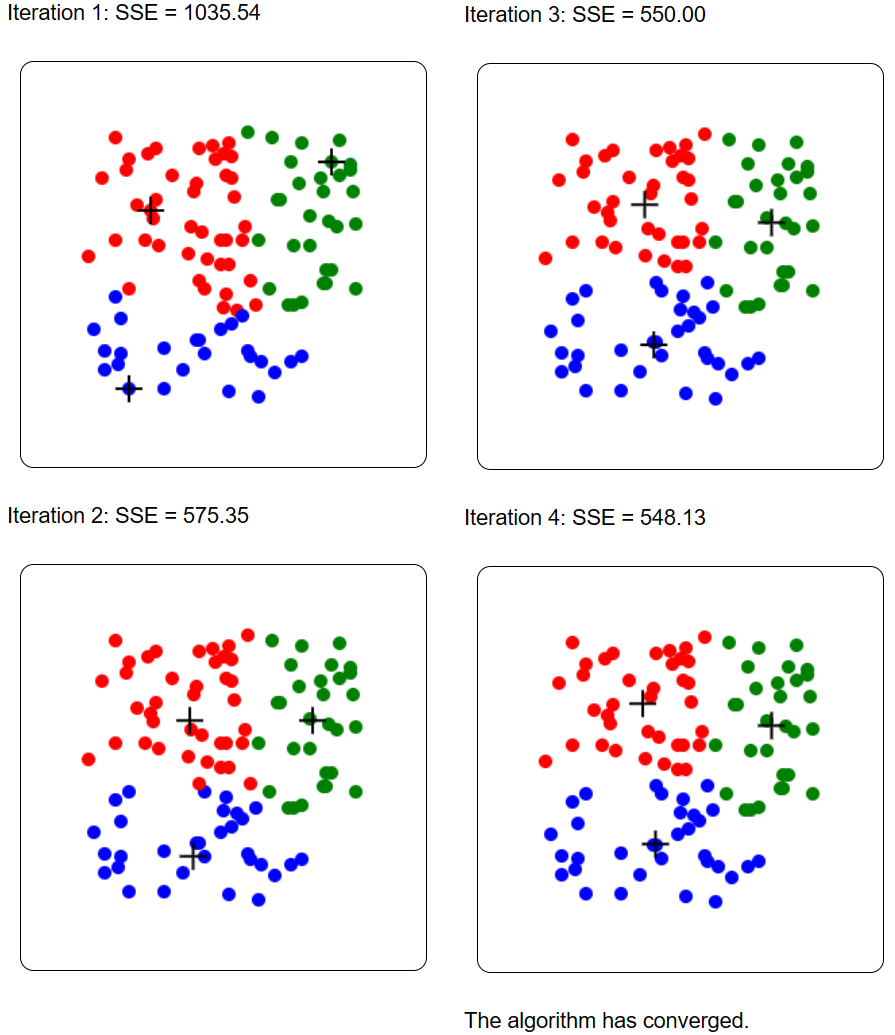
Now, let me show you the feature of generating random points. If I click the button for generating a random dataset and run K-Means, the result may look like this:

And again, because K-Means is randomized, I may execute it again on the same random dataset and get a different result:

I think that this simple tool can be useful for illustrating how the K-Means algorithm works to students. You may try it. It is simple to use and allows to visualize the result and clustering process. Hope that it will be useful!
—
Philippe Fournier-Viger is a distinguished professor working in China and founder of the SPMF open source data mining software.
Posted in Data Mining, Data science | Tagged , , , , , | Leave a comment

Busy times

Hi all, I just write a quick message to say that I did not write on the blog recently due to my very busy schedule recently. However, everything is going well. I will be back on the blog with more content soon, and I will start to add more videos to the YouTube channel soon. Also, I am working on the next version of SPMF. 😉

Stay tuned!

Posted in Uncategorized | Leave a comment