In this blog post, I will provide a brief report about the 16thIndustrial Conference on Data mining 2016, that I have attended from the 13 to 14 July 2016 in New York, USA.
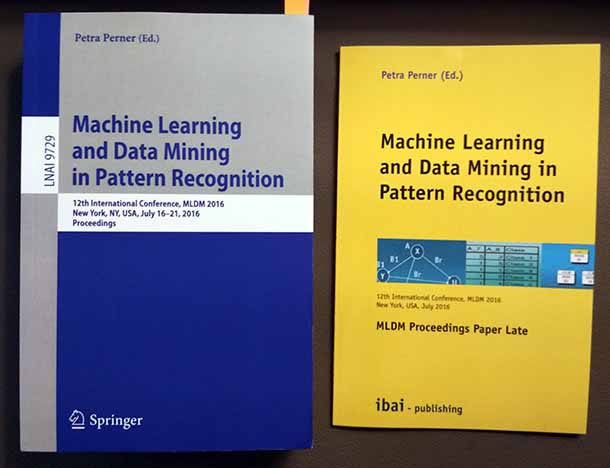
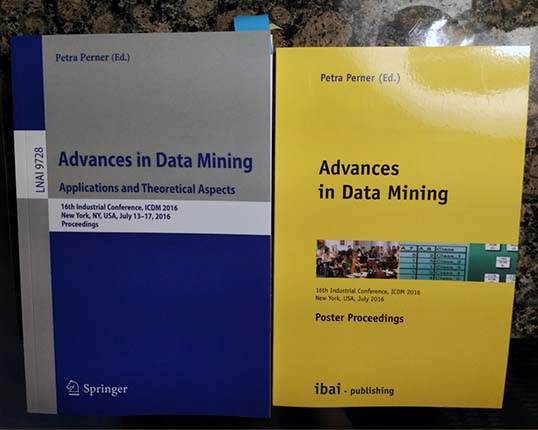
About the conference This conference is an established conference in the field of data mining. It is the 16th edition of the conference. The main proceedings are published by Springer, which ensures that the conference proceedings are well-indexed, while the poster proceedings are published by Ibai solutions.
The proceedings for full papers and posters
The acronym of this conference is ICDM (Industrial Conference on Data Mining). However, it should not be confused with IEEE ICDM (IEEE International Conference on Data Mining).
Acceptance rate
The quality of the papers at this conference has been fine. 33 papers have been accepted and it was said during the conference that the acceptance rate was 33%. It is interesting though that this conference attracts many papers related to industry applications due to the name of the conference. There was some paper presentations from IBM Research and Mitsubishi.
Conference location
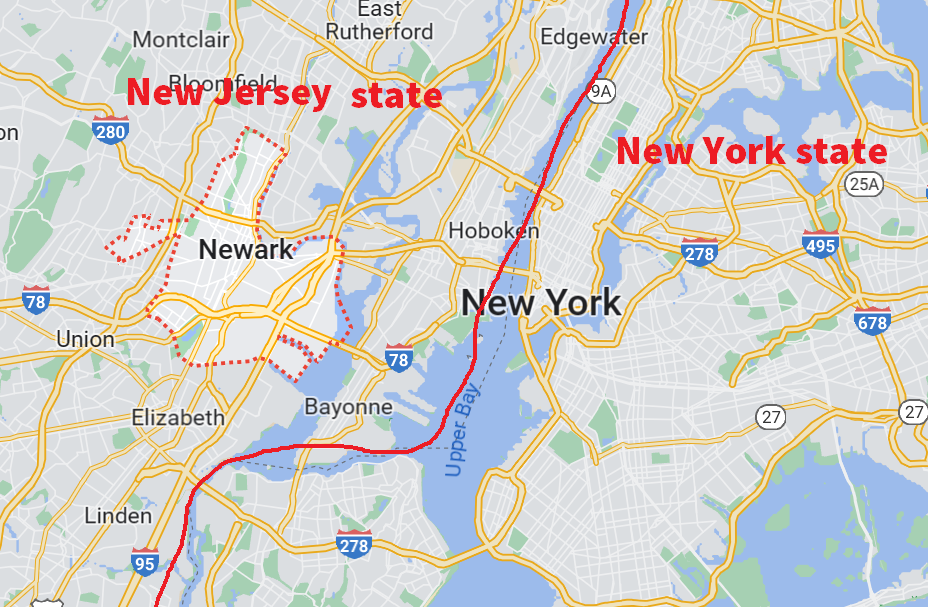
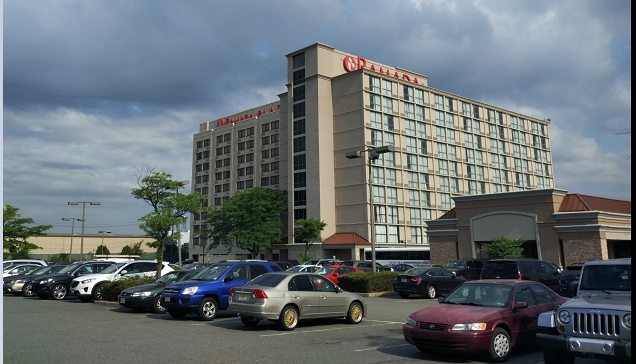
In the past, this conference has been held mostly in Germany, as the organizer is German. But this year, it is organized in New York, USA, and more specifically at a hotel in Newark, New Jersey beside New York. It is interesting that the conference is collocated and co-organized with the MLDM conference. Hence, it is possible to spend 9 days in Newark to attend both conferences. About MLDM 2016, you can read my report about this conference here: MLDM 2016.
First day of the conference
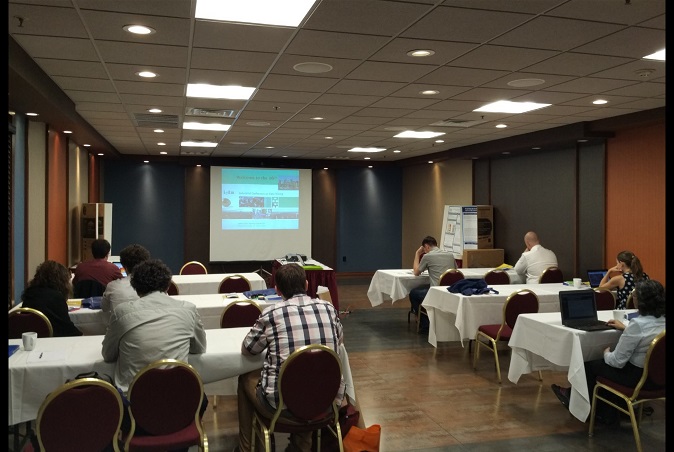
The conference is two days (excluding workshops and tutorials which requires additional fees). The first day was scheduled to start at 9:00 and finish at around 18:00.
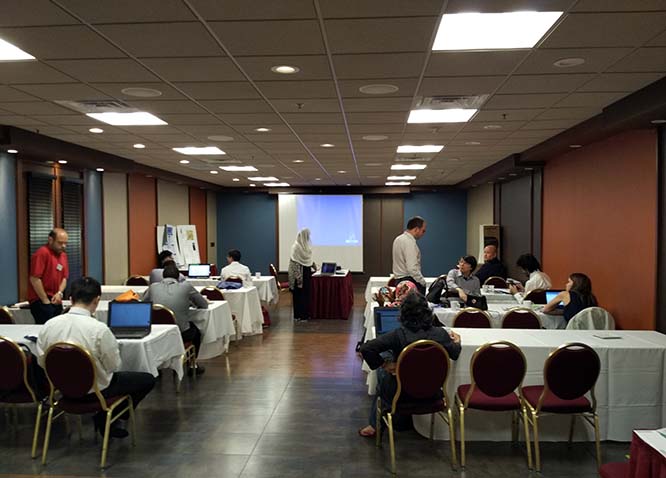
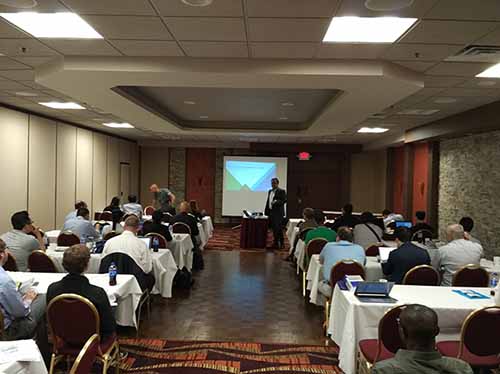
The conference room
The conference started by an opening ceremony. After the opening ceremony, there was supposed to be a keynote but the keynote speaker could unfortunately not attend the conference due to personal reasons.
Then, there was paper presentations. The main topics of the papers have been applications in medicine, algorithms for itemset mining, applying clustering to analyze data about divers, text mining, prediction of rainfall using deep learning, analyzing GPS traces of truck drivers, and preventing network attacks in the cloud using classifiers. I presented a paper about high-utility itemset mining and periodic pattern mining.
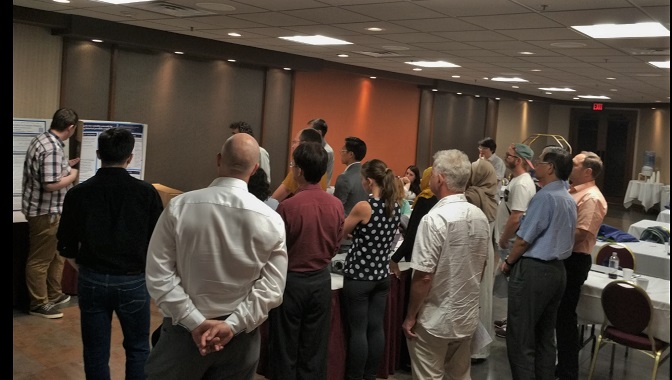
After the paper presentations, there was a poster session. One of the poster applied data mining in archaeology, which is a quite unusual application of data mining.
The poster session
Finally, there was a banquet at the same hotel. The food was fine. Since, the conference is quite small, there was only three tables of 10 persons. But a small conference also means a more welcoming atmosphere and more proximity between participants, such that it was easy to discuss with everyone.
Second day of the conference
The second day of the conference started at 9:00. It consisted of paper presentations. The topics of the paper have covered topics such as association rules, alarm monitoring, distributed data mining, process mining, diabetes age prediction and data mining to analyse wine ratings.
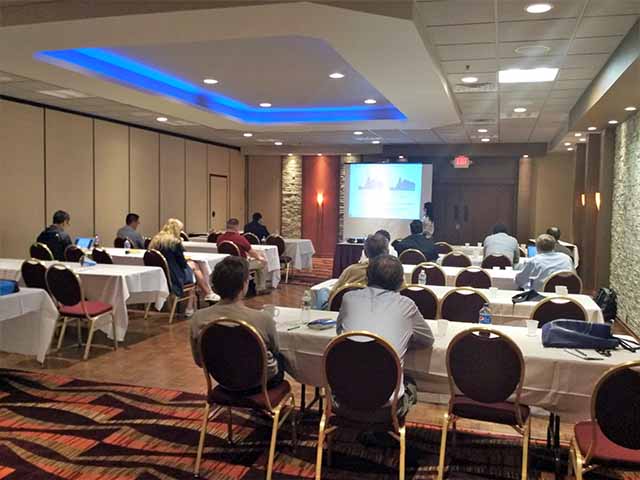
The second day
Best paper award
One thing that I think is great about this conference is that there is a 500 € prize for the best paper. Not many conferences have a cash prize for the best paper award. Also, there was three nominated papers for the best paper award, and each nominee got a certificate. As one of my paper got nominated, I got a nice certificate (though I did not receive the best paper award).
Best paper nomination certificate
Conclusion
It was the first time that I have attended this conference. It is a small conference compared to some other conferences. It is not a first tier conference in data mining. But it is still published by Springer. At this conference, I did not met anyone working exactly in my field, but I still had the opportunity to meet some interesting researchers. The MLDM conference that I have also attended after that conference was bigger.
== Philippe Fournier-Vigeris a full professor and the founder of theopen-source data mining software SPMF,offering more than 110 data mining algorithms. If you like this blog, you can tweet about it and/or subscribe to my twitter account @philfv to get notified about new posts.
A key question for data mining and data science researchers is to know what are the top journals and conferences in the field, since it is always best to publish in the most popular journals or conferences. In this blog post, I will look at four different rankings of data mining journals and conferences based on different criteria, and discuss these rankings.
1) The Google Ranking of data mining and analysis journals and conferences
A first ranking is the Google Scholar Ranking (https://scholar.google.com/citations?view_op=top_venues&hl=en&vq=eng_datamininganalysis). This ranking is automatically generated based on the H5 index measure. The H5 index measure is described as “the h-index for articles published in the last 5 complete years. It is the largest number h such that h articles published in 2011-2015 have at least h citations each“. The ranking of the top 20 conferences and journals is the following:
Publication
h5-index
h5-median
Type
1
ACM SIGKDD International Conference on Knowledge discovery and data mining
67
98
Conference
2
IEEE Transactions on Knowledge and Data Engineering
66
111
Journal
3
ACM International Conference on Web Search and Data Mining
58
94
Conference
4
IEEE International Conference on Data Mining (ICDM)
39
64
Conference
5
Knowledge and Information Systems (KAIS)
38
52
Journal
6
ACM Transactions on Intelligent Systems and Technology (TIST)
37
68
Journal
7
ACM Conference on Recommender Systems
35
64
Conference
8
SIAM International Conference on Data Mining (SDM)
35
54
Conference
9
Data Mining and Knowledge Discovery
33
57
Journal
10
Wiley Interdisciplinary Reviews: Data Mining and Knowledge Discovery
30
56
Journal
11
European Conference on Machine Learning and Knowledge Discovery in Databases (PKDD)
30
36
Conference
12
Social Network Analysis and Mining
26
37
Journal
13
ACM Transactions on Knowledge Discovery from Data (TKDD)
23
39
Journal
14
International Conference on Artificial Intelligence and Statistics
23
29
Conference
15
Pacific-Asia Conference on Knowledge Discovery and Data Mining (PAKDD)
22
30
Conference
16
IEEE International Conference on Big Data
18
30
Conference
17
Advances in Data Analysis and Classification
18
25
Journal
18
Statistical Analysis and Data Mining
17
30
Journal
19
BioData Mining
17
25
Journal
20
Intelligent Data Analysis
16
21
Journal
Some interesting observations can be made from this ranking:
It shows that some conferences in the field of data mining actually have a higher impact than some journals. For example, the well-known KDD conference is ranked higher than all journals.
It appears strange that the KAIS journal is ranked higher than DMKD/DAMI and the TKDD journals, which are often regarded as better journals than KAIS. However, it may be that the field is evolving, and that KAIS has really improved over the years.
2) The Microsoft Ranking of data mining conferences
Another automatically generated ranking is the Microsoft ranking of data mining conferences (http://academic.research.microsoft.com/RankList?entitytype=3&topdomainid=2&subdomainid=7&orderby=1). This ranking is based on the number of publications and citations. Contrarily to Google, Microsoft has separated rankings for conferences and journals.
Besides, Microsoft offers two metrics for ranking : the number of citations and the Field Rating. It is not very clear how the “field rating” is calculated by Microsoft. The Microsoft help center describes it as follows: “The Field Rating is similar to h-index in that it calculates the number of publications by an author and the distribution of citations to the publications. Field rating only calculates publications and citations within a specific field and shows the impact of the scholar or journal within that specific field“.
Here is the conference ranking of the top 30 conferences by citations:
Rank
Conference
Publications
Citations
1
KDD – Knowledge Discovery and Data Mining
2063
69270
2
ICDE – International Conference on Data Engineering
4012
67386
3
CIKM – International Conference on Information and Knowledge Management
2636
28621
4
ICDM – IEEE International Conference on Data Mining
2506
18362
5
SDM – SIAM International Conference on Data Mining
708
9095
6
PKDD – Principles of Data Mining and Knowledge Discovery
994
8875
7
PAKDD – Pacific-Asia Conference on Knowledge Discovery and Data Mining
1255
6400
8
DASFAA – Database Systems for Advanced Applications
1251
4001
9
RIAO – Recherche d’Information Assistee par Ordinateur
574
3551
10
DMKD / DAMI – Research Issues on Data Mining and Knowledge Discovery
103
3264
11
DaWaK – Data Warehousing and Knowledge Discovery
503
2648
12
DS – Discovery Science
553
2256
13
Fuzzy Systems and Knowledge Discovery
4626
2171
14
DOLAP – International Workshop on Data Warehousing and OLAP
177
1830
15
IDEAL – Intelligent Data Engineering and Automated Learning
1032
1789
16
WSDM – Web Search and Data Mining
196
1499
17
GRC – IEEE International Conference on Granular Computing
1351
1434
18
ICWSM – International Conference on Weblogs and Social Media
238
1142
19
DMDW – Design and Management of Data Warehouses
70
993
20
FIMI – Workshop on Frequent Itemset Mining Implementations
32
849
21
MLDM – Machine Learning and Data Mining in Pattern Recognition
313
822
22
PJW – Workshop on Persistence and Java
41
712
23
ADMA – Advanced Data Mining and Applications
562
676
24
ICETET – International Conference on Emerging Trends in Engineering & Technology
712
376
25
WKDD – Workshop on Knowledge Discovery and Data Mining
527
342
26
KDID – International Workshop on Knowledge Discovery in Inductive Databases
70
328
27
ICDM – Industrial Conference on Data Mining
304
323
28
DMIN – Int. Conf. on Data Mining
434
278
29
MineNet – Mining Network Data
22
278
30
WebMine – Workshop on Web Mining
15
245
And here is the top 30 conferences by Field rating:
Rank
Conference
Publications
Field Rating
1
KDD – Knowledge Discovery and Data Mining
2063
122
2
ICDE – International Conference on Data Engineering
4012
104
3
CIKM – International Conference on Information and Knowledge Management
2636
67
4
ICDM – IEEE International Conference on Data Mining
2506
56
5
SDM – SIAM International Conference on Data Mining
708
45
6
PKDD – Principles of Data Mining and Knowledge Discovery
994
40
7
PAKDD – Pacific-Asia Conference on Knowledge Discovery and Data Mining
1255
33
8
RIAO – Recherche d’Information Assistee par Ordinateur
574
28
9
DMKD / DAMI – Research Issues on Data Mining and Knowledge Discovery
103
27
10
DASFAA – Database Systems for Advanced Applications
1251
26
11
DaWaK – Data Warehousing and Knowledge Discovery
503
22
12
DOLAP – International Workshop on Data Warehousing and OLAP
177
22
13
DS – Discovery Science
553
20
14
ICWSM – International Conference on Weblogs and Social Media
238
19
15
WSDM – Web Search and Data Mining
196
19
16
DMDW – Design and Management of Data Warehouses
70
19
17
PJW – Workshop on Persistence and Java
41
16
18
FIMI – Workshop on Frequent Itemset Mining Implementations
32
14
19
GRC – IEEE International Conference on Granular Computing
1351
13
20
IDEAL – Intelligent Data Engineering and Automated Learning
1032
13
21
MLDM – Machine Learning and Data Mining in Pattern Recognition
313
13
22
Fuzzy Systems and Knowledge Discovery
4626
11
23
ADMA – Advanced Data Mining and Applications
562
10
24
KDID – International Workshop on Knowledge Discovery in Inductive Databases
70
10
25
ICDM – Industrial Conference on Data Mining
304
9
26
MineNet – Mining Network Data
22
9
27
ESF Exploratory Workshops
17
8
28
TSDM – Temporal, Spatial, and Spatio-Temporal Data Mining
13
8
29
ICETET – International Conference on Emerging Trends in Engineering & Technology
712
7
30
WKDD – Workshop on Knowledge Discovery and Data Mining
527
7
Some observations:
The ranking by citations and by field rating are quite similar.
The KDD conference is still the #1 conference. This make sense, and also that the CIKM, ICDM and SDM conferences are among the top conferences in the field
PKDD is higher than PAKDD, which are higher than DASFAA and DAWAK as in the Google ranking, and I agree with this.
Some conferences were not in the Google ranking like ICDE. It may be because the Google ranking put the ICDE conference in a different category.
Microsoft rank DMKD / DAMI as a conference, while it is a journal.
The FIMI workshop is also ranked high although that workshops only occurred in 2003 and 2004. Thus, it seems that Microsoft has no restrictions on time. Actually, since the FIMI workshop was not help since 2004, it should not be in this ranking. The ranking would probably be better if Microsoft would consider only the last five years for example.
3)The Microsoft Ranking of data mining journals
Now let’s look at the top 20 data mining journals according to Microsoft, by citations.
Rank
Journal
Publications
Citations
1
IPL – Information Processing Letters
7044
62746
2
TKDE – IEEE Transactions on Knowledge and Data Engineering
2742
60945
3
CS&DA – Computational Statistics & Data Analysis
4524
24716
4
DATAMINE – Data Mining and Knowledge Discovery
584
19727
5
VLDB – The Vldb Journal
631
17785
6
Journal of Knowledge Management
747
9601
7
Sigkdd Explorations
491
9564
8
Journal of Classification
550
8041
9
KAIS – Knowledge and Information Systems
741
7639
10
WWW – World Wide Web
540
7182
11
INFFUS – Information Fusion
567
5617
12
IDA – Intelligent Data Analysis
477
4167
13
Transactions on Rough Sets
221
1653
14
JECR – Journal of Electronic Commerce Research
122
1577
15
TKDD – ACM Transactions on Knowledge Discovery From Data
110
716
16
IJDWM – International Journal of Data Warehousing and Mining
102
366
17
IJDMB – International Journal of Data Mining and Bioinformatics
132
256
18
IJBIDM – International Journal of Business Intelligence and Data Mining
124
251
19
Statistical Analysis and Data Mining
124
169
20
IJICT – International Journal of Information and Communication Technology
111
125
And here is the top 20 journals by Field Rating.
Rank
Journal
Publications
Field Rating
1
TKDE – IEEE Transactions on Knowledge and Data Engineering
2742
109
2
IPL – Information Processing Letters
7044
80
3
VLDB – The Vldb Journal
631
61
4
DATAMINE – Data Mining and Knowledge Discovery
584
57
5
Sigkdd Explorations
491
50
6
CS&DA – Computational Statistics & Data Analysis
4524
49
7
Journal of Knowledge Management
747
46
8
WWW – World Wide Web
540
42
9
Journal of Classification
550
37
10
INFFUS – Information Fusion
567
36
11
KAIS – Knowledge and Information Systems
741
33
12
IDA – Intelligent Data Analysis
477
28
13
JECR – Journal of Electronic Commerce Research
122
21
14
Transactions on Rough Sets
221
20
15
TKDD – ACM Transactions on Knowledge Discovery From Data
110
13
16
IJDMB – International Journal of Data Mining and Bioinformatics
132
8
17
IJDWM – International Journal of Data Warehousing and Mining
102
8
18
IJBIDM – International Journal of Business Intelligence and Data Mining
124
7
19
Statistical Analysis and Data Mining
124
7
20
IJICT – International Journal of Information and Communication Technology
111
5
Some observations:
The ranking by citations and field rating are quite similar.
The TKDE journal is again in the top of the ranking, just like in the Google ranking.
It make sense that the VLDB journal is quite high. This journal was not in the Google ranking probably because it is more a database journal than a data mining journal.
Sigkdd explorations is also a good journals, and it make sense to be in the list. However, I’m not sure that it should be higher than TKDD and DMKD / DAMI.
The KAIS journal is still ranked quite high. This time it is lower than DMKD / DAMI (unlike in the Google Ranking) but still higher than TKDD. This is quite strange. Actually, TKDD is arguably a better journal. As explained in the comment section of this blog post, a reason why KAIS is ranked so high may be because in the past, the journal has encouraged authors to cite papers from the KAIS journal. Besides, it appears that the Microsoft ranking has no restriction on time (it does not consider only the last five years for example).
It is also quite strange that “Intelligent Data Analysis” is ranked higher than TKDD.
Some journals like WWW and JECR should perhaps not be in this ranking. Although they publish data mining papers, they do not exclusively focus on data mining. And this is probably the reason why they are not in the Google ranking. On overall, the Microsoft ranking seems to be broader than the Google ranking.
4) Impact factor ranking
Now, another popular way of ranking journals is using their impact factor (IF). I have taken some of the top data mining journals above and obtained their Impact Factor from 2014/2015 or 2013, when I could not find the information for 2015. Here is the result:
Journal
Impact factor
DMKD/DAMI Data Mining and Knowledge Discovery
2.714
IEEE Transactions on Knowledge and Data Engineering
2.476
Knowledge and Information Systems
1.78
VLDB – The Vldb Journal
1.57
TKDD – ACM Transactions on Knowledge Discovery From Data
1.14
Advances in Data Analysis and Classification
1.03
Intelligent Data Analysis
0.50
Some observations:
TKDE and DAMI/DMKD are still among the top journal
As in the Microsoft ranking, DAMI/DMKD is above KAIS, which is above TKDD.
As pointed out in the comment section of this blog post, it is strange that KAIS is so high, compared for example to TKDD, or VLDB, which is a first-tier database journal. This shows that IF is not a perfect metric.
Compared to the Microsoft Ranking, the IF ranking at least has the “Intelligent Data Analysis” journal much lower than TKDD. This make sense, as TKDD is a better journal.
Conclusion
In this blog post, we have looked at three different rankings of data mining journals and conferences: the Microsoft ranking, the Google ranking, and the Impact Factor ranking.
All these rankings are not perfect. They are somewhat accurate but they may not always correspond to the actual reputation in the data mining field. The Google ranking is more focused on the data mining field, while the Microsoft ranking is perhaps too broad, and seems to have no restriction on time. Also, as it can be seen by observing these rankings, different measures yield different rankings. However, there are still some clear trends in these ranking such as TKDE being ranked as one of the top journal and KDD as the top conference in all rankings. The top journals and conferences are more or less the same in each ranking. But there are also some strange ranks such as KAIS and Intelligent Data Analysis being ranked higher than TKDD in the Microsoft ranking.
Do you agree with these rankings? Please leave your comments below!
Update 2016-07-19: I have updated the blog post based on the insightful comments made by Jefrey in the comment section. Thanks!
== Philippe Fournier-Vigeris a full professor and the founder of theopen-source data mining software SPMF,offering more than 110 data mining algorithms. If you like this blog, you can tweet about it and/or subscribe to my twitter account @philfv to get notified about new posts.
In this blog post I will give an introduction to the discovery of periodic patterns in data. Mining periodic patterns is an important data mining task as patterns may periodically appear in all kinds of data, and it may be desirable to find them to understand data for taking strategic decisions.
For example, consider customer transactions made in retail stores. Analyzing the behavior of customers may reveal that some customers have periodic behaviors such as buying some products every week-end such as wine and cheese. Discovering these patterns may be useful to promote products on week-ends, or take other marketing decisions.
Another application of periodic pattern mining is stock market analysis. One may analyze the price fluctuations of stocks to uncover periodic changes in the market. For example, the stock price of a company may follow some patterns every month before it pays its dividend to its shareholders, or before the end of the year.
In the following paragraph, I will first present the problem of discovering frequent periodic patterns, periodic patterns that appear frequently. Then, I will discuss an extension of the problem called periodic high-utility pattern mining that aims at discovering profitable patterns that are periodic. Moreover, I will present open-source implementations of popular algorithms such as PFPMand PHMfor mining periodic patterns.
The problem of mining frequent periodic patterns
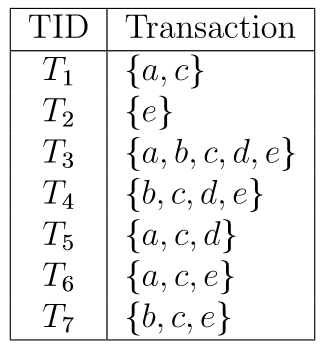
The problem of discovering periodic patterns can be generally defined as follows. Consider a database of transactions depicted below. Each transaction is a set of items (symbols), and transactions are ordered by their time.
A transaction database
Here, the database contains seven transactions labeled T1 to T7. This database format can be used to represent all kind of data. However, for our example, assume that it is a database of customer transactions in a retail store. The first transaction represents that a customer has bought the items a and c together. For example, a could mean an apple, and c could mean cereals.
Having such a database of objects or transactions, it is possible to find periodic patterns. The concept of periodic patterns is based on the notion of period.
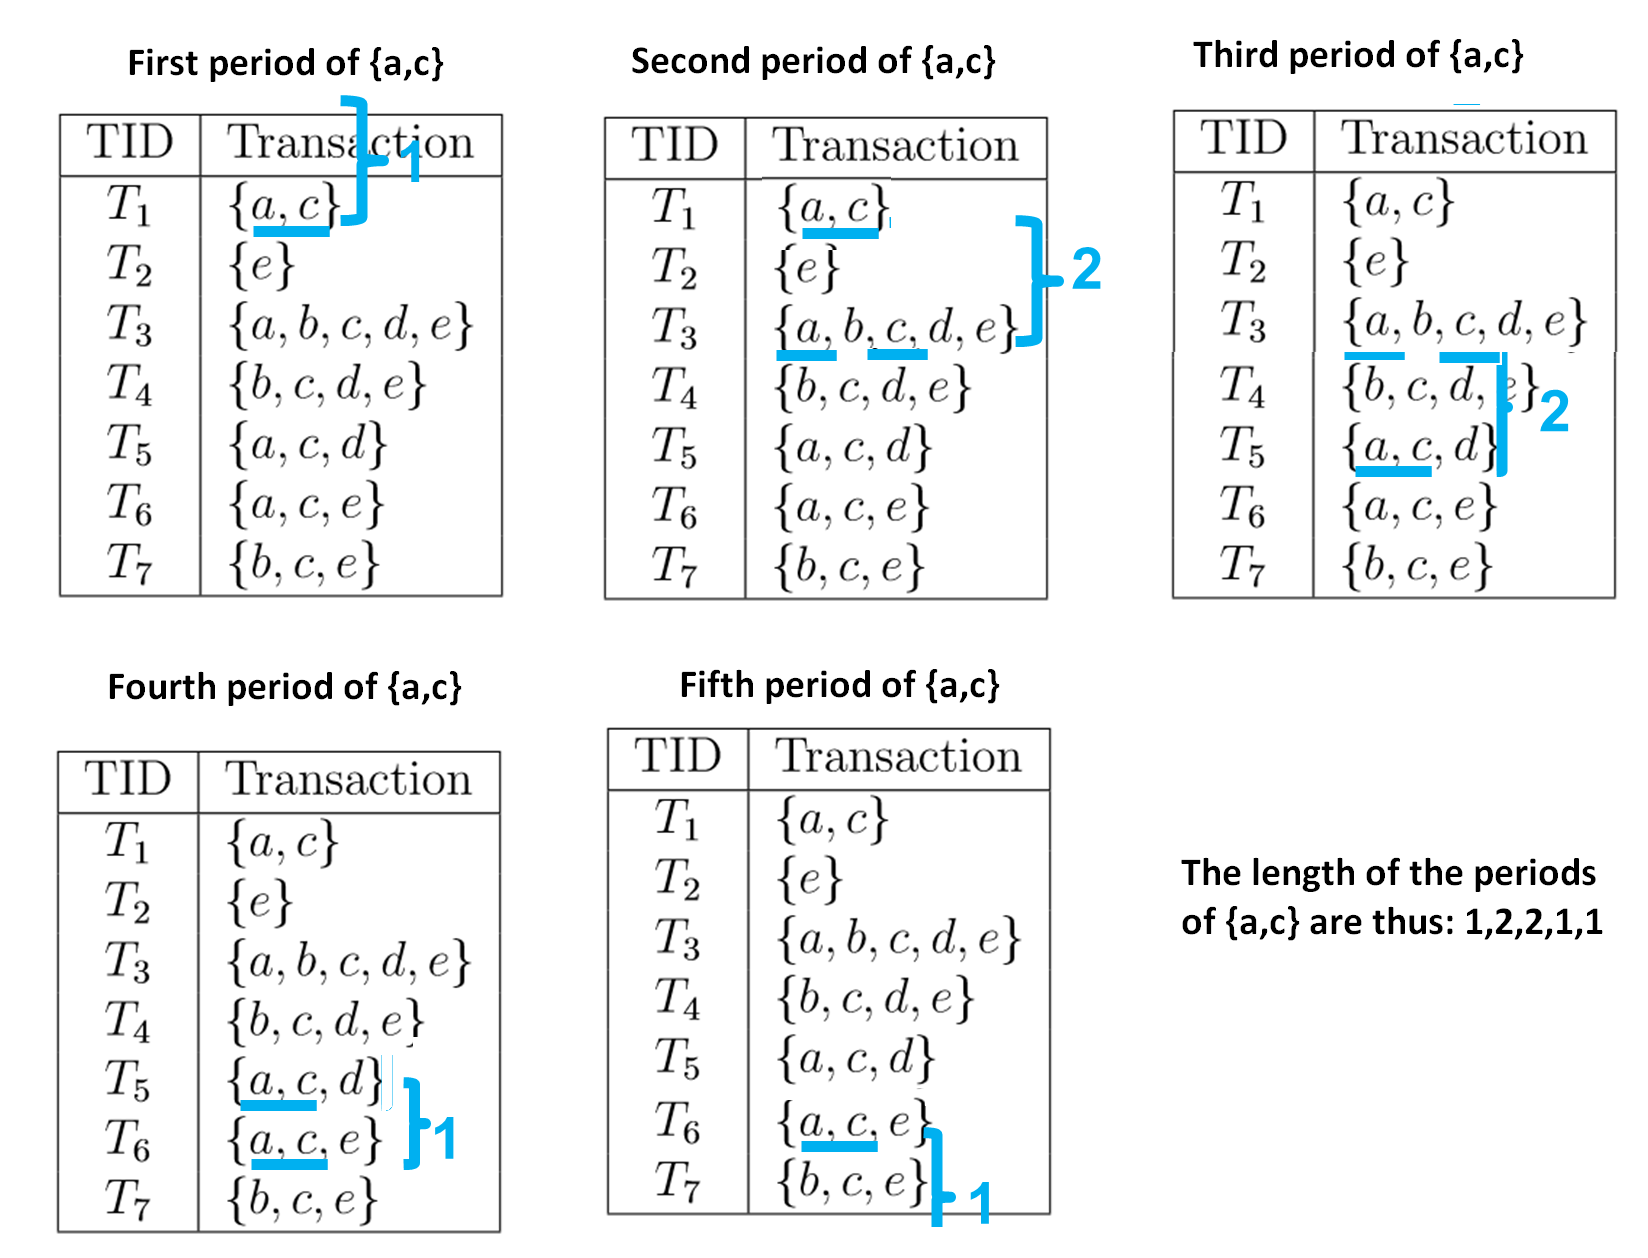
A period is the time elapsed between two occurrences of a pattern. It can be counted in terms of time, or in terms of a number of transactions. In the following, we will count the length of periods in terms of number of transactions. For example, consider the itemsets (set of items) {a,c}. This itemset has five periods illustrated below. The number that is used to annotate each period is the period length calculated as a number of transactions.
The first period of {a,c} is what appeared before the first occurrence of {a,c}. By definition, if {a,c} appears in the first transaction of the database, it is assumed that this period has a length of 1.
The second period of {a,c} is the gap between the first and second occurrences of {a,c}. The first occurrence is in transaction T1 and the second occurrence is in transaction T3. Thus, the length of this period is said to be 3 – 1 = 2 transactions.
The third period of {a,c} is the gap between the second and third occurrences of {a,c}. The second occurrence is in transaction T3 and the third occurrence is in transaction T5. Thus, the length of this period is said to be 5 – 3 = 2 transactions.
The fourth period of {a,c} is the gap between the third and fourth occurrences of {a,c}. The third occurrence is in transaction T5 and the fourth occurrence is in transaction T6. Thus, the length of this period is said to be 6 – 5 =1 transactions.
Now, the fifth period is interesting. It is defined as the time elapsed between the last occurrence of {a,c} (in T6) and the last transaction in the database, which is T7. Thus, the length of this period is also 7 – 6 = 1 transaction.
Thus, in this example, the list of period lengths of the pattern {a,c} is: 1,2,2,1,1.
Several algorithms have been designed to discover periodic patterns in such databases, such as PFP-Tree, MKTPP, ITL-Tree, PF-tree, and MaxCPF algorithms. For these algorithms, a pattern is said to be periodic, if: (1) it appears in at least minsup transactions, where minsup is a number of transactions set by the user, (2) and the pattern has no period of length greater than a maxPer parameter also set by the user.
Thus, according to this definition if we consider minsup = 3 and maxPer =2, the itemset {a,c} is said to be periodic because it has no period of length greater than 2 transactions, and it appears in at least 3 transactions.
This definition of a periodic pattern is, however, too strict. I will explain why with an example. Assume that maxPer is set to 3 transactions. Now, consider that a pattern appears every two transactions many times but that only once it appears after 4 transactions. Because the pattern has a single period greater than maxPer, this pattern would be automatically be deemed as non periodic although it is in general periodic. Thus, this definition is too strict.
Thus, in a 2016 paper, we proposed a solution to this issue. We introduced two new measures called the average periodicity and the minimum periodicity. The idea is that we should not discard a pattern if it has a single period that is too large but should instead look at how periodic the pattern is on average. The designed algorithm is called PFPM and the search procedure is inspired by the ECLAT algorithm. PFPM discovers periodic patterns using a more flexible definition of what is a periodic pattern. A pattern is said to be periodic pattern if: (1) the average length of its periods denoted as avgper(X) is not less than a parameter minAvg and not greater than a parameter maxAvg. (2) the pattern has no period greater than a maximum maxPer. (3) the pattern has no period smaller than a minimum minPer.
This definition of a periodic pattern is more flexible than the previous definition and thus let the user better select the periodic patters to be found. The user can set the minimum and maximum average as the main constraints for finding periodic patterns and use the minimum and maximum as loose constraints to filter patterns having periods that vary too widely.
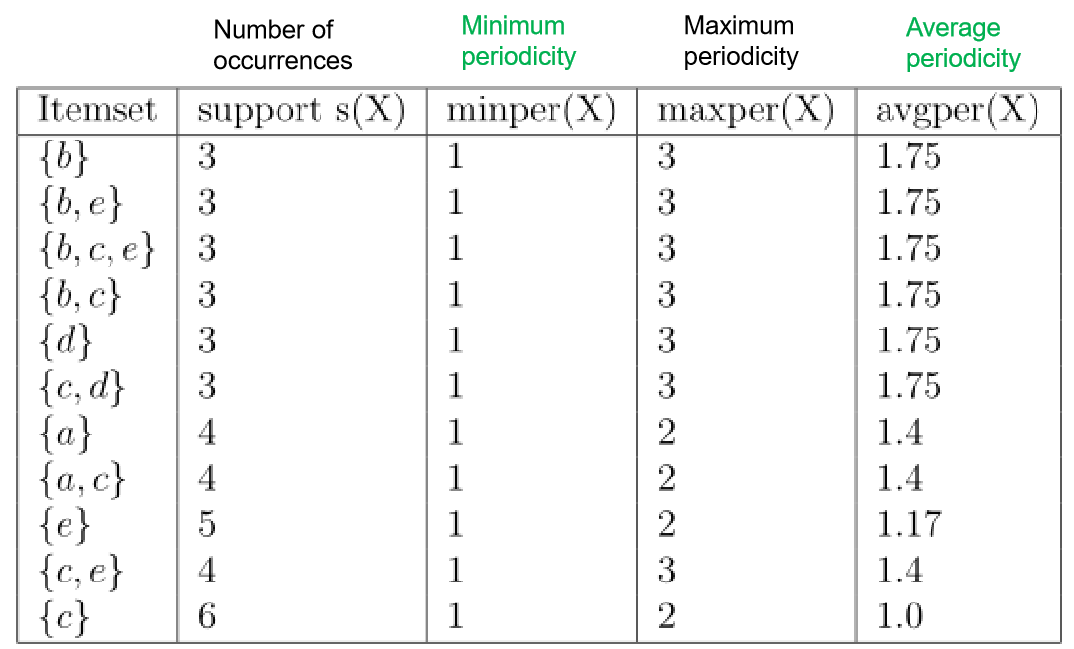
Based on the above definition of periodic patterns, the problem of mining all periodic patternsin a database is to find all periodic patterns that satisfy the constraints set by the user. For example, if minPer = 1, maxPer = 3, minAvg = 1, and maxAvg = 2, the 11 periodic patterns found in the example database are the one shown in the table below. This table indicates the measures of support (frequency), minimum, average and maximum periodicity for each pattern found:
As it can be observed in this example, the average periodicity can give a better view of how periodic a pattern is. For example, considers the patterns {a,c} and {e}. Both of these patterns have a largest period of 2 (called the maximum periodicity), and would be considered as equally periodic using the standard definition of a periodic pattern. But the average periodicity of these two patterns is quite different. The average periodicity measure indicates that on average {a,c} appears with a period of 1.4 transactions, while {e} appears on average with a period of 1.17 transaction.
Discovering periodic patterns using the SPMF open-source data mining library
An implementation of the PFPM algorithm for discovering periodic patterns, and its source code, can be found in the SPMF data mining software. This software allows to run the PFPM algorithm from a command line or graphical interface. Moreover, the software can be used as a library and the source code is also provided under the GPL3 license. For the example discussed in this blog post, the input database is a text file encoded as follows:
3 153 5 1 2 43 5 2 43 1 43 5 13 5 2
where the numbers 1,2,3,4,5 represents the letters a,b,c,d,e. To run the algorithm from the source code, the following lines of code need to be used:
String output = "output.txt";
String input = "contextPFPM.txt";
int minPeriodicity = 1;
int maxPeriodicity = 3;
int minAveragePeriodicity = 1;
int maxAveragePeriodicity = 2;
// Applying the algorithm
AlgoPFPM algorithm = new AlgoPFPM();
algorithm.runAlgorithm("input.txt", "output.txt", minPeriodicity, maxPeriodicity, minAveragePeriodicity, maxAveragePeriodicity);
The output is then a file containing all the periodic patterns shown in the table.
For example, the eighth line represents the pattern {a,c}. It indicates that this pattern appears in four transactions, that the smallest and largest periods of this pattern are respectively 1 and 2 transactions, and that this pattern has an average periodicity of 1.4 transactions.
SPMF also offers many other algorithms for periodic pattern mining. This includes algorithms for many variations of the problem of periodic pattern mining.
Related problems
There also exist extensions of the problem of discovering periodic patterns. For example, another algorithm offered in the SPMF library is called PHM. It is designed to discover “periodic high-utility itemsets” in customer transaction databases. The goal is not only to find patterns that appear periodically, but also to discover the patterns that yields a high profit in terms of sales.
Another related problem is to find stable periodic patterns. A periodic pattern is said to be stable if its periods are generally more or less the same over time. The SPP-Growth and TSPIN algorithms were designed for this problem.
Another related problem is to find periodic patterns in multiple sequences of transactions instead of a single one. For example, one may want to find patterns that are periodic not only for one customer but periodic for many customers in a store.
Another topic is to find patterns that are locally periodic. This means that a pattern may not always be periodic. Thus the goal is to find patterns and the intervals of time where they are periodic.
If you want to know more about periodic pattern mining, you can watch some videos lectures that I have recorded on this topic, that are easy to understand. They are available on my website:
Also, you can find more videos on my Youtube channel. And if you want to know more about periodic pattern mining in general, you can also check my free online pattern mining course, which covers many other related topics.
Conclusion
In this blog post, I have introduced the problem of discovering periodic patterns in databases. I have also explained how to use open-source software to discover periodic patterns. Mining periodic patterns is a general problem that may have many applications.
There are also many research opportunities related to periodic patterns, as this subject as not been extensively studied. For example, some possibility could be to transform the proposed algorithms into an incremental algorithm, a fuzzy algorithm, or to discover more complex types of periodic patterns such as periodic sequential rules.
Also, in this blog post, I have not discussed about time series (sequences of numbers). It is also another interesting problem to discover periodic patterns in time series, which requires different types of algorithms.
== Philippe Fournier-Vigeris a full professor and the founder of theopen-source data mining software SPMF,offering more than 110 data mining algorithms. If you like this blog, you can tweet about it and/or subscribe to my twitter account @philfv to get notified about new posts.
In this blog post, I will give an introduction to the task of sequence prediction, a popular data mining/machine learning task, which consist of predicting the next symbol of a sequence of symbols. This task is important as it have many real-life applications such as webpage prefetching and product recommendation.
What is a sequence?
Before defining the problem of sequence prediction, it is necessary to first explain what is a sequence. A sequence is an ordered list of symbols. For example, here are some common types of sequences:
A sequence of webpages visited by a user, ordered by the time of access.
A sequence of words or characters typed on a cellphone by a user, or in a text such as a book.
A sequence of products bought by a customer in a retail store
A sequence of proteins in bioinformatics
A sequence of symptoms observed on a patient at a hospital
Note that in the above definition, we consider that a sequence is a list of symbols and do not contain numeric values. A sequence of numeric values is usually called a time-series rather than a sequence, and the task of predicting a time-series is called time-series forecasting. But this is another topic.
What is sequence prediction?
The task of sequence prediction consists of predicting the next symbol of a sequence based on the previously observed symbols. For example, if a user has visited some webpages A, B, C, in that order, one may want to predict what is the next webpage that will be visited by that user to prefetch the webpage.
An illustration of the problem of sequence prediction
There are two steps to perform sequence prediction:
First, one must train a sequence prediction model using some previously seen sequences called the training sequences. This process is illustrated below:
For example, one could train a sequence prediction model for webpage prediction using the sequences of webpages visited by several users.
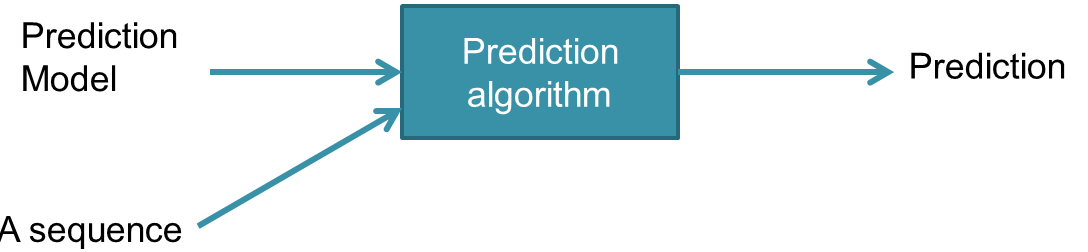
The second step is to use a trained sequence prediction model to perform prediction for new sequences (i.e. predict the next symbol of a new sequence), as illustrated below.
For example, using a prediction model trained with the sequences of webpages visited by several users, one may predict the next webpage visited by a new user.
An overview of state-of-the-art sequence prediction models
Having defined what are the main sequence prediction models, that could be used in an application?
There are actually numerous models that have been proposed by researchers such as DG, All-k-order Markov, TDAG, PPM, CPT and CPT+. These models utilize various approaches. Some of them uses for example neural networks, pattern mining and a probabilistic approach.
How to determine if a sequence prediction model is good?
Various sequence prediction models have different advantages and limitations, and may perform more or less well on different types of data. Typically a sequence prediction model is evaluated in terms of criteria such as prediction accuracy, the memory that it uses and the execution time for training and performing predictions.
In this benchmark, we compare our proposed CPT+ sequence prediction model with several state-of-the-art models on various types of data. Briefly, BMS, MSNBC, Kosarak and Fifa are sequences of webpages. SIGN is a sign-language dataset. Bible word and Bible char are datasets of sequences of Words and characters. As it can be seen, for this type of data at least, CPT+ greatly outperform other models. There are several reasons. One of them is that several models such as DG assume the Markovian hypothesis that the next symbol only depends on the previous symbols. Another reason is that the CPT+ model use an efficient indexing approach to consider all the relevant data for each prediction (see details in the paper).
Where can I get open-source implementations of sequence prediction models?
Some open-source and Java implementation of the seven discussed sequence prediction models (DG, AKOM, TDAG, LZ78, PPM, CPT, CPT+) can be found in the SPMF open-source data mining library, which includes the implementations from the IPredict project.
There are extensive documentation about how to use these models on the SPMF website. Here I will provide a quick example that shows how the CPT model can be easily applied with just a few lines of code.
// Phase 1: Training
// Load a file containing the training sequences into memory
SequenceDatabase trainingSet = new SequenceDatabase();
trainingSet.loadFileSPMFFormat("training_sequences.txt", Integer.MAX_VALUE, 0, Integer.MAX_VALUE);
// Train the prediction model
String optionalParameters = "splitLength:6 recursiveDividerMin:1 recursiveDividerMax:5";
CPTPredictor predictionModel = new CPTPredictor("CPT", optionalParameters);
predictionModel.Train(trainingSet.getSequences());
// Phase 2: Sequence prediction
// We will predict the next symbol after the sequence <1,4>
Sequence sequence = new Sequence(0);
sequence.addItem(new Item(1));
sequence.addItem(new Item(4));
Sequence thePrediction = predictionModel.Predict(sequence);
System.out.println("For the sequence <(1),(4)>, the prediction for the next symbol is: +" + thePrediction);
Thus, without going into the details of each prediction models, it can be seen that it is very easy to train a sequence prediction model and use it to perform predictions.
Conclusion
This blog post has introduced the task of sequence prediction, which has many applications. Furthermore, implementations of open-source sequence prediction models have been presented.
== Philippe Fournier-Vigeris a full professor and the founder of theopen-source data mining software SPMF,offering more than 110 data mining algorithms. If you like this blog, you can tweet about it and/or subscribe to my twitter account @philfv to get notified about new posts.
Today, I will discuss how to become a good researcher and what are the most important skills that a researcher should have. This blog post is aimed at young Master degree students and Ph.D students, to provide some useful advice to them.
1) Being humble and open to criticism
An important skill to be a good researcher is to be humble and to be able to listen to others. Even when a researcher works very hard and think that his/her project is “perfect”, there are always some flaws or some possibilities for improvement.
A humble researcher will listen to the feedback and opinions of other researchers on their work, whether this feedback is positive or negative, and will think about how to use this feedback to improve their work. A researcher that works alone can do an excellent work. But by discussing research with others, it is possible to get some new ideas. Also, when a researcher present his/her work to others, it is possible to better understand how people will view your work. For example, it is possible that other people will misunderstand your work because something is unclear. Thus, the researcher may need to make adjustments to his research project.
2) Building a social network
A second important thing to work on for young researchers is to try to build a social network. If a researcher has opportunities to attend international conferences, s/he should try to meet other students/professors to establish contact with other researchers. Other ways of establishing contact with other researchers are to send e-mails to ask questions or discuss research, or it could also be at a regional or national level by attending seminars at other universities.
Building a social network is very important as it can create many opportunities for collaborations. Besides, it can be useful to obtain a Ph.D position at another university (or abroad), a post-doctoral research position or even a lecturer position or professor position in the future, or to obtain some other benefits such as being invited to give a talk at another university or being part of the program committee of conferences and workshops. A young researcher has to often work by herself/himself. But he should also try to connect with other researchers.
For example, during my Ph.D. in Canada, I established contact with some researchers in Taiwan, and I then applied there for doing my postdoc. Then, I used some other contacts recently to find a professor position in China, where I then applied and got the job. Also, I have done many collaborations with other researchers that I have met at conferences.
3) Working hard, working smart
To become a good researcher, another important skill is to spend enough time on your project. In other words, a successful researcher will work hard. For example, it is quite common that good researchers will work more than 10 hours a day. But of course, it is not just about working hard, but also about working “smart”, that is a researcher should spend each minute of his time to do something useful that will make him/her advance toward his goals. Thus, working hard should be done also with a good planning.
When I was a MSc and Ph.D. student, I could easily work more than 12 hours a day. Sometimes, I would only take a few days off during the whole year. Currently, I still work very hard every day but I have to take a little it more time off due to having a family. However, I have gained in efficiency. Thus, even by working a bit less, I can be much more productive than I was a few years ago.
4) Having clear goals / being organized / having a good research plan
A researcher should also have clear goals. For a Ph.D or MSc student, this includes having a general goal of completing the thesis, but also some subgoals or milestones to attain his main goal. One should also try to set dates for achieving these goals. In particular, a student should also think about planning their work in terms of deadlines for conferences. It is not always easy to plan well. But it is a skill that one should try to develop. Finally, one should also choose his research topic(s) well to work on meaningful topics that will lead to making a good research contribution.
5) Stepping out of the comfort zone
A young researcher should not be afraid to step out of his comfort zone. This includes trying to meet other researchers, trying to establish collaborations with other researchers, trying to learn new ideas or explore new and difficult topics, and also to study abroad.
For example, after finishing my Ph.D. in Canada, which was mostly related to e-learning, I decided to work on the design of fundamental data mining algorithms for my post-doctoral studies and to do this in Taiwan in a data mining lab. This was a major change both in terms of research area but also in terms of country. This has helped me to build some new connections and also to work in a more popular research area, to have more chance of obtaining a professor position, thereafter. This was risky, but I successfully made the transition. Then, after my postdoc I got a professor job in Canada in a university far away from my hometown. This was a compromise that I had to make to be able to get a professor position since there are very few professor positions available in Canada (maybe only 5 that I could apply for every year). Then, after working as a professor for 4 years in Canada, I decided to take another major step out of my comfort zone by selling my house and accepting a professor job at a top 9 university in China. This last move was very risky as I quit my good job in Canada where I was going to become permanent. Moreover, I did that before I actually signed the papers for my job in China. And also from a financial perspective I lost more than 20,000 $ by selling my house quickly to move out. However, the move to China has paid off, as in the next months, I got selected by a national program for young talents in China. Thus, I now receive about 10 times the funding that I had in Canada for my research, and my salary is more than twice my salary as a professor in Canada, thus covering all the money that I had lost by selling my house. Besides, I have been promoted to full professor and will lead a research center. This is an example of how one can create opportunities in his career by taking risks.
6) Having good writing skills
A young researcher should also try to improve his writing skills. This is very important for all researchers, because a researcher will have to write many publications during his career. Every minute that one spends on improving writing skills will pay off sooner or later.
In terms of writing skills, there are two types of skills.
First, one should be good at writing in English without grammar and spelling errors.
Second, one should be able to organize his ideas clearly and write a well-organized paper (no matter if it is written in English or another language). For a student, is important to work to improve these two skills during their MSc and Ph.D studies.
These skills are acquired by writing and reading papers, and spending the time to improve yourself when writing (for example by reading the grammar rules when unsure about grammar).
Personally, I am not a native English speaker. I have thus worked hard during my graduate studies to improve my English writing skills.
Conclusion
In this brief blog post, I gave some general advice about important skills for becoming a successful researcher. I you think that I have forgotten something, please post it as a comment below.
== Philippe Fournier-Vigeris a full professor and the founder of theopen-source data mining software SPMF,offering more than 110 data mining algorithms. If you like this blog, you can tweet about it and/or subscribe to my twitter account @philfv to get notified about new posts.
In recent months/years, many blog posts have been trending on the social Web aboutwhat is a “data scientist“, as this term has become very popular. As there is much hype about this term, some people have even jokingly said that a “data scientist is a statistician who lives in San Francisco“.
In this blog post, I will talk about this recent discussion about what is a data scientist, which has led some people to claim that there is some easy signs to recognize a bad data scientist or a fake data scientist. In particular, I will discuss the blog post “10 signs of a bad data scientists” and explain why this discussion is going the wrong way.
10 signs of a bad data scientists In this blog post, authors claim that a data scientists must be good a math/statistics, good at coding, good at business, and know most of the tools from Spark, Scala, Pyhthon, SAS to Matlab.
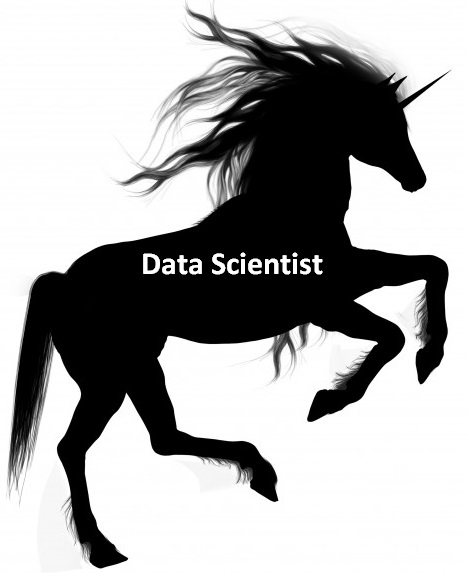
What is wrong with this? The obvious is that it is not really necessary to know all these technologies to analyze data. For example, a person may never have to use Spark to analyze data and will rarely use all these technologies in the same environment. But more importantly, this blog post seems to imply that a single person should replace a team of three persons: (1) acoderwith data mining experience, (2) astatistician, and (3) someonegood at business. Do we really need to have a person that can replace these three persons? The problem with this idea is that a person will always be stronger on one of these three dimensions and weaker on the two other dimensions. Having a person that possess skills in these three dimensions, and is also excellent in these three dimensions is quite rare. Hence, I here call it the data scientist unicorn,that is a person that is so skilled that he can replace a whole team.
The data scientist unicorn
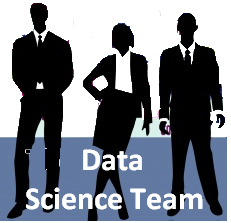
In my opinion, instead of thinking about finding that unicorn, the discussion should rather be aboutcreating a good data science team, consisting of the three appropriate persons that are respectively good at statistics, computer sciences, and business, and also have a little background/experience to be able to discuss with the other team members. Thus, perhaps that we should move the discussion from what is a gooddata scientistto what is a gooddata science team.
A data science team
An example
I will now discuss my case as an example to illustrate the above point that I am trying to make. I am a researcher in data mining. I have a background in computer science and I have worked for 8 years on designing highly efficient data mining algorithms to analyze data. I am very good at this, ( I am even the founder of the popular Java SPMF data mining library). But I am less good at statistics, and I have almost no knowledge about business.
But this is fine because I am an expert at what I am doing, in one of these three dimensions, and I can still collaborate with a statistician or someone good at business, when I need. I should not replace a statistician. And it would be wrong to ask a statistician to do my job of designing highly efficient algorithms, as it requires many years of programming experience and excellent knowledge of algorithmic .
A risk with the vision of the “data scientist unicorn” that is good at everything is that it may imply that the person may not be an expert at any of those things.
Perhaps that a solution for training good data scientist is those new “data science” degrees that aim at teaching a little bit of everything. I would not say whether these degrees are good or not, as I did not look at these programs. But there is always the risk of training people who can do everything but are not expert at anything. Thus, why not trying to instead build a strong data science team?
==
Philippe Fournier-Vigeris a full professor and also the founder of theopen-source data mining software SPMF,offering more than 110 data mining algorithms.
If you like this blog, you can tweet about it and/or subscribe to my twitter account @philfv to get notified about new posts.
Last week, I have attended the ACM SAC 2016 conference (31st ACM Symposium on Applied Computing). It was held in Pisa, Italy from the 4th to the 8th April 2016. In this blog post, I will briefly discuss this conference.
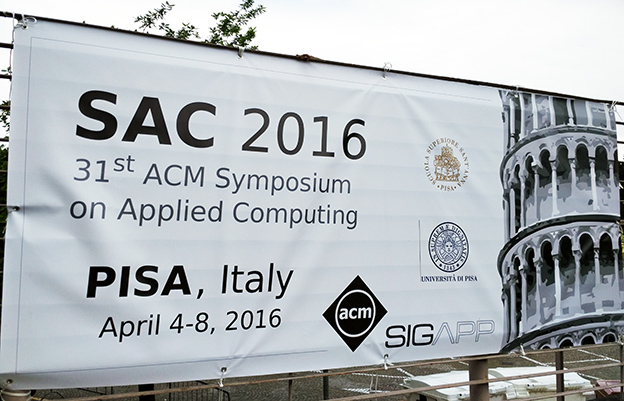
ACM SAC 2016
About the SAC conference
It is not the first time that I attend the SAC conference. I had papers published in this conference in 2011, 2013, 2015 and now 2016. This conference is a conference where it is possible to submit papers in multiple tracks, where each track has its own topic. The topics are quite varied ranging from programming languages, to intelligent virtual learning environment to data mining. Personally, I am particularly in the data mining and data stream tracks, which are somewhat competitive and publish some high quality papers. Last year, for example, the acceptance rate of the data mining track for full papers was about 20 %.
One may think that a drawback of this conference is that it is not as specialized as a conference on data mining, for example. However, it is also possible to see this as advantage, as it is allows to talk and exchange ideas with people from other fields. Also, an interesting aspect of this conference is that it is friendly toward research with applications (hence the name “symposium on applied computing”).
Also, this conference is a good place for meeting European researchers, as it was held in Europe. But it was quite international, with a great number of people coming from other continents. I have also had good discussions with some well-known researcher.
Finally, another good thing about this conference is that it is published by the ACM and the proceedings are indexe by DBLP and other important indexes in computer science.
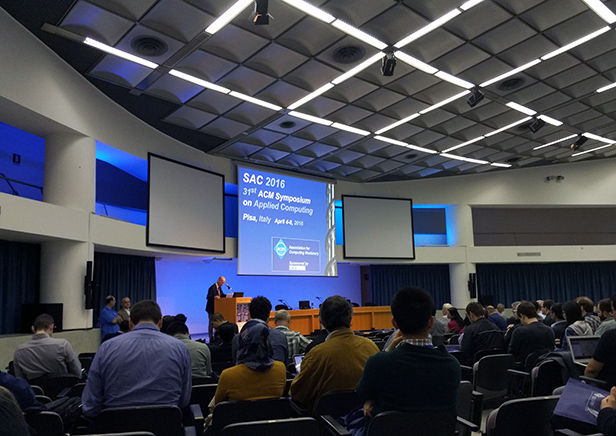
SAC 2016 – Opening
About the organization
The conference was well-organized in general. There might always be something to complain about. But in general the organizers did a very good job, as well as the student volunteers.
The location was also quite good. Italy has good weather and the people were friendly. Even had the occasion to take a few pictures with the leaning Pisa tower.
The data mining track
I have attended most of the talks from the data mining track. The main topics were: clustering, scalable algorithms for big data, graph sampling, associative classifiers, classification, itemset mining, and vizualization.
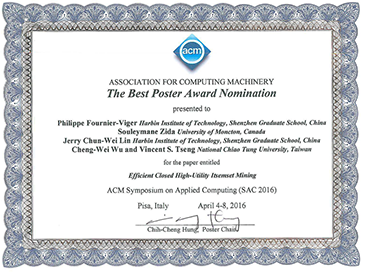
Me and my colleagues have presented two papers respectively on (1) a new algorithm for mining recent weighted frequent itemsets, and (2) a new efficient algorithm for mining closed high utility itemsets named EFIM-Closed. For that later paper, I have received a nomination for the best poster award.
Nomination for the best poster award for the EFIM-Closed algorithm at SAC 2016
SAC 2017 conference
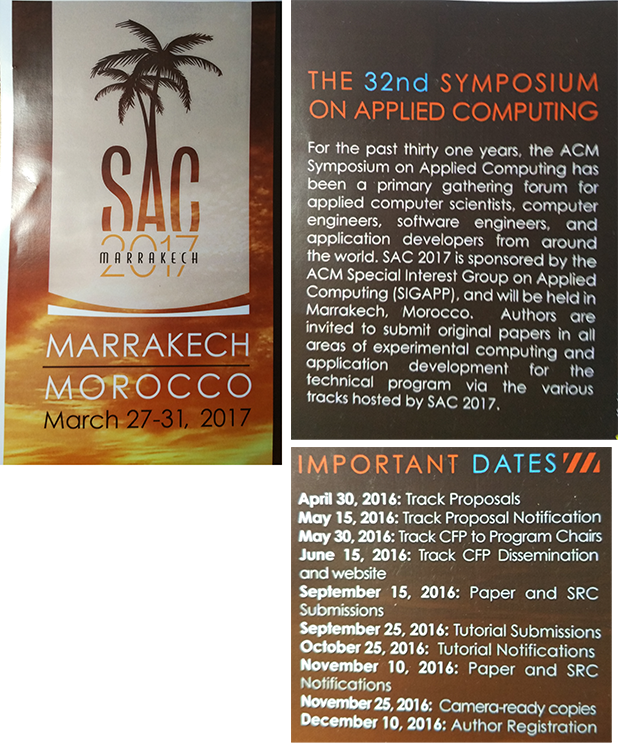
It was announced that the SAC 2017 conference will be held in Marrakech, Morocco, March 27 – 31, 2017. It may be very interesting to attend this conference next year, for the reasons above, but also for the location, as there are not so often some big international conferences in Morocco.
ACM SAC 2017 conference
That is all for day (it was just intended to be a short blog post)!
==
Philippe Fournier-Viger is a full professor and also the founder of the open-source data mining software SPMF, offering more than 110 data mining algorithms.
If you like this blog, you can tweet about it and/or subscribe to my twitter account @philfv to get notified about new posts.
First, this month I have made a few updates toSPMF. Two new algorithms have been added: USpan (for high-utility sequential pattern mining) and FCHM (for correlated high utility itemset mining). Moreover, I have fixed a few bugs, and also added a new window for visualizing the patterns found. Hope you will enjoy that new version of SPMF.
Second , this week I have read a nice blog post from a user of SPMF that I would like to share with you. The title is: “Sequential pattern mining, the initial attempts” from the Gigantic Data blog by Ryan Panos. You may want to read it.
==
Philippe Fournier-Viger is a professor of Computer Science and also the founder of the open-source data mining software SPMF, offering more than 110 data mining algorithms.
This blog post is to let you know that I have just published a new version of the SPMF open-source Java data mining library (0.98) that offers a new window for visualizing the patterns found by data mining algorithms. This window should be more convenient to use than the text editor for visualizing results as it offers sorting and filtering functions. Here is a picture:
This window is specifically designed for visualizing patterns found by pattern mining algorithms. But it also work with some algorithms such as clustering algorithms, also offered in SPMF.
How to access this new window? This window can be accessed when using the graphical interface of SPMF by selecting the checkbox “Open output file” “using SPMF viewer“. The new window show the patterns found by an algorithm in a table, and it let the user apply some filters to select patterns or to sort the patterns by ascending or descending orders using various measures such as support and confidence (depending on the algorithms) by clicking on the column headers.
This window for visualizing patterns should work with most algorithms offered in SPMF. If you find some bugs related to this new window for visualizing results, you may let me know. Also, if you have some ideas to improve, or want to participate to improve the user interface of SPMF, you may let me know.
Hope you will like it! Also, thanks again to all users of SPMF for your support.
==
Philippe Fournier-Viger is a professor and also the founder of the open-source data mining software SPMF, offering more than 100 data mining algorithms. Follow me on Twitter: @philfv
Recently I have submitted a few papers to the ADMA 2015 conference (11th conference on Advanced Data Mining and Applications, which was supposed to be held at Fudan university, China inJanuary2016 (despite being named 2015).
The website of ADMA 2015 conference ( http://adma2015.fudan.edu.cn ) has been online since the end of October.
The ADMA 2015 conference website
I had submitted two data mining papers to the conference using their EasyChair website, and some colleagues of mine also submitted papers:
ADMA2015 easychair
According to the website, the deadline notification of the ADMA 2015 conference is supposed to be the 1st October. I sent an e-mail to the organizers on the 24th September to ask about the deadline and they replied that there would be at least a two weeks deadline extension.
Email from the ADMA 2015 conference organizers
Then, the time passed and I did not receive any notification about the fate of my papers.
I have thus sent e-mails to the organizers (on the 28th October, 10th November, and 17th November) to ask when we would get the notification for our papers. But the organizers of the ADMA 2015 conference did not answer any e-mails from me or my colleagues. I have tried the official e-mail address of the conference 11thadma@fudan.edu.cn and also directly the e-mail of the organizer. But no answer.
Now, we are the 30th November, and it seems that the website of the ADMA 2015 conference has been taken down.
I thus have to conclude that the conference has most likely been cancelled. But why? And why not answering the e-mails, or letting us know ?
It is a pity because I actually enjoyed the previous ADMA conferences.
If I receive further news about what is happening, I will update the blog post. Hopefully, we will know soon what is happening with the papers that have been submitted.
Update in January 2016: It is clear that the conference has been cancelled, although the organizers never bothered to inform the authors or answer their e-mails about the status of the conference. This is really unprofessional.
Update in 2017: After the failed ADMA 2015 conference, the ADMA conference has been back in 2016 with a conference in Australia. That conference was not organized by the organizers of the failed ADMA 2015 conference, and has been a success to my knowledge. So I am looking forward to ADMA 2017. It is also interesting that the website of the failed ADMA 2015 conference is suddenly back online: http://ndbc2011.fudan.edu.cn/