
Recently, I have analysed trends about visitors on this blog. I have made two observations. First, there is about 500 to 1000 visitors per day. For this, I want to thank you all for reading and commenting on the blog. Second, if we look carefully at the number of visitors per day, it becomes a time series, and we can clearly see some patterns that is repeating itself every week. Below is a picture of this time series for January 2018.
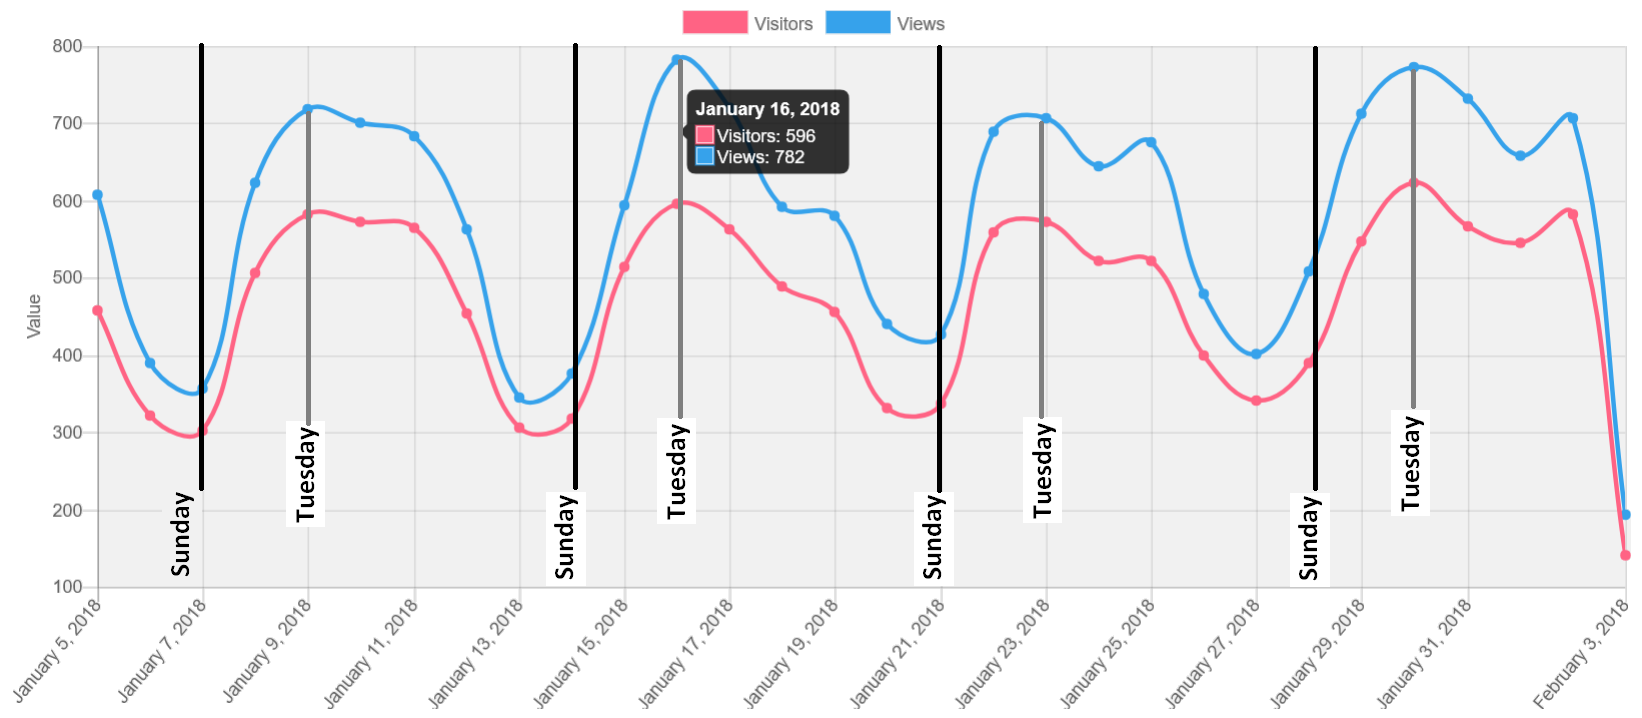
As you can see, there is a clear pattern every week. Toward the beginning of the week on Monday and Tuesday, the number of visitor increases, while around Friday it starts to decrease. Finally, on Saturday and Sunday, there is a considerable decrease, and then it increases again on Monday. This pattern is repeating itself every week. We can see it visually, but such patterns could be detected using time series analysis techniques such as an autocorrelation plot. Besides, it would be easy to predict this time series using time series forecasting models.
We can also see a relationship with the concept of periodic patterns that I have previously discussed in this blog. A periodic pattern is pattern that is always repeating itself over time. That is all for today. I just wanted to shared this interesting finding.
—
Philippe Fournier-Viger is a professor of Computer Science and also the founder of the open-source data mining software SPMF, offering more than 150 data mining algorithms.


