In this blog post I will give an introduction to the discovery of periodic patterns in data. Mining periodic patterns is an important data mining task as patterns may periodically appear in all kinds of data, and it may be desirable to find them to understand data for taking strategic decisions.

For example, consider customer transactions made in retail stores. Analyzing the behavior of customers may reveal that some customers have periodic behaviors such as buying some products every week-end such as wine and cheese. Discovering these patterns may be useful to promote products on week-ends, or take other marketing decisions.
Another application of periodic pattern mining is stock market analysis. One may analyze the price fluctuations of stocks to uncover periodic changes in the market. For example, the stock price of a company may follow some patterns every month before it pays its dividend to its shareholders, or before the end of the year.
In the following paragraph, I will first present the problem of discovering frequent periodic patterns, periodic patterns that appear frequently. Then, I will discuss an extension of the problem called periodic high-utility pattern mining that aims at discovering profitable patterns that are periodic. Moreover, I will present open-source implementations of popular algorithms such as PFPM and PHM for mining periodic patterns.
The problem of mining frequent periodic patterns
The problem of discovering periodic patterns can be generally defined as follows. Consider a database of transactions depicted below. Each transaction is a set of items (symbols), and transactions are ordered by their time.
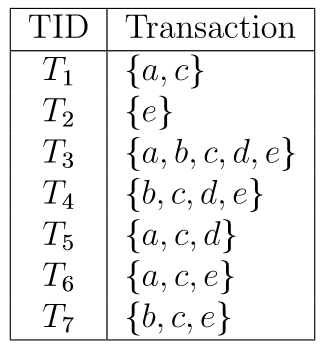
Here, the database contains seven transactions labeled T1 to T7. This database format can be used to represent all kind of data. However, for our example, assume that it is a database of customer transactions in a retail store. The first transaction represents that a customer has bought the items a and c together. For example, a could mean an apple, and c could mean cereals.
Having such a database of objects or transactions, it is possible to find periodic patterns. The concept of periodic patterns is based on the notion of period.
A period is the time elapsed between two occurrences of a pattern. It can be counted in terms of time, or in terms of a number of transactions. In the following, we will count the length of periods in terms of number of transactions. For example, consider the itemsets (set of items) {a,c}. This itemset has five periods illustrated below. The number that is used to annotate each period is the period length calculated as a number of transactions.
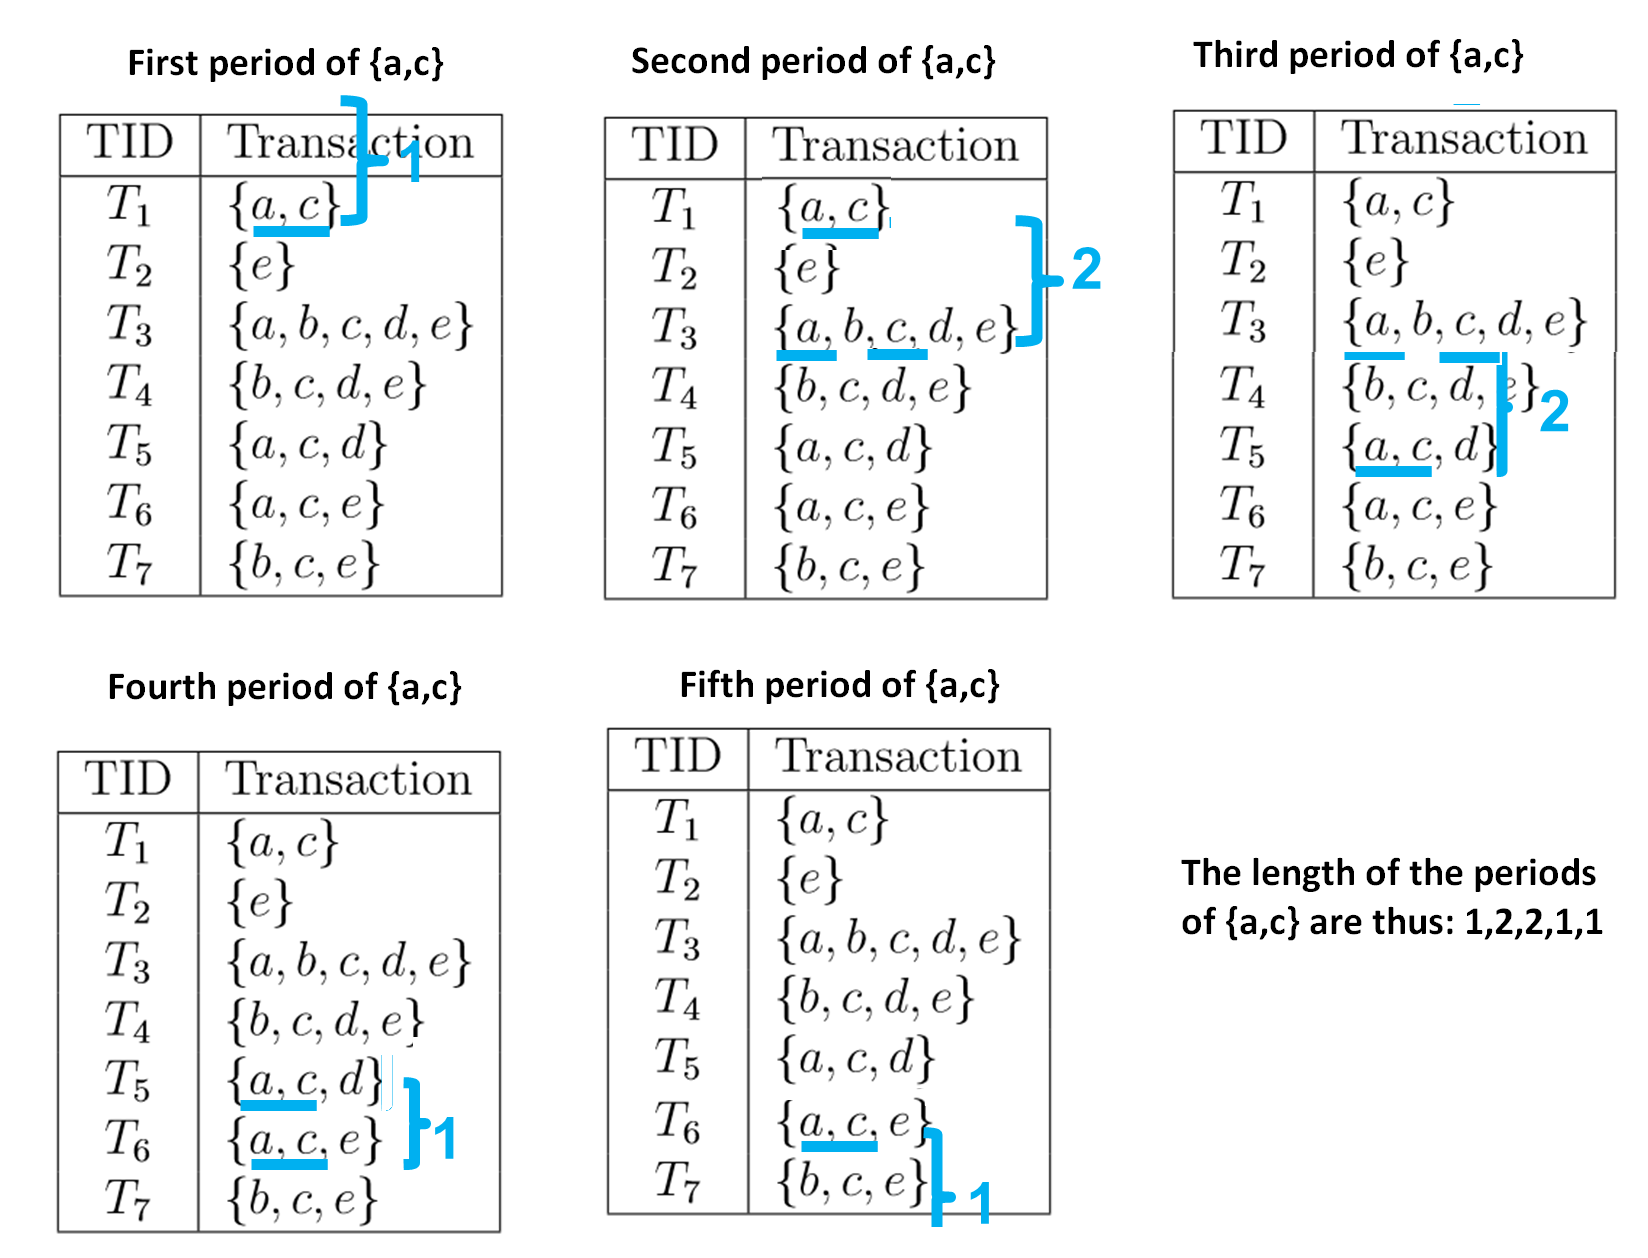
The first period of {a,c} is what appeared before the first occurrence of {a,c}. By definition, if {a,c} appears in the first transaction of the database, it is assumed that this period has a length of 1.
The second period of {a,c} is the gap between the first and second occurrences of {a,c}. The first occurrence is in transaction T1 and the second occurrence is in transaction T3. Thus, the length of this period is said to be 3 – 1 = 2 transactions.
The third period of {a,c} is the gap between the second and third occurrences of {a,c}. The second occurrence is in transaction T3 and the third occurrence is in transaction T5. Thus, the length of this period is said to be 5 – 3 = 2 transactions.
The fourth period of {a,c} is the gap between the third and fourth occurrences of {a,c}. The third occurrence is in transaction T5 and the fourth occurrence is in transaction T6. Thus, the length of this period is said to be 6 – 5 =1 transactions.
Now, the fifth period is interesting. It is defined as the time elapsed between the last occurrence of {a,c} (in T6) and the last transaction in the database, which is T7. Thus, the length of this period is also 7 – 6 = 1 transaction.
Thus, in this example, the list of period lengths of the pattern {a,c} is: 1,2,2,1,1.
Several algorithms have been designed to discover periodic patterns in such databases, such as PFP-Tree, MKTPP, ITL-Tree, PF-tree, and MaxCPF algorithms. For these algorithms, a pattern is said to be periodic, if:
(1) it appears in at least minsup transactions, where minsup is a number of transactions set by the user,
(2) and the pattern has no period of length greater than a maxPer parameter also set by the user.
Thus, according to this definition if we consider minsup = 3 and maxPer =2, the itemset {a,c} is said to be periodic because it has no period of length greater than 2 transactions, and it appears in at least 3 transactions.
This definition of a periodic pattern is, however, too strict. I will explain why with an example. Assume that maxPer is set to 3 transactions. Now, consider that a pattern appears every two transactions many times but that only once it appears after 4 transactions. Because the pattern has a single period greater than maxPer, this pattern would be automatically be deemed as non periodic although it is in general periodic. Thus, this definition is too strict.
Thus, in a 2016 paper, we proposed a solution to this issue. We introduced two new measures called the average periodicity and the minimum periodicity. The idea is that we should not discard a pattern if it has a single period that is too large but should instead look at how periodic the pattern is on average. The designed algorithm is called PFPM and the search procedure is inspired by the ECLAT algorithm. PFPM discovers periodic patterns using a more flexible definition of what is a periodic pattern. A pattern is said to be periodic pattern if:
(1) the average length of its periods denoted as avgper(X) is not less than a parameter minAvg and not greater than a parameter maxAvg.
(2) the pattern has no period greater than a maximum maxPer.
(3) the pattern has no period smaller than a minimum minPer.
This definition of a periodic pattern is more flexible than the previous definition and thus let the user better select the periodic patters to be found. The user can set the minimum and maximum average as the main constraints for finding periodic patterns and use the minimum and maximum as loose constraints to filter patterns having periods that vary too widely.
Based on the above definition of periodic patterns, the problem of mining all periodic patterns in a database is to find all periodic patterns that satisfy the constraints set by the user. For example, if minPer = 1, maxPer = 3, minAvg = 1, and maxAvg = 2, the 11 periodic patterns found in the example database are the one shown in the table below. This table indicates the measures of support (frequency), minimum, average and maximum periodicity for each pattern found:
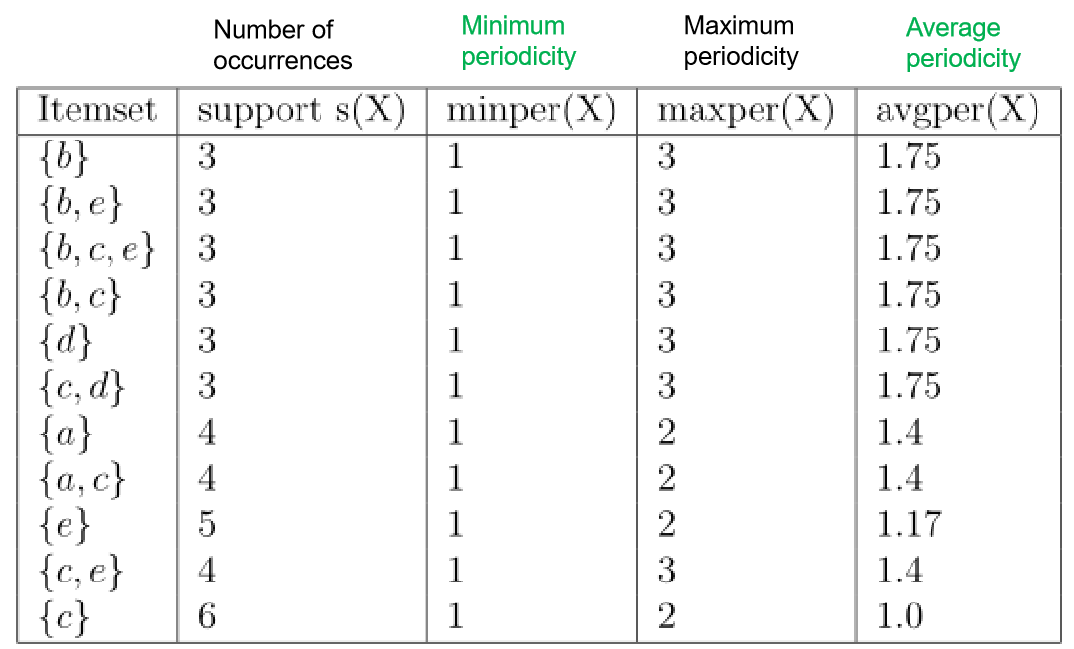
As it can be observed in this example, the average periodicity can give a better view of how periodic a pattern is. For example, considers the patterns {a,c} and {e}. Both of these patterns have a largest period of 2 (called the maximum periodicity), and would be considered as equally periodic using the standard definition of a periodic pattern. But the average periodicity of these two patterns is quite different. The average periodicity measure indicates that on average {a,c} appears with a period of 1.4 transactions, while {e} appears on average with a period of 1.17 transaction.
Discovering periodic patterns using the SPMF open-source data mining library
An implementation of the PFPM algorithm for discovering periodic patterns, and its source code, can be found in the SPMF data mining software. This software allows to run the PFPM algorithm from a command line or graphical interface. Moreover, the software can be used as a library and the source code is also provided under the GPL3 license. For the example discussed in this blog post, the input database is a text file encoded as follows:
3 1
5
3 5 1 2 4
3 5 2 4
3 1 4
3 5 1
3 5 2
where the numbers 1,2,3,4,5 represents the letters a,b,c,d,e. To run the algorithm from the source code, the following lines of code need to be used:
String output = "output.txt";
 String input = "contextPFPM.txt";
 int minPeriodicity = 1;
 int maxPeriodicity = 3;
 int minAveragePeriodicity = 1;
 int maxAveragePeriodicity = 2;

// Applying the algorithm
 AlgoPFPM algorithm = new AlgoPFPM();
 algorithm.runAlgorithm("input.txt", "output.txt",  minPeriodicity, maxPeriodicity, minAveragePeriodicity, maxAveragePeriodicity);
The output is then a file containing all the periodic patterns shown in the table.
2 #SUP: 3 #MINPER: 1 #MAXPER: 3 #AVGPER: 1.75
2 5 #SUP: 3 #MINPER: 1 #MAXPER: 3 #AVGPER: 1.75
2 5 3 #SUP: 3 #MINPER: 1 #MAXPER: 3 #AVGPER: 1.75
2 3 #SUP: 3 #MINPER: 1 #MAXPER: 3 #AVGPER: 1.75
4 #SUP: 3 #MINPER: 1 #MAXPER: 3 #AVGPER: 1.75
4 3 #SUP: 3 #MINPER: 1 #MAXPER: 3 #AVGPER: 1.75
1 #SUP: 4 #MINPER: 1 #MAXPER: 2 #AVGPER: 1.4
1 3 #SUP: 4 #MINPER: 1 #MAXPER: 2 #AVGPER: 1.4
5 #SUP: 5 #MINPER: 1 #MAXPER: 2 #AVGPER: 1.1666666666666667
5 3 #SUP: 4 #MINPER: 1 #MAXPER: 3 #AVGPER: 1.4
3 #SUP: 6 #MINPER: 1 #MAXPER: 2 #AVGPER: 1.0
For example, the eighth line represents the pattern {a,c}. It indicates that this pattern appears in four transactions, that the smallest and largest periods of this pattern are respectively 1 and 2 transactions, and that this pattern has an average periodicity of 1.4 transactions.
SPMF also offers many other algorithms for periodic pattern mining. This includes algorithms for many variations of the problem of periodic pattern mining.
Related problems
There also exist extensions of the problem of discovering periodic patterns. For example, another algorithm offered in the SPMF library is called PHM. It is designed to discover “periodic high-utility itemsets” in customer transaction databases. The goal is not only to find patterns that appear periodically, but also to discover the patterns that yields a high profit in terms of sales.
Another related problem is to find stable periodic patterns. A periodic pattern is said to be stable if its periods are generally more or less the same over time. The SPP-Growth and TSPIN algorithms were designed for this problem.
Another related problem is to find periodic patterns in multiple sequences of transactions instead of a single one. For example, one may want to find patterns that are periodic not only for one customer but periodic for many customers in a store.
Another topic is to find patterns that are locally periodic. This means that a pattern may not always be periodic. Thus the goal is to find patterns and the intervals of time where they are periodic.
Another variation of the problem of periodic pattern mining is to find periodic patterns that are rare but highly correlated.
Video lectures on periodic pattern mining
If you want to know more about periodic pattern mining, you can watch some videos lectures that I have recorded on this topic, that are easy to understand. They are available on my website:
- Introduction to periodic itemset mining – 25 minutes

- Tthe PFPM algorithm – 25 minutes
- Identifying Stable Periodic Frequent Patterns using the SPP-Growth algorithm – 24 minutes
- Periodic high utility itemset mining and the PHM algorithm – 31 minutes
Also, you can find more videos on my Youtube channel. And if you want to know more about periodic pattern mining in general, you can also check my free online pattern mining course, which covers many other related topics.
Conclusion
In this blog post, I have introduced the problem of discovering periodic patterns in databases. I have also explained how to use open-source software to discover periodic patterns. Mining periodic patterns is a general problem that may have many applications.
There are also many research opportunities related to periodic patterns, as this subject as not been extensively studied. For example, some possibility could be to transform the proposed algorithms into an incremental algorithm, a fuzzy algorithm, or to discover more complex types of periodic patterns such as periodic sequential rules.
Also, in this blog post, I have not discussed about time series (sequences of numbers). It is also another interesting problem to discover periodic patterns in time series, which requires different types of algorithms.
==
Philippe Fournier-Viger is a full professor and the founder of the open-source data mining software SPMF, offering more than 110 data mining algorithms. If you like this blog, you can tweet about it and/or subscribe to my twitter account @philfv to get notified about new posts.