Five years ago, I had analyzed the source code of the SPMF data mining software using an open-source tool called CodeAnalyzer ( http://sourceforge.net/projects/codeanalyze-gpl/ ). This had provided some interesting insights about the structure of the project, especially in terms of lines of codes and code to comment ratio. In 2013, for SPMF 0.93, the results were as follows:
Metric Value ——————————- ——– Total Files 280 Total Lines 53165 Avg Line Length 32 Code Lines 25455 Comment Lines 23208 Whitespace Lines 5803 Code/(Comment+Whitespace) Ratio 0,88 Code/Comment Ratio 1,10 Code/Whitespace Ratio 4,39 Code/Total Lines Ratio 0,48 Code Lines Per File 90 Comment Lines Per File 82 Whitespace Lines Per File 20
Today, in 2018 I decided to analyze the code of SPMF again to get an overview of how the code has evolved over the last few years. Here are the result for the current version of SPMF (2.35):
Metric Value ——————————- ——– Total Files 1385 Total Lines 238938 Avg Line Length 32 Code Lines 118117 Comment Lines 91241 Whitespace Lines 32797 Code/(Comment+Whitespace) Ratio 0,95 Code/Comment Ratio 1,29 Code/Whitespace Ratio 3,60 Code/Total Lines Ratio 0,49 Code Lines Per File 85 Comment Lines Per File 65 Whitespace Lines Per File 23
Many numbers remain more or less the same. But it is quite amazing to see that the number of lines of code has increased from 25,455 to 118,117 lines. The project is thus about four times larger now. This is in part due to contributions from many people, in recent years, while at the beginning the software was mainly developed by me. The total number of lines may still not seem very big for a software. However, most of the code is quite optimized and implement complex algorithms. Thus, many of these lines of code took quite a lot of time to write.
The number of comment lines has also increased, from 23,208 to 91,241 lines. But the ratio of code to comment lines has slightly increased. Thus, perhaps that adding some more comments is needed.
What is next for SPMF? Currently, I am preparing to release a new version of SPMF, which will include about 10 new algorithms. It should be released in about 1 or 2 weeks, as I need to finish other things first.
That is all for today! If you have comments or questions, please post them in the comment section below.
— Philippe Fournier-Vigeris a full professor working in China and founder of the SPMF open source data mining software.
In this blog post, I talk about how to improve the quality of your research papers. This is an important topic as most researchers aim at publishing papers in top level conferences and journals for various reasons such as graduating, obtaining a promotion or securing funding.
Write less papers. Focus on quality instead of quantity. Take more time for all steps of the research process: collecting data, developing a solution, doing experiments, and writing the paper.
Work on a hot topic or new research problem, that can have an impact. To publish in top conferences and journals, it will help to work on a popular or recent research problem. Your literature review should be up to date with recent and relevant references. If all your references are more than 5 years old, the reviewers may think that the problem is old and unimportant. Choosing a good research topic also mean to work on something that is useful and can have an impact. Thus, take the time to choose a good research problem before starting your work.
Improve your writing skills. For top conferences and journals, the papers must be well written. Often, this can make the difference between a paper being accepted and rejected. Hence, spend more time to polish your paper. Read your paper several times to make sure that there is no obvious errors. You may also ask someone else to proofread your paper. And you may want to spend more time reading and practicing your English.
Apply your research to real data or make collaboration with the industry. In some field like computer science, it is possible to publish a paper that is not applied to real applications. But if you put extra effort into showing the real application and obtain data from the industry, it may make your paper more convincing.
Collaborate with excellent researchers. Try to work with researchers who frequently publish in top conferences and journals. They will often find flaws in your project and paper that could be avoided and give you feedback to improve your research. Moreover, they may help improve your writing style. Thus, choose a good research team and establish relationships with good researchers and invite them to collaborate.
Submit to the top conferences and journals. Many people do not submit to the top conferences and journals because they are afraid that their papers will be rejected. However, even if it is rejected, you will still usually get valuable feedback from experts that can help to improve your research, and if you are lucky, your paper may be accepted. A good strategy is to first submit to the top journals and conferences and then if it does not work, to submit to lower level conferences and journals.
Read and analyze the structure of top papers in your field. Try to find some well-written papers in your field and then try to replicate the structure (how the content is organized) in your paper. This will help to improve the structure of your paper. The structure of the paper is very important. A paper should be organized in a logical way.
Make sure your research problem is challenging, and the solution is well justified. As I said, it is important to choose a good research problem. But it is important also to provide an innovative solution to the problem that is not trivial. In other words, you must solve an important and difficult problem where the solution is not obvious. You must also write the paper well to explain this to the reader. If the reviewer think that the solution is obvious or not well-justified, then the paper may be rejected.
Write with a target conference or journal in mind. It is generally better to know where you will submit the paper before you write it. Then, you can better tailor the paper to your audience. You should also select a conference or journal that is appropriate for your research topic.
Don’t procrastinate. For conference papers, write your paper well in advance so that you have enough time to write a good paper.
Those are my advices. If you have other advices or comments, please share them in the comment section below. I will be happy to read them.
— Philippe Fournier-Viger is a full professor working in China and founder of the SPMF open source data mining software.
This is a video presentation of the paper “Mining Partially-Ordered Sequential Rules Common to Multiple Sequences” about discovering sequential rules in sequences using the RuleGrowth algorithm.
This week, I have attended the 2018 International Workshop on Mining of Massive Data and IoT (2018 年大数据与物联网挖掘国际研讨会) organized by the Fujian Normal University in the city of Fuzhou,China from the 18th to 20thDecember 2018.
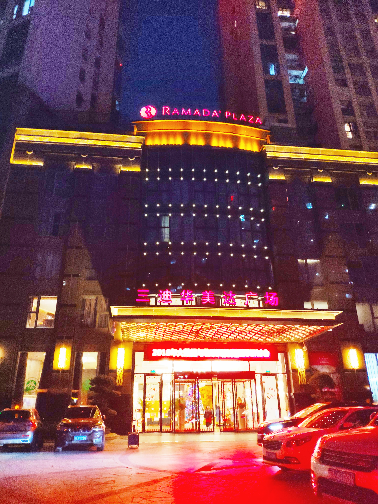
I have attended the workshop to give a talk and also to meet other researchers, and listen to their talks. There was several invited expertsfrom Canada, as well as from China. Below, I provide a brief report about the workshop. The workshop was held at the Ramada Hotel in Fuzhou.
Talks
There was 11 long talks. Given by the invited experts. The opening ceremony was chaired by Prof. Shengrui Wang and featured the dean Prof. Gongde Guo.
Prof. Jian-Yun Nie from University of Montreal (Canada) talked about information retrieval from big data. Information retrieval is about how to search for documents using queries (e.g. when we use a search engine). In traditional information retrieval, documents and queries are represented as vectors and relevance of documents is estimated by a similarity function. Prof. Nie talked about using deep learning to learn representation of content and matching for information retrieval.
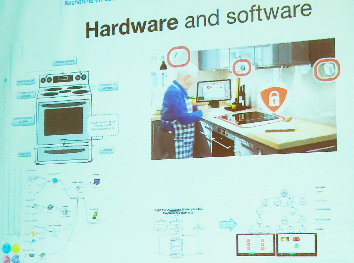
Prof. Sylvain Giroux from University of Sherbrooke (Canada) gave a talk about transforming homes into smart homes that provide cognitive assistance to cognitively impaired people. He presented several projects, including a system called COOK that is designed to help people to cook using a modified oven equipped with sensors and communication abilities. He also shown another project using the Hololens to build a 3D mapping of all objects in a house and tag them with semantics (an ontology).
Prof. Guangxia Xu from Chongqing University of Posts and Telecommunications gave a talk about data security and privacy in intelligent environments.
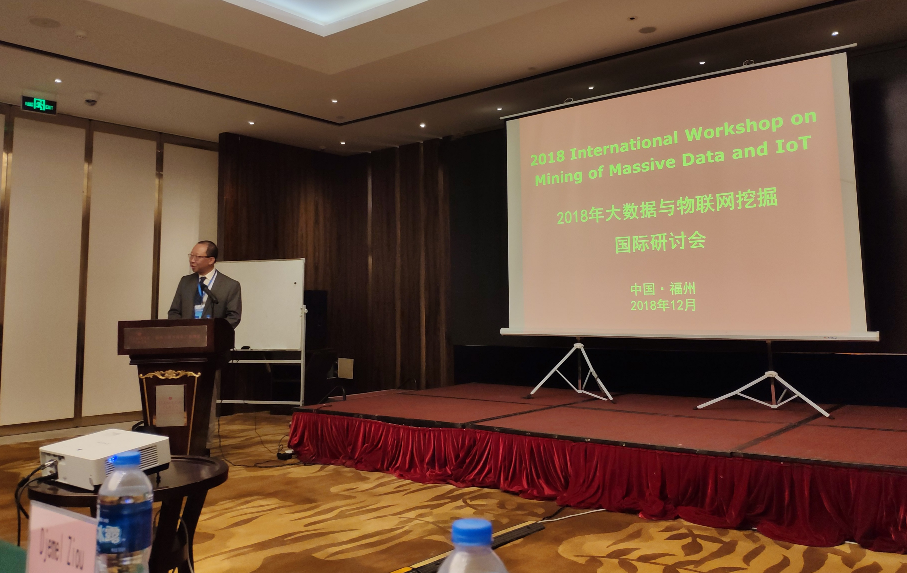
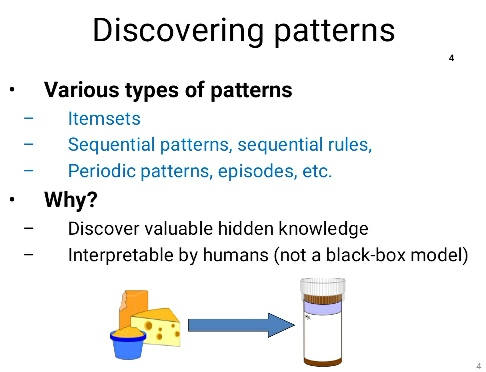
Prof. Philippe Fournier-Viger (me), then gave a talk about high-utility pattern mining. It consists of discovering important patterns in symbolic data (for example, to identify the sets of items purchased by customers that yield a lot of money). I also presented the SPMF software that I founded, which offers more than 150 data mining algorithms.
Then, there was a talk by Dr. Shu Wu about using deep learning in context recommender systems. That talk was followed by a very interesting talk by Prof. Djemel Ziou of University of Sherbrooke (Canada) about his various projects related to image processing, object recognition, and virtual reality. In particular, Prof. Ziou talked about a project to evaluate the color of light pollution from pictures.
Then, another interesting talk was by Dr. Yue Jiang from Fujian Normal University. She presented two measures called K2 and K2* to calculate sequence similarity in the context of bioinformatics. The designed approach is alignment-free and can be computed very efficiently.
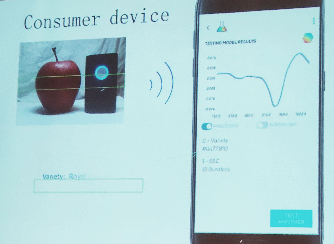
On the second day, there was more talks. A talk by Prof. Hui Wang from Fujian Normal University was about detecting fraud in the food industry. This is a complex topic, which requires to use complex techniques such as a mass spectrometer. It was explained that some products such as olive oil are often not authentic with up to 20% of olive oil looking suspicious. Traditionally, food tests were performed in a lab, but nowadays handheld devices have been developed using infrared light to quickly perform food tests anywhere.
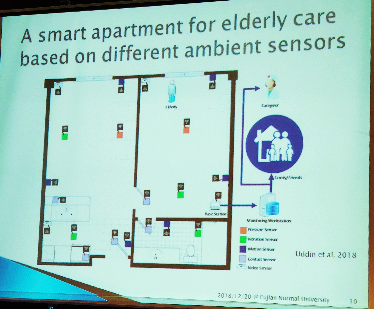
Then, there was a talk by Prof. Hui-Huang Tsu about elderly home care and sensor data analytics. He highlighted privacy issues related to the use of sensors in smart homes.
There was a talk by Prof. Wing W.Y. Ng about image retrieval and a talk by Prof. Shengrui Wang about regime switch analysis in time series.
Conclusion
This was an interesting event. I had the opportunity to talk with several other researchers with common interests. The event was well-organized.
— Philippe Fournier-Viger is a full professor working in China and founder of the SPMF open source data mining software.
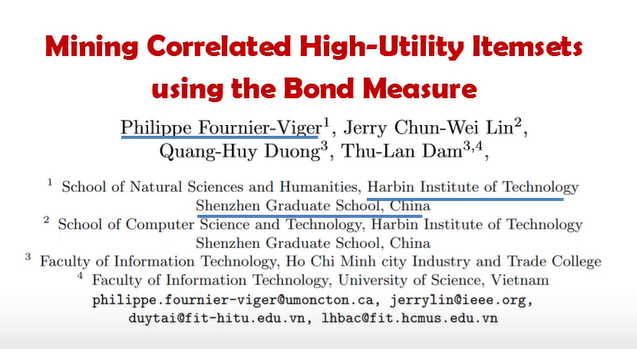
This is a video presentation of the paper “Mining Correlated High-Utility Itemsets Using the bond Measure” about correlated high utility pattern mining using FCHM.
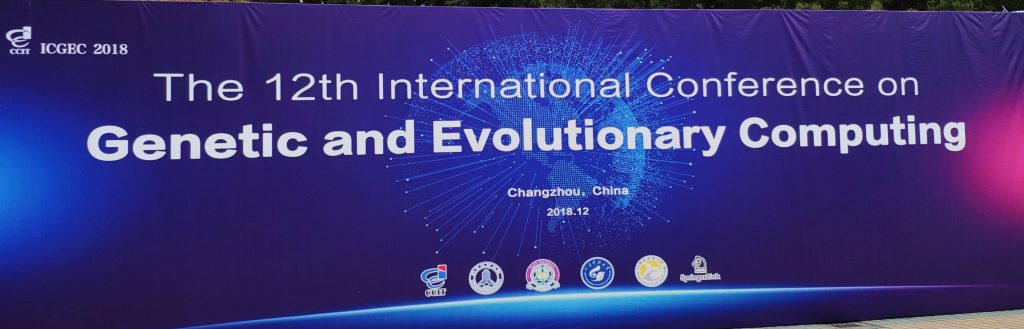
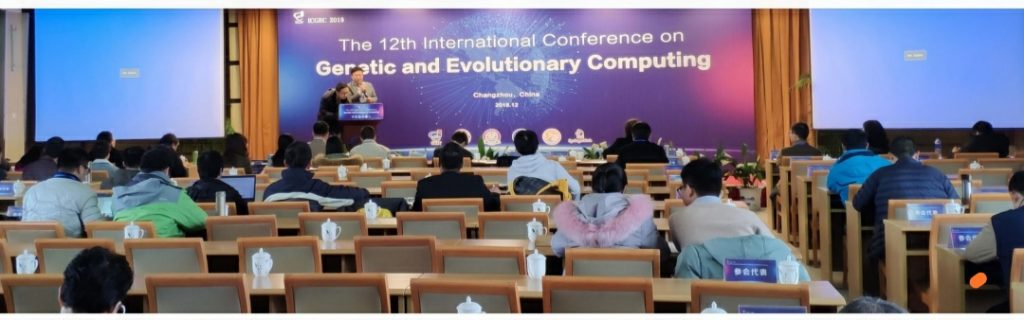
I have recently attended the ICGEC 2018 conference (12th International Conference on Genetic and Evolutionary Computing) from December 14-17, 2018 in Changzhou, China. In this blog post, I will describe activities that I have attended at the conference.
About the ICGEC conference
IGCEC is a good conference on the topic of Evolutionary Computing and Genetic Computing. It is the 12th edition of the conference. It is generally held in Asia and there is some quality papers. The proceedings are published by Springer and indexed in EI, which ensures a good visibility. Besides, the best papers are invited in various special issues of journals such as JIHMSP and DSPR. Also, there was six invited keynote speakers, which is more than what I usually see at international conferences. I am attending this conference to give one of the keynote talks on the topic of high utility pattern mining.
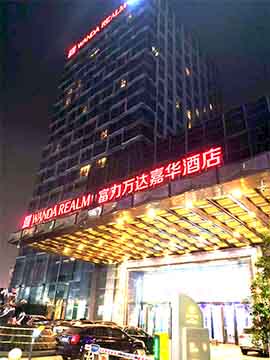
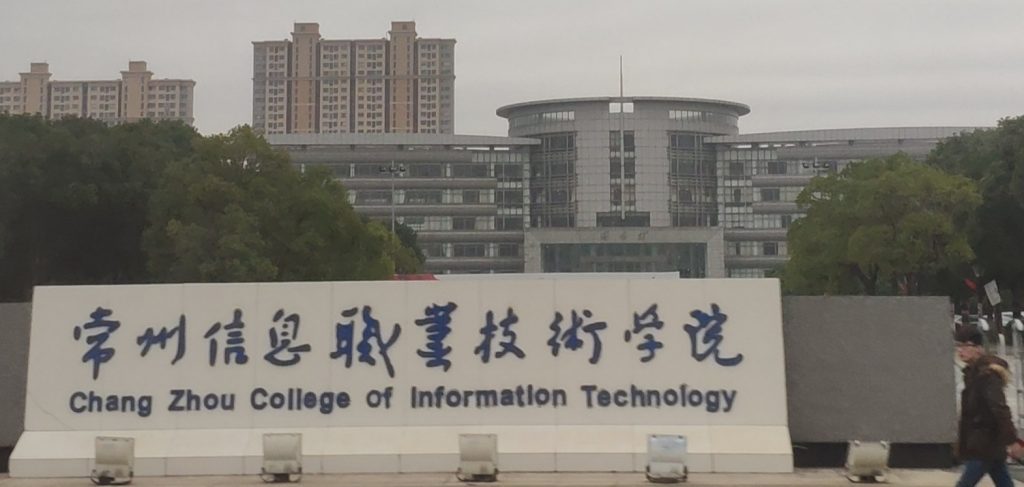
The conference was held partly at the Wanda Realm Hotel and the Changzhou College of Information Technology (CCIT).
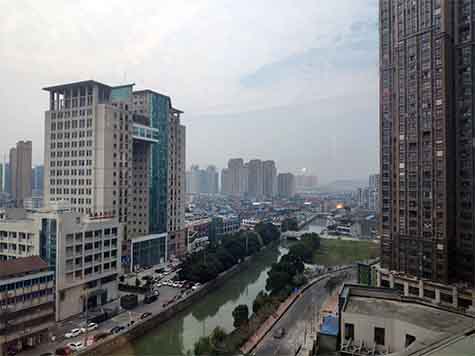
Changzhou is middle-sized city not very far by train from Shanghai, Wuxi and Nanjing. In terms of tourism, Changzhou is especially famous for some theme parks, and has also some museum and temples. The city has several universities and colleges.
Vew of Changzhou from my hotel window
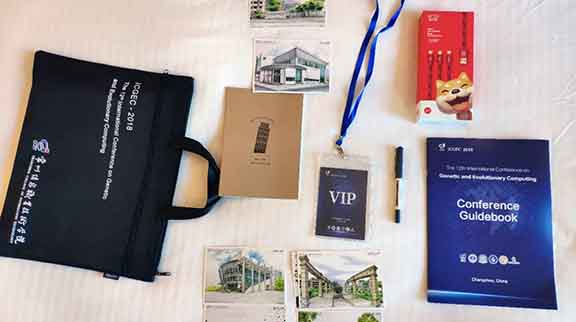
Here is a picture of the conference materials (book, bag, gifts, etc.).
Opening ceremony
The opening ceremony was held by Dr. Yong Zhou, and Prof. Jeng-Shyang Pan, honorary chairs of the conference. Also. Prof. Chun-Wei Lin, general chair briefly talked about the program. This year about 200 submissions have been received and around 36 were accepted.
Keynote talks
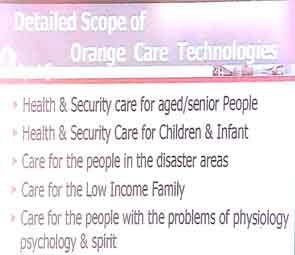
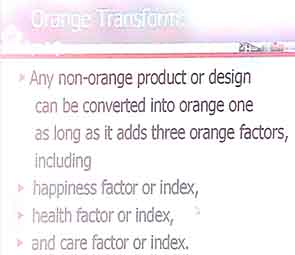
The first keynote was by Prof. Jhing-Fa Wang about orange technology and robots. The concept of Orange Technology is interesting. It refers to technologies that are designed to enhance the life of people in terms of (1) help, (2) happiness and (3) care. As we have the concept “green technology” to refer to environment-friendly technology, “orange technology” is proposed so that we can focus on the people. Some example of orange technology is robots that can assist senior people.
The second talk was by Prof Zhigeng Pan about virtual reality. Prof. Pan presented several applications of virtual reality, augmented reality, and applications.
The third talk was by Prof. Xiudeng Peng about industrial applications of artificial intelligence such as automatic inspection systems, fuzzy control systems, defect marking, etc. Prof. Peng reminded us that if we are interesting in finding potential applications of AI, there are a lot of opportunities in the industry. He also stressed the importance of developing machine learning models that can be updated in real-time to feed-back, and hav online capabilities.
The fourth keynote talk was by Jiuyong Li about causal discovery and applications. The topic of causal discovery is very interesting as it aims to find causal relationships in data rather than associations. Several models have been proposed in this field to find causal rules and causal decision trees, for example. Several software by Prof. Li are open-source, and he has published a book on this topic recently.
The fifth keynote was by myself, Philippe Fournier-Viger. I presented an overview of our recent work about pattern mining, and in particular itemset mining, high utility pattern mining, periodic pattern mining, significant pattern mining and local pattern mining. I also presented my open-source data mining software called SPMF. Finally, I discussed what I see as current research opportunities in the field of pattern mining, and how evolutionary and genetic algorithms can be used in this field (because it is the main topics of the conference).
Then, there was a last keynote talk by Dr. Peter Peng about genetic algorithms, clustering and industry applications.
Regular talks
On the second day, there was several regular paper presentations grouped by topics, including machine learning, evolutionary computing, image and video processing, information hiding, smart living, classification and clustering, applications of genetic algorithms, smart internet of things, and artificial intelligence.
Social activities
On the first day a special reception was held for invited guests and committee members at the hotel. A buffet was held at the hotel on the evening of the second day, and a banquet on the evening of the last day of the conference. Overall, there were many opportunities for discussing with other researchers, and people were very friendly.
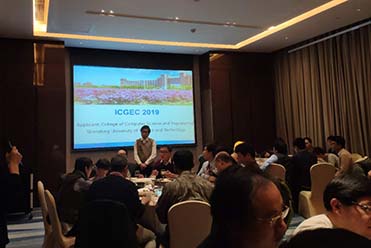
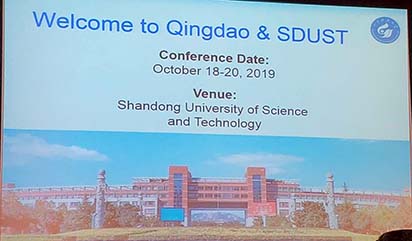
Next year: ICGEC 2019
Next year, ICGEC 2019 will be held in Qingdao, China, which is a nice city close to the sea. It will be organized by professors from the Shandong University of Science and Technology.
Conclusion
The ICGEC 2018 conference was well-organized, and it has been a pleasure to attend it. Looking forward to ICGEC 2019.
— Philippe Fournier-Viger is a full professor working in China and founder of the SPMF open source data mining software.
Rankings are made in many fields, as we naturally tend to rank objects, persons or things, in different contexts. For example, in a singing or a sport competition, some judges will rank participants from worst to best and give prizes to the best participants. Another example is persons that rank movies or songs according to their tastes on a website by giving them scores.
If one has ranking data from several persons, it is possible that the rankings appear quite different. However, using appropriate techniques, it is possible to extract information that is common to several ranking that can help to understand the rankings. For example, although a group of people may disagree on how they rank movies, many people may agree that Jurassic Park 1 was much better than Jurassic Park 2. The task of finding subrankings common to several rankings is a problem called frequent subranking mining. In this blog post, I will give an introduction to this problem. I will first describe the problem and some techniques that can be used to mine frequent subrankings.
The problem of subranking mining
The input of the frequent subranking mining problem is a set of rankings. For example, consider the following database containing four rankings named r1, r2, r3and r4 where some food items are ranked by four persons.
Ranking ID
Ranking
r1
Milk < Kiwi < Bread < Juice
r2
Kiwi < Milk < Juice < Bread
r3
Milk < Bread < Kiwi < Juice
r4
Kiwi < Bread < Juice < Milk
The first ranking r1 indicates that the first person prefers juice to bread, prefers bread to kiwi, and prefers kiwi to milk. The other lines follow the same format.
To discover frequent subrankings, the user must specify a value for a parameter called the minimum support (minsup). Then, the output is the set of all frequent subrankings, that is all subrankings that appear in at least minsup rankings of the input database. Let me explain this with an example. Consider the ranking database of the above table and that minsup = 3. Then, the subranking Juice < Milk is said to be a frequent subranking because it appears at least 3 times in the database. In fact, it appears exactly three times as shown below:
Ranking ID
Ranking
r1
Milk < Kiwi < Bread < Juice
r2
Kiwi < Milk < Juice < Bread
r3
Milk < Bread < Kiwi < Juice
r4
Kiwi < Bread < Juice < Milk
The number of occurrence of a subranking is called its support (or occurrence frequency). Thus the support of he subranking Milk < Juice is 3. Another example is the subranking Kiwi < Bread < Juice which has a support of 2, since it appears in two rankings of the input database:
Ranking ID
Ranking
r1
Milk < Kiwi < Bread < Juice
r2
Kiwi < Milk < Juice < Bread
r3
Milk < Bread < Kiwi < Juice
r4
Kiwi < Bread < Juice < Milk
Because he support of Kiwi < Bread < Juice is less than the minimum support threshold, it is NOT a frequent subranking.
To give a full example, if we set minsup = 3, the full set of frequent subrankings is:
Milk < Bread support : 3 Milk < Juice support : 3 Kiwi < Bread support : 3 Kiwi < Juice support : 4 Bread < Juice support : 3
In this example, all frequent subrankings contains only two items. But if we set minsup = 2, we can find some subranking containing more than two items such as Kiwi < Bread < Juice, which has a support of 2.
This is the basic idea about the problem of frequent subranking mining, which was proposed in this paper:
Henzgen, S., & Hüllermeier, E. (2014). Mining Rank Data. International Conference on Discovery Science.
Note that in the paper, it is also proposed to then use the frequent subrankings to generate association rules.
How to discover the frequent subrankings?
In the paper by Henzgen & Hüllermeier, they proposed an Apriori algorithm to mine frequent subrankings. However, it can be simply observed that the problem of subrank mining can already be solved using the existing sequential pattern mining algorithmssuch as GSP (1996), PrefixSpan (2001), CM-SPADE (2014), and CM-SPAM (2014). This was explained in an extended version of the “Mining rank data” paper published on Arxiv (2018) and other algorithms specially designed for subranking mining were proposed.
Thus, one can simply apply sequential pattern mining algorithms to solve the problem. I will show how to use the SPMF software for this purpose. First, we need to encode the ranking database as a sequence database. I have thus created a text file called kiwi.txt as follows:
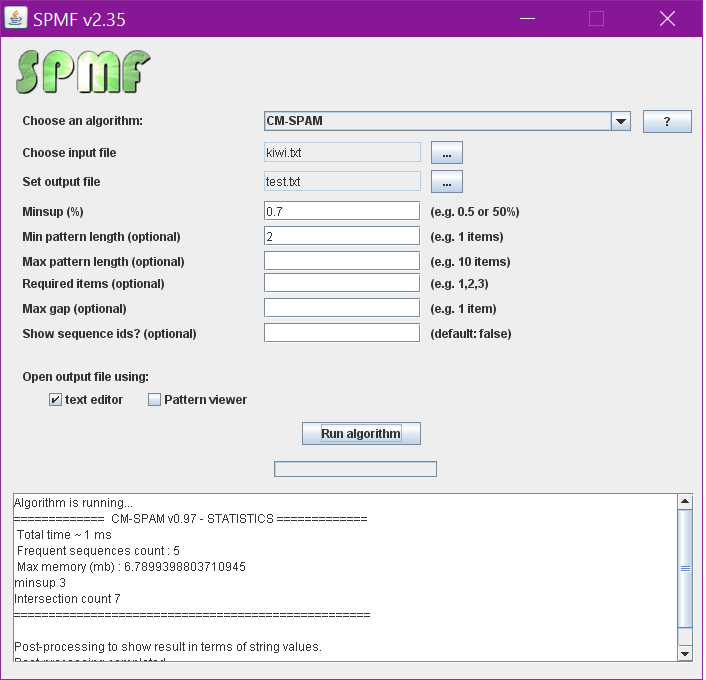
In that format, each line is a ranking. The value -1 is a separator and -2 indicates the end of a ranking. Then, if we apply the CM-SPAM implementation of SPMF with minsup = 3, we obtain the following result:
which is what we expected, except that CM-SPAM also outputs single items (the first four lines above). If we dont want to see the single items, we can apply CM-SPAM with the constraint that we need at least 2 items, then we get the exact result of all frequent subrankings:
milk -1 bread -1 #SUP: 3 milk -1 juice -1 #SUP: 3 kiwi -1 bread -1 #SUP: 3 kiwi -1 juice -1 #SUP: 4 bread -1 juice -1 #SUP: 3
We can also apply other constraints on subrankings such as a maximum number of items using CM-SPAM. If you want to try it, you can download SPMF, and follows the instructions on the download page to install it. Then, you can create the kiwi.txt file, and run CM-SPAM as follows:
You will notice that in the above window, the minsup parameter is set to 0.7 instead of 3. The reason is that in the SPMF implementation, the minimum support is expressed as a percentage of the number of ranking (sequences) in the database. Thus, if we have 4 rankings, we multiply by 0.7, and we also obtain that minsup is equal to 3 rankings (a subranking will be considered as frequent if it appears in at least 3 rankings of the database).
What is also interesting, is that we can apply other sequential pattern mining algorithms of SPMF to find different types of subrankings: VMSP to find the maximal frequent subrankings, CM-CLASP to find the closed subrankings, or even VGEN to find the generator subrankings. We could also apply sequential rule mining algorithms such as RuleGrowth and CMRules to find rules between subrankings.
Conclusion
In this blog post, I discussed the basic problem of mining subrankings from rank data and that it is a special case of sequential pattern mining.
— Philippe Fournier-Viger is a full professor working in China and founder of the SPMF open source data mining software.
In recent years, there have been an increased interest in Artificial Intelligence (AI). This is due in part to some advances for training and building neural networks, which have allowed to solve some difficult problems with greater success. This has lead to some very large investments in AI both from various governments and companies, and an increased interest in academia, and in the mainstream media for AI. This provides a lot of funding and opportunities for AI researchers and companies. However, when there is a lot of hype and expectations, there is real risk that expectations will not be met and that the bubble will burst. For AI, this has already happened twice in the 70s and 80s after expectations were not met. At these moments, AI funding greatly decreased for several years. These periods are called AI winters. Will there be another AI winter soon? I will discuss this in this blog post.
Recent breakthroughs in AI
During previous AI winters, many people have been disappointed by AI due to its inability to solve complex problems. One of the reason was that the computing power available at that time was not enough to train complex models. Since then, computers have become much more powerful. Recently, some of the greatest breakthrough in AI have been made possible due to the increase in computing power and the amount of data. For example, deep learning has emerged as a key family of machine learning models, which is basically neural networks with more hidden layers, trained on GPUs to obtain more computing power. Such models have allowed to perform some tasks very well in particular related to image classification, labelling, speech processing and language translation. For example, the ImageNet computer vision task has been solved with a very high accuracy by the AlexNet model using GPUs to train neural networks a few years ago. Then, various other improvements have been done such as for generating content using adversarial networks and using reinforcement learning for game playing (e.g. AlphaGo).
However, it can be argued that these models do some tasks better than previous models but actually do not do something really new. For example, although increasing the accuracy of document translation or image classification is useful, we are still very far from having models that do something much more complicated such as writing a text that make sense or having a real conversation with humans (not just a scripted chatbot!). It also seems clear that just increasing the computing power with more GPUs will not be enough to achieve much more complicated tasks. To achieve “General Artificial Intelligence” some key aspects such as common sense reasoning must be considered, which are lacking in current models. Thus, current deep learning models can only be seen as a small step toward a truly intelligent machine, and more research will be needed.
In fact, it can be observed that the biggest recent breakthrough are limited to some specific areas such as image and speech processing. For example, this year, I visited the International Big Data Expo 2018 in China and there was many companies displaying computer vision based products using deep learning, such that after a while, we may wonder what other problems can it solve?
Huge expectations towards AI and the need for a return on investment
There is no doubt that AI is very useful. But the huge expectations towards AI that some investors currently have are dangerous as it seems that some will not be met in the short-term. And this could lead to a disappointment, and a decrease in investments (a winter).
For example, currently one of the most popular applications of AI discussed in the medias is self-driving cars. Huge sums of money have been invested in this technology by multiple companies. However, when we see the recent car crashes and deaths caused by prototype self-driving cars in the US, it is clear that the technology is not 100 % safe. I think that the only way that safety could be achieved for such cars is if only self-driving cars would be on the road, but this will not happen anytime soon. And who would like to be in a car that is not safe? Thus, such research has the potential to lead to a huge disappointment in the short term as investors may not see the return on investment. Another example is the research by giants such as Amazon on drone delivery. It is certainly an interesting idea but in practice such technology will be met by many practical problems (what if a drone crashes and kill someone? what about if people start shooting these drones or blinding them with laser? how much weight can these drones carry? and would it even make sense economically?).
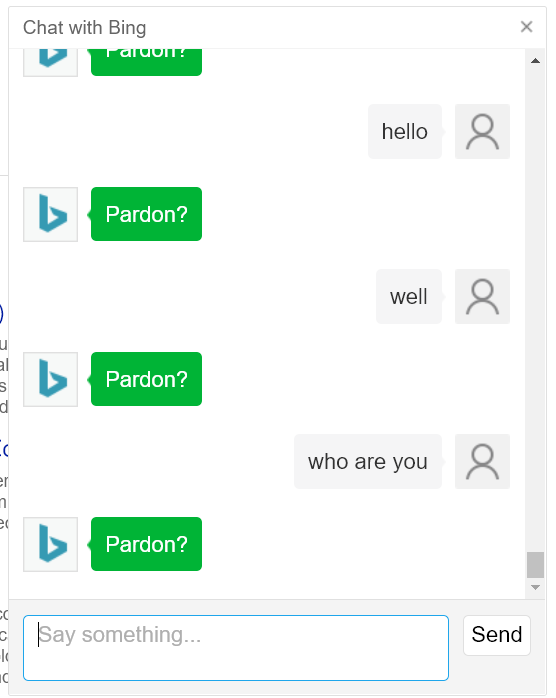
There is also a lot of hype in the media promising that AI could replace many jobs in the near future, including those of radiologists. Moreover, some researchers have even started to discuss in the media about dangers of AI, which seems very far-fetched as we are nowhere close to some general artificial intelligence. But all this discussion increases the expectations of the general public towards AI. To take advantage of the hype on AI, more and more consumer products are said to be “powered by AI” such as the cameras of cellphones. Even the Bing search engine has been updated with a chatbot, which actually does not appear to be much “smarter” than the chatbots of the 1990s (see pictures below).
For companies, what will determine whether there is a next AI winter is whether they can see a clear return on investment when hiring expensive AI specialists to develop AI products. If the return on investment is not there, then the funding will disappear and projects will be terminated.
I have recently discussed with a top researcher at the ADMA 2018 conference, which has many relationships with the industry and he told me that many companies currently don’t see the return on investment for their AI projects. That researcher made a prediction that an AI winter could occur as early as in the next 6 months. But, we never know. This is very hard to predict. It is a bit like trying to predict the stock market!
Personally, I could see some AI winter happening in the next few years. But I think that it could be perhaps a soft winter, where the interest will perhaps decrease but there will always remains some interest as AI is useful. What is your prediction ? Please leave your comments below!
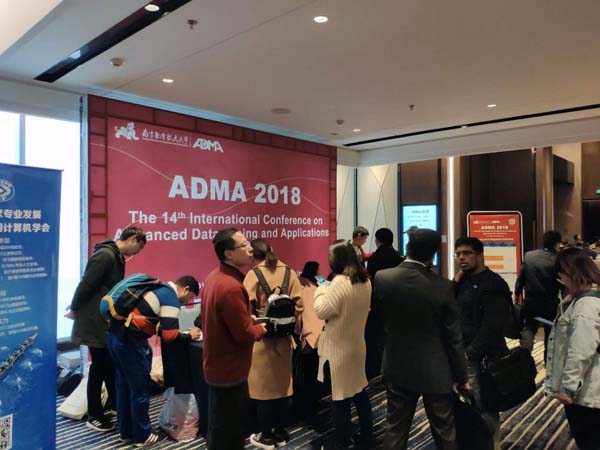
I have recently attended the 13th International Conference on Advanced Data Mining and Applications (ADMA 2018) in Nanjing, China from the 16th to 18th October 2018. In this blog post, I will give a brief report about this conference.
What is the ADMA conference?
ADMA is a conference on data mining, which is generally held in China, and sometimes in other parts of Asia. It is a overall a decent conference. In particular, the proceedings are published by Springer in their Lecture Notes in Artificial Intelligence, which ensures a good visibility of the accepted papers, and all papers are indexed in EI and DBLP. One of the particularity of this conference is that it has a focus on applications of data mining.
The ADMAconference has started in 2005 and was held every year until 2014. I have attended ADMA 2011, ADMA 2013 and ADMA 2014, and also had a paper in ADMA 2012. In recent years, I had submitted papers to the ADMA 2015 which was cancelled. Then, since ADMA 2016, the conference has been held every year, with quality papers, and this year, I am glad to be back at attending ADMA.
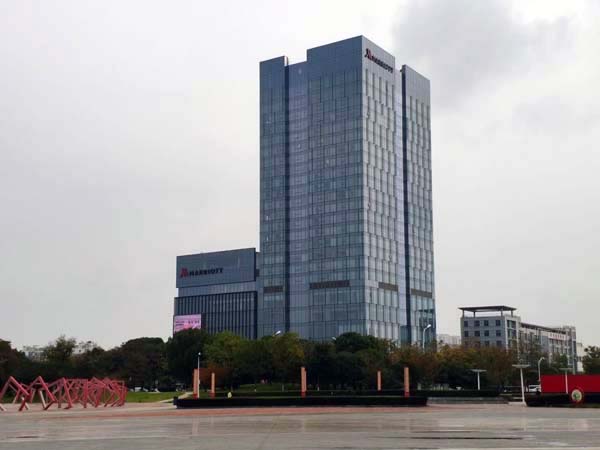
Location
The 13th ADMA conference was held at the Mariott hotel in Nanjing. Nanjing is the capital of the Jiangsu province in China. Nanjing has a long history and has been the capital of several Chinese dynasties. There are many things to see, and it is close to some other popular cities like Suzhou.
Schedule
The main conference was held on two days, while a third day was used for some doctoral student forums. For the main conference, there was two keynote speakers in the morning of each day. Then, in the afternoon, there was paper presentations. Due to this tight schedule, all papers were either selected to be presented in 10 or 15 minutes (including the questions). In the evening, there was a reception and a banquet on the first and second day, respectively.
Acceptance rate
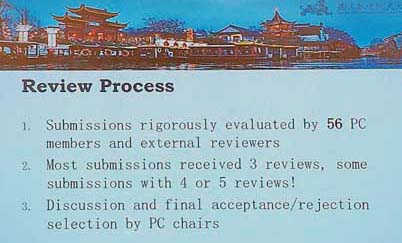
It was announced that 104 research papers have been submitted this year from 20 countries and 5 continents. A total of 46 papers were accepted. From these papers, 24 were selected for a long presentations, while 22 for short presentations. Both types of papers had the same number of pages in the proceedings. Thus, the overall acceptance rate is 44.2%. Here is some slide about the review process, from the opening ceremony:
Registration
On the first day, it was conference registration. We received the conference program, badge, pen, notebook and a laser pointer as gift. The conference proceedings was on the USB of the laser pointer.
Welcome speech
Then, there was a brief introduction by some high ranking representative (dean?) of the Nanjing University of Aeronautics and Astronautics, which organized the conference. Then, the local organizers gave some information about the conference.
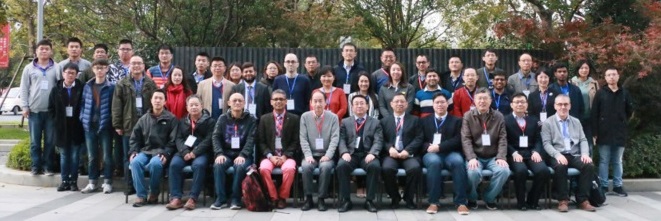
And we took a group picture.
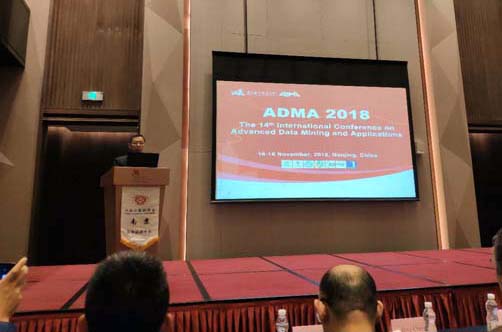
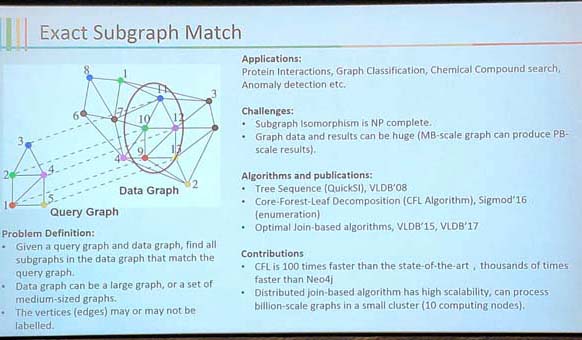
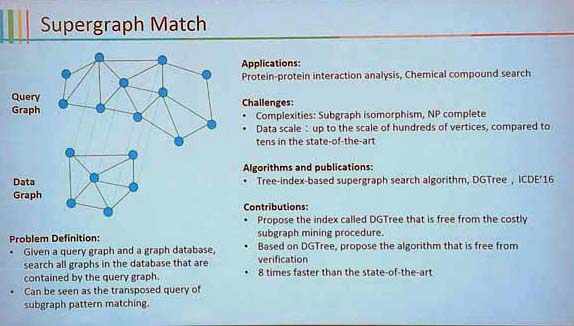
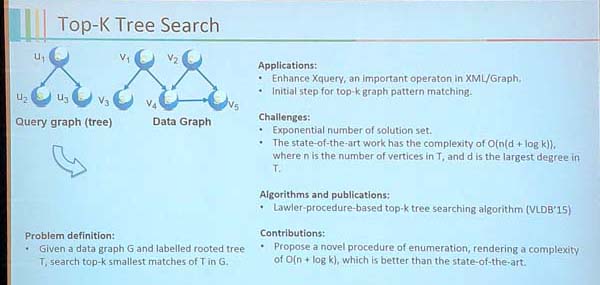
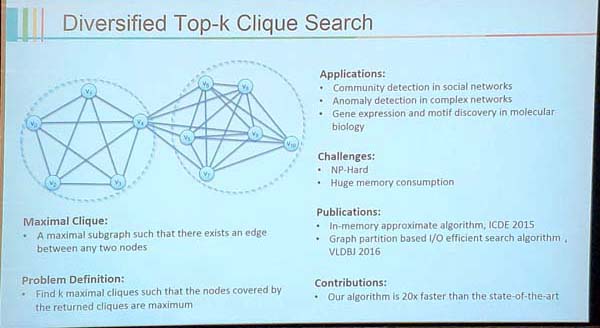
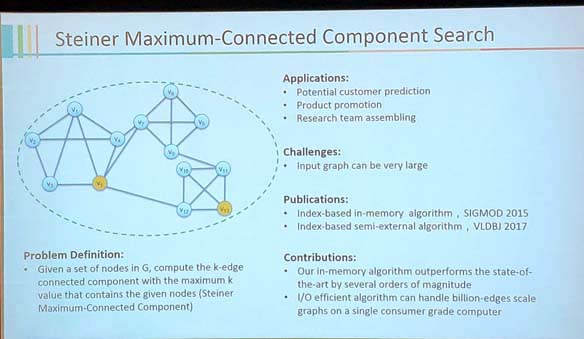
Day 1 – Keynote by Xuemin Lin on Graph Data Mining
The first keynote was done by Xuemin Lin, the editor-in-chief of TKDE, one of the top data mining journals. The talk was about graph analysis. In the first part of the talk, some applications of graph analysis were introduced such as:
detection of fraud in a social graph (people collaborating to commit fraud). These can be found for example, by mining rings or bi-cohesive subgraphs,
product recommendation, where customers, preferences and purchase products and locations are put in a graph model (a multidimensional graph).
planning the delivery of food and products to homes in an efficient way.
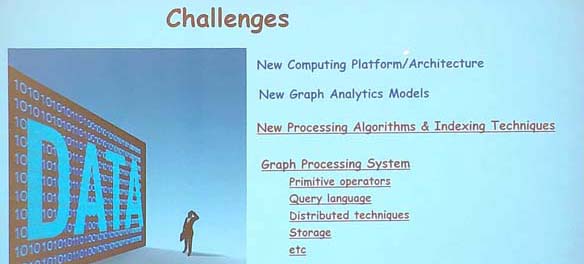
Then, some key challenges for graph analysis have been presented: define a new computing platform, analytic models, processing algorithms, indexing techniques, and processing systems (primitive operators, query language, distributed techniques, storage, etc.) for graphs. In other words, we need to define new models and software specialized for analyzing graphs.
Finally, several problems related to graph analysis were briefly discussed.
Overall, this was a good keynote talk as it gave a good and up-to-date overview of several graph analysis problems.
Day 1 – Keynote by Ekram Hossain on Deep Learning for Resource Allocation in Wireless Networks
The talk was about using stacked auto-encoders for resource allocation in wireless network. The main resources are channel, transmission power of a radio station (power allocation) and antennas (shared by many users – how we allocate to many users). The speaker was some specialist from the field of communication.
In theory, this should have been a very interesting talk. But a problem with this talk was that the speaker spent most of the time explaining basic concepts of machine learning, and ran out of time before talking about how he was actually using deep learning for resource allocation (which was supposed to be the key part of the talk).
Day 1 – paper presentations
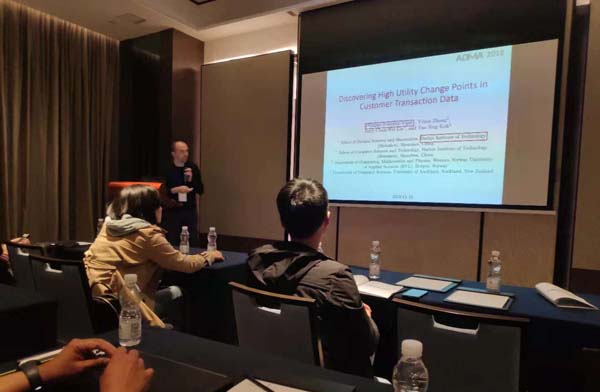
There was several paper presentations about various topics related to data mining such as clustering, outlier detection and pattern mining. I also presented a paper about the project of my student, which is to discover change points of high utility patterns in a temporal database of customer transactions:
Fournier-Viger, P., Zhang, Y., Lin, J. C.-W., Koh, Y.-S. (2018). Discovering High utility Change Points in Transactional Data. Proc. 13th Intern. Conference on Advanced Data Mining and Applications (ADMA 2018) Springer LNAI, 10 pages.
Day 1 – Reception
Then, in the evening a buffet diner was offered at the Mariott Hotel, which was a good opportunity for discussing with other researchers.
Day 2
On the second day, there was more keynote and paper presentations.
Day 2 – banquet
Then, there was a banquet at the hotel of the conference.
Next year: the ADMA 2019 conference
It was announced that the ADMA 2019 conferencewill be held in Dalian, China from the 21st to 23rd November 2018. The planned dates for ADMA 2019 are as follows:
Paper submission: 10th May 2019
Demo: 10th June 2019
Tutorial: 1st August 2019
Competition: 15th August 2019
Research student forum: 10th September 2019
Conclusion
It was an interesting conference. Although it is not a very big conference, there was some good keynote speakers, and I had some very good discussions with other researchers. Looking forward to the 14th ADMA conference (ADMA 2019 conference) , next year.
There exists many ways of analyzing the relationships between co-authors in Academia. In this blog post, I will talk about a fun measure called the “Erdös number“, which has been proposed in the field of mathematics in the 90s. The Erdos number of a person is the distance to Paul Erdos when considering co-authorship links on academic publications. For example, if you have written a paper with Paul Erdos, you have an Erdos number of 1. If you have written a paper with a co-author of Erdos, then your Erdos number is 2. And so on.
The concept of Erdos number is based on the concept of “degree of separation” between people in a social network. The idea is that everyone should never be very far apart from any other person through their social links. Maybe you wonder Why using Erdos as reference for this measure? The reason is that Paul Erdos is one of the most prolific authors in mathematics, with more than 1000 papers. Thus, Paul Erdos is widely connected to other researchers. But other people can also be used to compute such numbers.
What is your Erdos number?
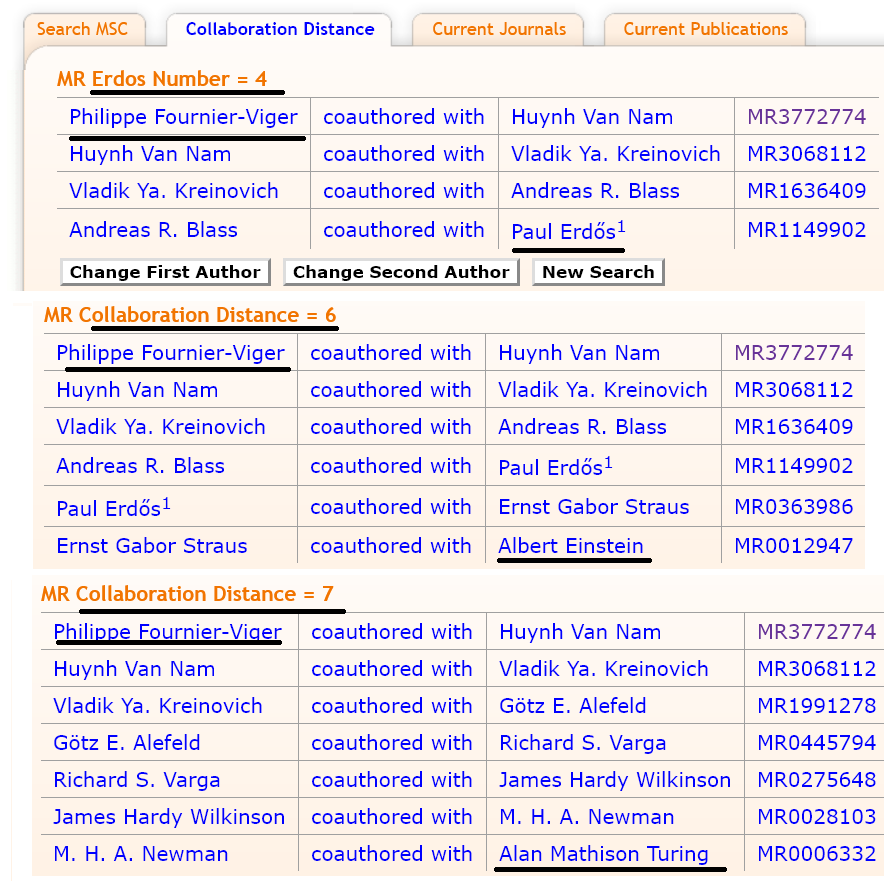
If you want to compute your distance with Erdos or any other researcher in fields related to mathematics or computer science, a good way is to use the MathSciNet website. It let you compute your collaboration distance to any other people. It may not consider all publications but should give a quite accurate results. For example, I have used it to make a few tests to compute my distance to Paul Erdos, Albert Einstein and Alan Turing. The results are below:
Thus, according to this tool, my Erdos, Eistein and Turing numbers are N = 4, 6, and 7, respectively. If you have collaborated with me, and upper bound on your numbers is thus N+1. All of this, does not mean much as our contributions to sciences are much smaller than those of these geniuses. But it shows that researchers are often not far apart.
Conclusion
This was just a short blog post to show you this interesting tool for calculating the distance between researchers in academia. It is not a new concept, but I think it is interesting. It shows that indeed people are never very far apart in academia. What is your Erdos number? You can share it in the comment section below!