A question that many young researchers ask is how to get your papers published in top conferences and journal. There are many answers to this question. In this blog post, I will discuss a strategy for carrying research called the “Blue Ocean Strategy”. This strategy was initially proposed in the field of marketing. But in this blog post, I will explain how it is also highly relevant in Academia.
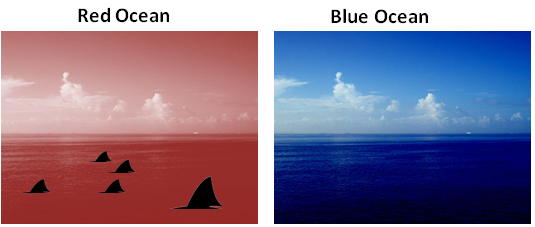
The Blue Ocean Strategy was proposed in a 2007 book by Kim, C. W. and Mauborgne, R. The idea is quite simple. Let’s say that you want to start a new business and get rich. To start your business, you need to choose a market where your business will operate. Let’s say that you decide to start selling pens. However, there are already a lot of pen manufacturers that are well-established and thus this market is extremely competitive and profit margins are very low. Thus, it might be very difficult to become successful in this market if you just try to produce pens like every other manufacturers. It is like jumping in a shark tank!
The Blue Ocean Strategy indicates that rather than fighting for some existing market, it is better to create some new markets (what is called a “blue ocean“). By creating a new market, the competition becomes irrelevant and you may easily get many new customers rather than fighting for a small part of an existing market. Thus, instead of trying to compete with some very well established manufacturer in a very competitive market (a “red ocean“), it is more worthy to start a new market (a “blue ocean”). This could be for example, a new type of pens that has some additional features.
Now let me explain how this strategy is relevant for academia.
In general, there are two main types of research projects:
a researcher try to provide a solution to an existing research problem,
the researcher works on a new research problem.
The first case can be seen as a red ocean, since many researchers may be already working on that existing problem and it may be hard to publish something better. The second case is a blue ocean, since the researcher is the first one to work on a new topic. In that case, it can be easy to publish something since you do not need to do something better than other people, since you are the first one on that topic.
For example, I work in the field of data mining. In this field, many researchers work on publishing faster or more memory efficient algorithms for existing data mining problems. Although this research is needed, it can be viewed in some cases as lacking originality, and it can be very competitive to publish a faster algorithm. On the other hand, if researchers instead work on proposing some new problems, then the research appears more original, and it becomes much more easy to publish an algorithm as it does not need to be more efficient than some previous algorithms. Besides, from my observation, top conferences/journal often prefer papers on new problems to incremental work on existing problems.
Thus, it is not only easier to provide a solution to new research problem, but top conferences in some fields at least put a lot of value on papers that address new research problems. Thus, why fighting to be the best on an existing research problem?
Of course, there are some exceptions to this idea. If a researcher succeeds to publish some exceptional paper in a red ocean (on an existing research problem), his impact may actually be greater. This is especially if the research problem is very popular. But the point is that publishing in a red ocean may be harder than in a blue ocean. And of course, not all blue oceans are equal. It is thus also important to find some good idea for new research topics (good blue oceans).
Personally, for these reasons, I generally try to work on “blue ocean” research projects.
Conclusion
In this blog post, I have discussed how the “Blue Ocean Strategy” and how it can be applied in academia to help in publishing in topconferences/journals. Of course, there are also a lot of other things to consider to write a good paper. You can read the follow up blog post on this topic here, where the opportunity cost of research is discussed.
If you like this blog and want to support it, please share it on social networks (Twitter, LinkedIn, etc.), write some comments, and continue reading other articles on this blog. 🙂
In the data science and data mining communities, several practitioners are applying various algorithms on data, without attempting to visualize the data. This is a big mistake because sometimes, visualizing the data greatly helps to understand the data. Some phenomena are obvious when visualizing the data. In this blog post, I will give a few examples to convince you that visualization can greatly help to understand data.
An example of why using statistical measures may not be enough
The first example that I will give is a the Francis Anscombe Quartet. It is a set of four datasets consisting of X, Y points. These four datasets are defined as follows:
Dataset I
Dataset II
Datset III
Dataset IV
x
y
x
y
x
y
x
y
10.0
8.04
10.0
9.14
10.0
7.46
8.0
6.58
8.0
6.95
8.0
8.14
8.0
6.77
8.0
5.76
13.0
7.58
13.0
8.74
13.0
12.74
8.0
7.71
9.0
8.81
9.0
8.77
9.0
7.11
8.0
8.84
11.0
8.33
11.0
9.26
11.0
7.81
8.0
8.47
14.0
9.96
14.0
8.10
14.0
8.84
8.0
7.04
6.0
7.24
6.0
6.13
6.0
6.08
8.0
5.25
4.0
4.26
4.0
3.10
4.0
5.39
19.0
12.50
12.0
10.84
12.0
9.13
12.0
8.15
8.0
5.56
7.0
4.82
7.0
7.26
7.0
6.42
8.0
7.91
5.0
5.68
5.0
4.74
5.0
5.73
8.0
6.89
To get a feel of the data, the first thing that many would do is to calculate some statistical measures such as the mean, average, variance, and standard deviation. This allows to measure the central tendency of data and its dispersion. If we do this for the four above datasets, we obtain:
Dataset 1: mean of X = 9, variance of X= 11, mean of Y = 7.5, variance of Y = 4.125 Dataset 2: mean of X = 9, variance of X= 11, mean of Y = 7.5, variance of Y = 4.125 Dataset 3: mean of X = 9, variance of X= 11, mean of Y = 7.5, variance of Y = 4.125 Dataset 4: mean of X = 9, variance of X= 11, mean of Y = 7.5, variance of Y = 4.125
So these datasets appears quite similar. They have exactly the same values for all the above statistical measures. How about calculating the correlation between X and Y for each dataset to see how the points are correlated?
Ok, so these datasets are very similar, isn’t it? Let’s try something else. Let’s calculate the regression line of each dataset (this means to calculate the linear equation that would best fit the data points).
Dataset 1: y = 3.00 + 0.500x Dataset 2: y = 3.00 + 0.500x Dataset 3: y = 3.00 + 0.500x Dataset 4: y = 3.00 + 0.500x
Again the same! Should we stop here and conclude that these datasets are the same?
This would be a big mistake because actually, these four datasets are quite different! If we visualize these four datasets with a scatter plot, we obtain the following:
Visualization of the four datasets (credit: Wikipedia CC BY-SA 3.0)
This shows that these datasets are actually quite different. The lesson from this example is that by visualizing the data, difference sometimes becomes quite obvious.
Visualizing the relationship between two attributes
Simple visualizations techniques like scatter plots are also very useful for quickly analyzing the relationship between pairs of attributes in a dataset. For example, by looking at the two following scatter plots, we can quickly see that the first one show a positive correlation between the X and Y axis (when values on the X axis are greater, values on the Y axis are generally also greater), while the second one shows a negative correlation (when values on the X axis are greater, values on the Y axis are generally also smaller).
(a) positive correlation (b) negative correlation (Credit: Data Mining Concepts and Techniques, Han & Kamber)
If we plot two attributes on the X and Y axis of a scatter plot and there is not correlation between the attributes, it may result in something similar to the following figures:
No correlation between the X and Y axis (Credit: Data Mining Concepts and Techniques, Han & Kamber)
These examples again show that visualizing data can help to quickly understand the data.
Visualizing outliers
Visualization techniques can also be used to quickly identify outliers in the data. For example in the following chart, the data point on top can be quickly identified as an outlier (an abnormal value).
Identifying outliers using a scatter plot
Visualizing clusters
In data mining, several clustering algorithms have been proposed to identify clusters of similar values in the data. These clusters can also often be discovered visually for low-dimensional data. For example, in the following data, it is quite apparent that there are two main clusters (groups of similar values), without applying any algorithms.
Data containing two obvious clusters
Conclusion
In this blog post, I have shown a few simple examples of how visualization can help to quickly see patterns in the data without actually applying any fancy models or performing calculations. I have also shown that statistical measures can actually be quite misleading if no visualization is done, with the classic example of the Francis Anscombe Quartet.
In this blog post, the examples are mostly done using scatter plots with 2 attributes at a time, to keep things simple. But there exists many other types of visualizations.
— Philippe Fournier-Viger is a professor of Computer Science and also the founder of the open-source data mining software SPMF, offering more than 120 data mining algorithms.
In this blog post, I will give an introduction to sequential pattern mining, an important data mining task with a wide range of applications from text analysis to market basket analysis. This blog post is aimed to be a short introduction. If you want to read a more detailed introduction to sequential pattern mining, you can read a survey paper that I recently wrote on this topic.
What is sequential pattern mining?
Data mining consists of extracting information from data stored in databases to understand the data and/or take decisions. Some of the most fundamental data mining tasks are clustering, classification, outlier analysis, and pattern mining. Pattern mining consists of discovering interesting, useful, and unexpected patterns in databases Various types of patterns can be discovered in databases such as frequent itemsets, associations, subgraphs, sequential rules, and periodic patterns.
The task of sequential pattern mining is a data mining task specialized for analyzing sequential data, to discover sequential patterns. More precisely, it consists of discovering interesting subsequences in a set of sequences, where the interestingness of a subsequence can be measured in terms of various criteria such as its occurrence frequency, length, and profit. Sequentialpatternmining has numerous real-life applications due to the fact that data is naturally encoded as sequences of symbols in many fields such as bioinformatics, e-learning, market basket analysis, texts, and webpage click-stream analysis.
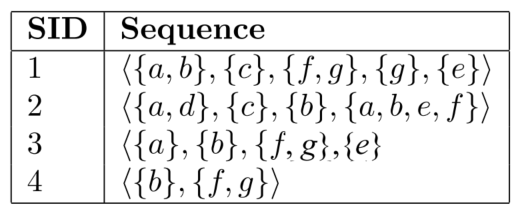
I will now explain the task of sequential pattern mining with an example. Consider the following sequence database, representing the purchases made by customers in a retail store.
This database contains four sequences. Each sequence represents the items purchased by a customer at different times. A sequence is an ordered list of itemsets (sets of items bought together). For example, in this database, the first sequence (SID 1) indicates that a customer bought some items a and b together, then purchased an item c, then purchased items f and g together, then purchased an item g, and then finally purchased an item e.
Traditionally, sequential pattern mining is being used to find subsequences that appear often in a sequence database, i.e. that are common to several sequences. Those subsequences are called the frequentsequential patterns. For example, in the context of our example, sequentialpatternmining can be used to find the sequences of items frequently bought by customers. This can be useful to understand the behavior of customers to take marketing decisions.
To do sequential pattern mining, a user must provide a sequence database and specify a parameter called the minimum support threshold. This parameter indicates a minimum number of sequences in which a pattern must appear to be considered frequent, and be shown to the user. For example, if a user sets the minimum support threshold to 2 sequences, the task of sequential pattern mining consists of finding all subsequences appearing in at least 2 sequences of the input database. In the example database, many subsequences met this requirement. Some of these sequential patterns are shown in the table below, where the number of sequences containing each pattern (called the support) is indicated in the right column of the table.
Note that the pattern <{a}, {f, g}> could also be put in this table, as well as the pattern <{f, g},{e} >, <{a},{f, g},{e} > and <{b},{f, g},{e} > with support = 2 …(2020/03)
For example, the patterns <{a}> and <{a}, {g}> are frequent and have a support of 3 and 2 sequences, respectively. In other words, these patterns appears in 3 and 2 sequences of the input database, respectively. The pattern <{a}> appears in the sequences 1, 2 and 3, while the pattern <{a}, {g}> appears in sequences 1 and 3. These patterns are interesting as they represent some behavior common to several customers. Of course, this is a toy example. Sequentialpatternmining can actually be applied on database containing hundreds of thousands of sequences.
Another example of application of sequentialpatternmining is text analysis. In this context, a set of sentences from a text can be viewed as sequence database, and the goal of sequentialpatternmining is then to find subsequences of words frequently used in the text. If such sequences are contiguous, they are called “ngrams” in this context. If you want to know more about this application, you can read this blog post, where sequential patterns are discovered in a Sherlock Holmes novel.
Can sequential pattern mining be applied to time series?
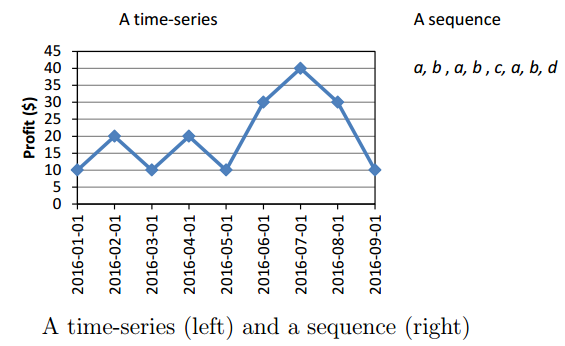
Besides sequences, sequential pattern mining can also be applied to time series (e.g. stock data), when discretization is performed as a pre-processing step. For example, the figure below shows a time series (an ordered list of numbers) on the left. On the right, a sequence (a sequence of symbols) is shown representing the same data, after applying a transformation. Various transformations can be done to transform a time series to a sequence such as the popular SAX transformation. After performing the transformation, any sequentialpatternmining algorithm can be applied.
Where can I get Sequential pattern mining implementations?
To try sequentialpatternmining with your datasets, you may try the open-source SPMF data mining software, which provides implementations of numerous sequential pattern mining algorithms: https://www.philippe-fournier-viger.com/spmf/
It provides implementations of several algorithms for sequentialpatternmining, as well as several variations of the problem such as discovering maximal sequential patterns, closed sequential patterns and sequential rules.Sequential rules are especially useful for the purpose of performing predictions, as they also include the concept of confidence.
What are the current best algorithms for sequential pattern mining?
There exists several sequentialpatternmining algorithms. Some of the classic algorithms for this problem are PrefixSpan, Spade, SPAM, and GSP. However, in the recent decade, several novel and more efficient algorithms have been proposed such as CM-SPADE and CM-SPAM (2014), FCloSM and FGenSM (2017), to name a few. Besides, numerous algorithms have been proposed for extensions of the problem of sequentialpatternmining such as finding the sequential patterns that generate the most profit (high utility sequentialpatternmining).
In this blog post, I have given a brief overview of sequential pattern mining, a very useful set of techniques for analyzing sequential data. If you want to know more about this topic, you may read the following recent survey paper that I wrote, which gives an easy-to-read overview of this topic, including the algorithms forf sequentialpatternmining, extensions, research challenges and opportunities.
Fournier-Viger, P., Lin, J. C.-W., Kiran, R. U., Koh, Y. S., Thomas, R. (2017). A Survey of Sequential Pattern Mining. Data Science and Pattern Recognition, vol. 1(1), pp. 54-77.
— Philippe Fournier-Viger is a professor of Computer Science and also the founder of the open-source data mining software SPMF, offering more than 120 data mining algorithms.
In this blog post, I will discuss an important question for young researchers, which is: Is it better to try to writemorepapers or to try to write fewer but betterpapers? In other words, what is more important: quantity or quality in research?
To answer this question, I will first explain why quantity and quality are important, and then I will argue that a good trade-off needs to be found.
Quantity
There are several reasons why quantity is important:
Quantity shows that someone is productiveand can have a consistent research output. For example, if someone has published 4 papers each year during the last four years, it approximately shows what can be expected from that researcher in terms of productivity for each year. However, if a researcher has an irregular research output such as zero papers during a few years, it may raise questions about the reasons why that researcher did not writepapers. Thus writing more show to other people that you are more active.
Quantity is correlated with research impact. Even though, writing morepapers does not means that the papers are better, some studies have shown a strong correlation between the number of papers and the influence of researchers in their field. Some of reasons may be that (1) writing morepapers improve your visibility in your field and your chances of being cited, (2) if you are more successful, you may obtain more resources such as grants and funding, which help you to writemorepapers, and (3) writing more may improve your writing skills and help you to writemore and betterpapers.
Quantity is used to calculate various metrics to evaluate the performance of researchers. In various countries and institutions, metrics are used to evaluate the research performance of researchers. These metrics include for example: the number of papers and the number of citations. Although metrics are imperfect, they are often used for evaluating researchers because they allow to quickly evaluate a researcher without reading each of his publications. Metrics such as the number of citations are also used on some website such as Google Scholar to rank articles.
Quality
The quality of papers is important for several reasons:
Quality shows that you can do excellent research. It is often very hard to publish in top level journals or conferences. For example, some conferences have an acceptance rate of 5 % or even less, which means that out of 1000 submitted papers, only 50 are accepted. If you can get some papers in top journals and conferences, it shows that you are among the best researchers in your field. On the contrary, if someone only publish papers in weak and unknown journals and conferences, it will raise doubts about the quality of the research, and about his ability at doing research. Publishing in some unknown conference/journals can be seen as something negative that may even decrease the value of a CV.
Quality is also correlated with research impact. A paper that is published in a top conference or journal has more visibility and therefore has more chance of being cited by other researchers. On the contrary, papers published in small or unknown conferences have more chance of not being cited by other researchers.
A trade-off
So what is the best approach? In my opinion, both quantity and quality are important. It is especially important to write several papers for young researchers to kickstart their career and fill their CV to apply for grants and obtain their diplomas. But having some qualitypapers is also necessary . Having a few good papers in top journals and conferences can be worth much more than having many papers in weak conferences. For example, in my field, having a paper in a conference like KDD or ICDM could be worth more than 5 or 10 papers in smaller conferences. But the danger of putting too much emphasis on quality is that the research output may become very low if the papers are not accepted. Thus, I believe that the best approach is to use a trade-off: (1) once in a while write some very high qualitypapers and try to get them published in top journals and conferences, (2) but sometimes writepapers for easier journals and conference to increase the overall productivity, and get some papers published.
Actually, a researcher should be able to evaluate whether a given research project is suitable for a high level conference/journal or not based on the merit of the research, and whether the research needs to be published quickly (for very competitive topics). Thus, a researcher should decide for each paper whether it should be submitted to a high level conference/journal or something easier.
But, there should always be a minimum quality requirement for papers. Publishing bad papers or publishing very weak papers can have a negative influence on your CV and even look bad. Thus, even when considering quantity, one should ensure that a minimum quality requirement is met. For example, since my early days as researchers, I have set a minimum quality requirements that all my papers be at least published by a well-known publisher among ACM, IEEE, Springer, Elsevier, and be indexed in DBLP (an index for computer science). For me, this is the minimum quality requirement but I will often aim at good or excellent confernce/journal depending on the projects.
Hope that you have enjoyed this post. If you like it, you can continue reading this blog, and subscribe to my Twitter ( @philfv ).
— Philippe Fournier-Viger is a professor of Computer Science and also the founder of the open-source data mining software SPMF, offering more than 120 data mining algorithms.
Many researchers are usingMicrosoft Word for writing research papers. However, Microsoft Word has several problems or limitations. In this blog post, I will discuss the use of LaTeX as an alternative to Microsoft Word for writing research papers.
What is LaTeX?
LaTeX is a document preparation system, proposed in the 1980s. It is used to create documents such as researchpapers, books, or even slides for presentations.
The key difference between LaTeX and software like Microsoft Word is that Microsoft Word let you directly edit your document and immediately see the result, while usingLaTeX is a bit like programming. To write a research paper usingLaTeX, you have to write a text file with the .tex extension using a formatting language to roughly indicate how your paper should look like. Then, you can run the LaTeX engine to generate a PDF file of your research paper. The following figure illustrate this process:
In the above example, I have created a very simple LaTeX document (Example.tex) and then I have generated the corresponding PDF for visualization (Example.pdf).
Why using LaTeX?
There are several reasons why many researchers prefer LaTeX to Microsoft Word for writingresearchpapers. I will explain some of them, and then I will discuss also some problems about usingLaTeX.
Reason 1: LaTeX papers generally look better
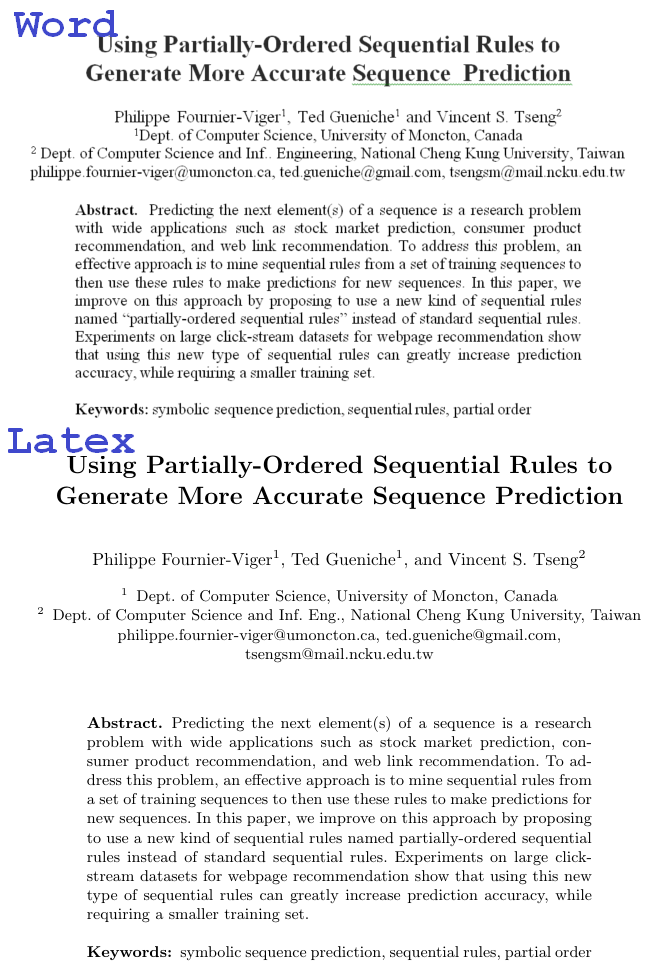
LaTeXpapers often look better than papers written using Microsoft Word. This is especially true for fields like computer science, mathematics and engineering where mathematical equations are used. To illustrate this point, I will show you some screenshots of a paper that I have written for the ADMA 2012 conference a few years ago. For this paper, I had made two versions: one using the Springer LNCS LaTeX template and the other one using the Springer LNCS Microsoft Word template.
This is the first page of the paper.
The first page is quite similar. The main difference is the font being used, which is different usingLaTeX. Personally, I prefer the default LaTeX font. Now let’s compare how the mathematical equations appears in Latex and Word.
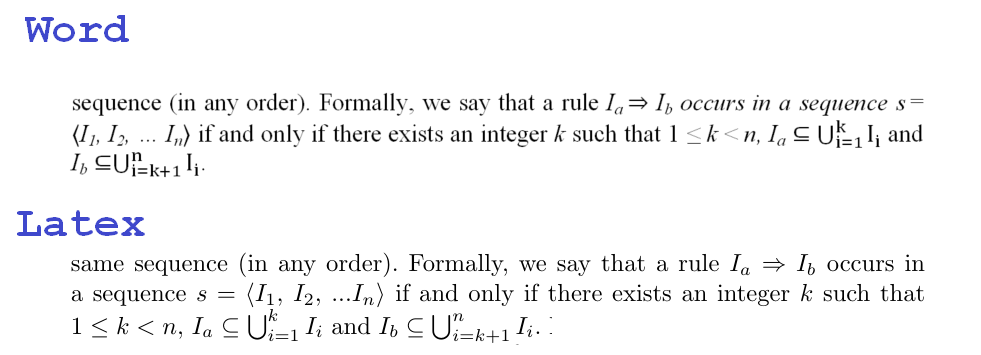
Here, we can see that mathematical symbols are more beautiful usingLaTeX. For example, the set union and the subset inclusion operators are in my opinion quite ugly in Microsoft Word. The set union operator of Word looks too much like the letter “U”. In this example, the mathematical equations are quite simple. But LaTeX really shines when displaying more complex mathematical equations, for example using matrices.
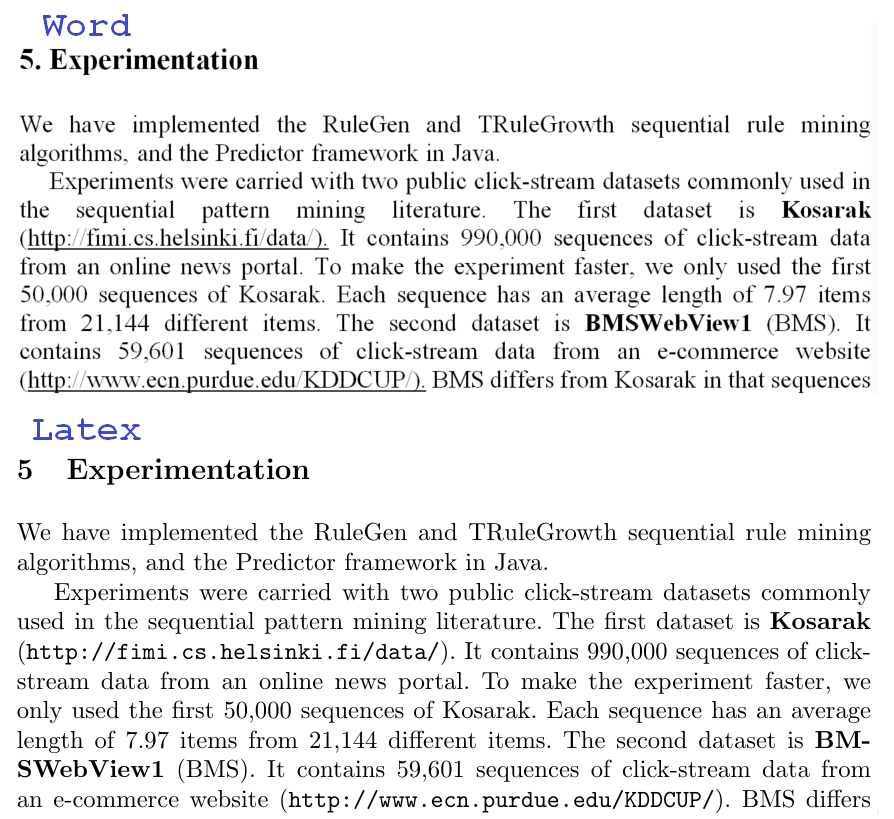
Now let’s look at another paragraph of text from the paper to further compare the appearance of Word and LaTeXpapers:
In the above picture, it can be argued that both LaTeX and Word papers look quite similar. For me, the big difference is again in the font being used. In the Springer Word template, the Times New Roman font, while LaTeX has its own default font. I prefer the LaTeX font. Also, I think that the URLs look better in LaTeXusing the url package.
Reason 2: LaTeX is available for all platforms
The LaTeX system is free and available for most operating systems, and documents will look the same on all operating systems.
To install LaTeX on your computer you need to install a LaTeX distribution such as MikTeK ( https://miktex.org/ ). After installing LaTeX, you can start working on LaTeX documents using a text editor such as Notepad. However, it is more convenient to also install an editor such as TexWorks or WinShell. Personally, I use TexWorks. This is a screenshot of my working environment using TexWorks:
I will open my LaTeX document on the left window. Then, the right window will display the PDF generated by LaTeX. Thus, I can work on the LaTeX code of my documents on the left and see the result on the right.
If you want to try LaTeX without installing it on your computer, you can use an online LaTeX editor such as ShareLatex (http://www.sharelatex.org ) or OverLeaf. Using these editors, it is not necessary to install LaTeX on your computer. I personally sometimes use ShareLatex as it also has some function for collaboration (history, chat, etc.), which is very useful when working on a research paper with other people.
Reason 3: LaTeX offers many packages
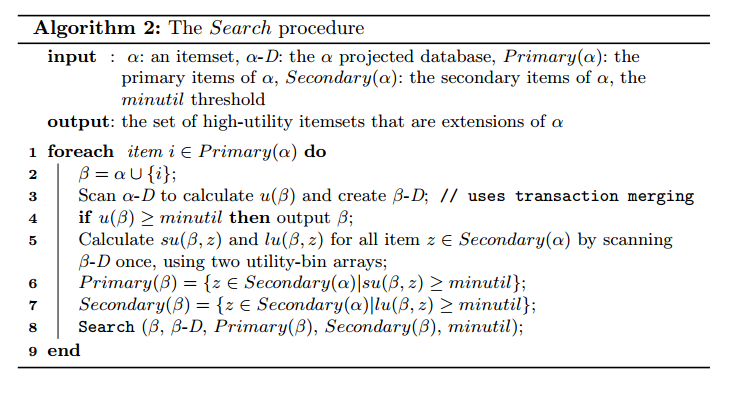
Besides the basic functionalities of LaTeX, you can install hundreds of packages to add more features to LaTeX. If you use MikTek for example, there is a tool called the “MikTek package manager” that let you choose and install packages. There are packages for about everything from packages to display algorithms to packages for displaying chessboards. For example, here is some algorithm pseudocode that I have written in one of my recent paper using a LaTeX package called algorithm2e:
As you can see the presentation of the algorithm is quite nice. Doing the same using Word would be very difficult. For example, it would be quite difficult to add a vertical line for the “for” loop using Microsoft Word.
Reason 4: You don’t need to worry about how your document will look like
When writing a LaTeX document, you don’t need to worry about how your final document will look like. For example, you don’t need to worry about where the figures and tables will appear in your document or where the page breaks will be. All of this is handled by the LaTeX engine during the compilation of your document. When writing document, you only need to use some basic formatting instructions such as indicating when a new section starts in your document. This let you focus on writing.
Reason 5: LaTeX can generate and update your bibliography automatically
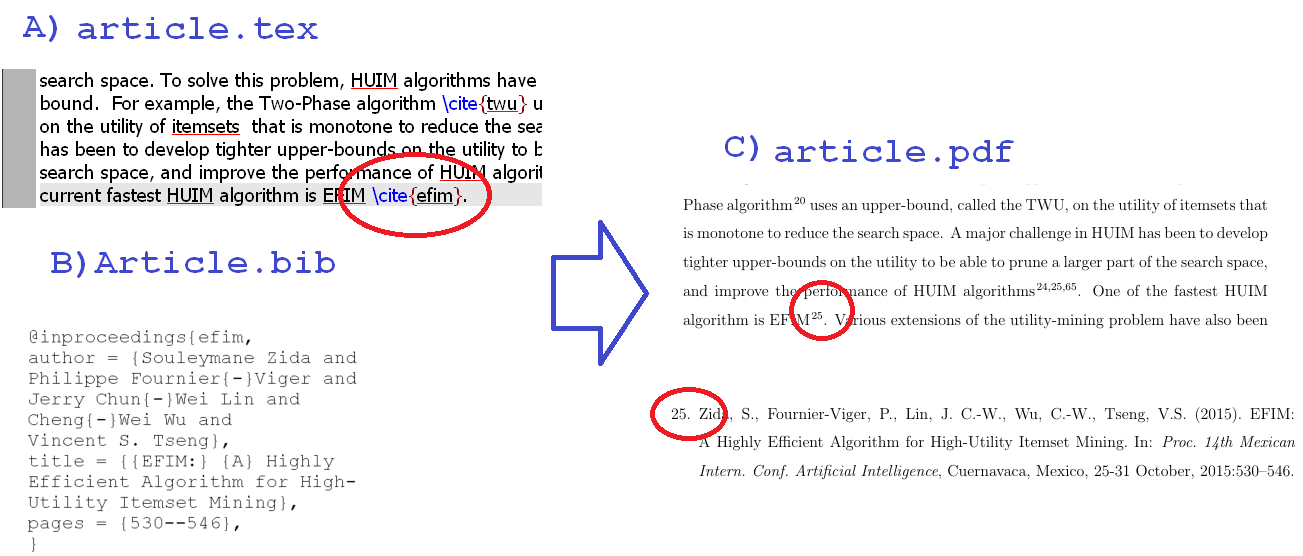
Another reason for usingLaTeX is that it can generate the bibliography of a document automatically. There are different ways of writing a bibliography usingLaTeX. One of the most common way is to use a .bib file. A .bib file provide a list of references that can be used in your document. Then, you can use these references in your .tex document using the \cite{} command and the bibliography will be automatically generated.
I will illustrate this with an example:
A), I have created a Latex document (a .tex file) where I cite a paper called “efim” using the LaTeX command \cite{efim}.
B) I have created a corresponding LaTeXbib file that provides bibliographical information about the “efim” paper.
C) I have generated the PDF file using the .tex file and the .bib file. As you can see, the \cite{} command has been replaced by 25, and the corresponding entry 25 has been automatically generated in the correct format for this paper and added to the bibliography.
The function for generating a bibliography usingLaTeX can save a lot of time to researchers especially for documents containing many references such as thesis, books, and journal papers.
Moreover, once you have created a .bib file, you can reuse it in many different papers. And it is also very easy to change the style of your bibliography. For example, if you want to change from the APA style to the IEEE style, it can be done almost automatically, which saves lot of time.
In Microsoft Word, there is some basic tool for generating a bibliography but it provides much less features than LaTeX.
Reason 6: LaTeX works very well for large documents
LaTeX also provides many features that are useful for large documents such as Ph.D thesis and books. These features include generating tables of contents, tables of figures, and dividing a document into several files. Some of these features are also provided in Microsoft Word but are not as flexible as in LaTeX. I have personally written both my M.Sc. and Ph.D. thesis usingLaTeX and I have saved a lot of time by doing this. I have simply downloaded the LaTeX style file from my university and then used it in my LaTeX document, and after that all my thesis was properly formatted according to the university style, without too much effort.
Problems of LaTeX
Now, let’s talk about the disadvantage or problems faced usingLaTeX. The first problem is that there is a somewhat steep learning curve. LaTeX is actually not so difficult to learn but it is more difficult than using Word. It is necessary to learn various commands for preparing LaTeX documents. Moreover, some errors are not so easy to debug. However, the good news is that there exist some good places to ask questions and obtain answers when encountering problems with LaTeX such as Tex.StackExchange ( http://tex.stackexchange.com/ ). There also exist some free books such as the Not So Short Introduction To LaTeXthat are quite good for learning LaTeX, and that I use as reference. Actually, although, there is a steep learning curve, I think that it is an excellent investment to learn to use LaTeX for researchers. Moreover, some journals in academia actually only accept LaTeXpapers.
The second problem with LaTeX is that it is actually not necessary to use LaTeX for writing simple documents. LaTeX is best used for large documents or documents with complex layouts or for special needs such as displaying mathematical equations and algorithms. I personally use LaTeX only for writingresearchpapers. For other things, I use Microsoft Word. Some people also use LaTeX for preparing slides using packages such as beamer, instead of using Powerpoint. This can be useful for preparing a presentation with lot of mathematical equations.
Conclusion
In this blog post, I have discussed the use of LaTeX for writingresearchpapers. I hope that you have enjoyed this blog post.
— Philippe Fournier-Viger is a professor of Computer Science and also the founder of the open-source data mining software SPMF, offering more than 120 data mining algorithms.
In this blog post, I will discuss one of my recent and current project. I have been recently working with my colleague Chun-Wei Lin on launching a new journal, titled “Data Science and Pattern Recognition“.
This is a new open-access journal, with a focus on data science, big data, and pattern recognition. The journal will be published by the Taiwanese publisher Ubiquitous International, which already publishes several SCI journals. In the next year, we will be pushing hard to make this journal a high level journal. For this purpose, we have worked hard on creating an outstanding editorial board with world-class researchers in the fields of data science and pattern recognition.
It is our goal to make the journal EI and SCI indexed in the next years. Currently, there is no publication fee for publishing in this journal, to help support the journal initially. But there should be some in the future, since it is an open-access journal. Thus, it is a good time to submit your papers, now!
The first issue, will be published around March 2017 with 6 papers, and there will be 4 issues per year, for a total of approximately 24 papers per year. In the first issue, I will publish a survey paper on pattern mining that I have been working on recently, among several other good papers.
If you have any question about the journal, you can have a look at the website, let me know directly, or use the contact e-mail on the journal website.
— Philippe Fournier-Vigeris a professor of Computer Science and also the founder of theopen-source data mining software SPMF,offering more than 120 data mining algorithms.
In this blog post, I will discuss thejob of university professor. And, I will discuss why I have chosen to become one. This post is especially aimed at students who are considering working in academia after their Ph.D.
What is the job of university professor?
When I was an undergraduate student, I did not know much about what the professors were really doing at my university beside teaching. In general, there are three main tasks that a professor must do:
Teaching. This consists of teaching courses for students. This is a very important task since it is the reason for having professors in universities. The numbers of courses that a professor teaches every year can vary greatly depending on the university and the rank of the professor. Some university are known to put more emphasis on research, while other put more emphasis on teaching. When I was working as a professor in Canada, I first started with about 220 hours (5 courses) / year, which did not give me much free time for doing research. Then after receiving some funding and having several graduate students in my team, my teaching load was reduced to about 3 courses / year to let me do more research. Now in China, in 2016, I have taught about 100 hours.
Research. The second task that a professor must do is to carry innovative research that lead to the publication of research papers. Why a professor is doing research? Some key reasons are to attract top talents in university, and to ensure that the professors stay active and keep their knowledge up to date. Now, what is the difference between the research that a professor does and the research that a graduate student do? The main difference is that a professor is expected to carry a long-term research program and have several students carrying research in his team. It is a bit like going from the job of an employee to being a team leader or business manager, in the sense that the professor has to manage not only his own research projects but generally also the research of a team, and have a clear plan for the next years to come. Many of the tasks related to research that a professor does is related to the management of his team. For example, a professor typically has to apply for funding from the government, or find projects with companies to supply funds to his research team. This may involve writing numerous grant applications and attend many meetings.
Service to the community. The third task that a professor must do is to provide service to the community. This can be various activities at the university level, national level, or international level. For example, when I was a professor in Canada, I was involved in a programming competition for high schools, and recruiting students for our university. I also helped to organize a LAN party for students every year, and other activities with students. Another task that I was doing was to evaluate the applications of the master degree students applying to the university in our program. This latter task was consuming many hours of my time every week. At a national and international level, my service to the community has included tasks such as reviewing articles for conferences and journals, being the editor ofa journal, and the founder of anopen-source data mining software.
Thus, to be a professor, one should enjoy doing these three tasks. If one only enjoys teaching but does not enjoy research, then perhaps that it is best to become a lecturer (a professor not carrying research – in the North-American system of education). Or if one only enjoy research but does not enjoy teaching, then it is probably best to become a researcher rather than a professor, and work in the industry. But there are some exceptions. Nonetheless, a professor should ideally enjoy doing all these tasks, and should do them well.
What are the advantages/disadvantages of being a professor?
As for any other jobs, there are advantages and disadvantages for choosing this job. Let’s analyze this:
Salary: Depending on the country and university, the salary of a university professor can be quite high. But it is generally lower than working as a researcher in the industry. Thus, the motivation should not be only about money.
Schedule: One of the greatest advantage and disadvantage of being a professor is the work schedule. A professor may be extremely busy. He may have to work during week-ends, evenings, and often more than 10 hours a day to keep up with research, teaching and other tasks. The first few years of being a professor can be really hard in terms of schedule. The reason is that a new professor typically has to teach, prepare many new courses and apply for funding, and setup his research team. This is quite different from the life of a Ph.D student who often can concentrate on only doing research. After a few years, the job of a professor becomes easier. However,although the schedule of a professor is very busy, whatI like aboutitis the freedom about how to organize my time. A professor may typically decide to work at home if he is not teaching and may decide to wake up late but finish working late a night. This is different from working in a company.
Traveling: Another thing that I like about being a professor is the opportunity for traveling. A professor typically has to attend international conferences to present his research and meet other researchers, and may also visit other universities for collaborations. This is interesting from the research perspective. But it is also interesting from a personal perspective. Of course, it depends on the funding. Not every professor has funding for attending international conferences and travelling.
Beingyour own boss: Another advantage of being a professor is that a professor generally has a lot of freedom for the topic of his research. A professor may decide to work on topics that he like rather than work on the projects of other people (as someone would typically do, when working in a company). I often think of being a professor as someone running a business. The professor mustdecide of the research directions and manage his team. I enjoy this freedom of being able to work on the topics that I like, and also to publishthe result of my research freely as open-source programs that can benefit anyone.
What is required to become a university professor?
In terms of academic skills, good universities require to have a Ph.D. degree. But having a PhD. is often not enough. It is also generally required to have several publications in good conferences and journals. Now, if we analyze this in more details, a professor should have the following skills:
teaching: A professor must be able to explain concepts in simple ways, clearly, and concisely so that students can learn efficiently. A professor must also be able to make the classes enjoyable rather than boring, and prepare their courses well, assignments and exams.
Carrying research: A professor must be good at doing research. This includes being able to find interesting research questions and findinnovationsolutions to solve these problems.
writing: A professor must also be good at writing. This is important as a professor must write journal papers, conference papers, grant applications, and many other documents. Being good at writing is related to being good at teaching, since writing often requires to explain concepts in simple ways so that the reader can understand (just like teaching).
Managing a team/sociability:A professorshouldbe able to manage a team and also ideally establish collaborations with other researchers. Thus some management and social skills are required.
Being good in his field: A professor must also be good in his field of study. For example, for the field of computer science, a professor should ideally also be a good programmer. This is different from being a good researcher, as a good programmer is not necessarily a good researcher, and a good researcher is not necessarily a good programmer.
Being a workaholic 😉: actually, not everybody can work or likes to work 10 hours or more every day. And also not every professor work very hard but to become a professor it still generally requires a huge amount of work. And the first years of being a professor can be quite hard. When I was an undergraduate student,I saw it as achallenge for me to see how far I would be able to go into academia, and since I like working, the amount of work did not put me away. I have worked very hard in the last 10 years .For example, during my studies, I typically justtooka few days off during a whole year, and worked every day from the morning until the evening. For me, it is worth it.
It might seem like a long list of skills to have. But actually, all these skills can be developed over time. When I was an undergraduate students for example, I did not know how to write well. I remember that the first paper that I attempted to write by myself during my master degree was quite terrible. Over the years during my master’s degree and Ph.D., I have greatly improved my writing skills by practicing writing many papers. I also greatly improved my research skills, and teaching skills. In terms of teaching, it requires some practice and dedication to become a good teacher.
Conclusion
So why did I choose to become a professor? The short answer is that I really like research and the freedom of doing my own research. I also liketo be able to manage my schedule, travelling, and I also enjoy teaching. Would I move to the industry someday? No. Even if I could probably earn more in the industry, I am happy to do what I am doing in academia.
If you have enjoyed reading this blog post, you can continue reading this blog, which has many other posts related to academia and data mining.
Philippe Fournier-Vigeris a professor of Computer Science and also the founder of theopen-source data mining software SPMF,offering more than 120 data mining algorithms.
In this blog post, I will introduce the populardata miningtask ofclustering (also called cluster analysis). I will explain what is the goal of clustering, and then introduce the popularK-Meansalgorithm with an example. Moreover, I will briefly explain how an open-source Java implementation of K-Means,offered in theSPMFdata mining librarycan be used.
What is clustering?
Clusteringis one of the most fundamental data mining tasks.
Consider that you have adatabase, containing several records (which we will call instances). For example, consider the following database describing several bank customers.
AGE     NATIONALITY    INCOME   GENDER   ACCOUNT_BALANCE  ...
25      Canada          3000     M         50
42      Brazil          4000     F         500
...
In this example, each instance (customer) is described according to some attributes such as age, nationality, income, gender,and account_balance.
Thegoal of clusteringis toautomatically find groups of instances(e.g. customers)that are similar in a database. For example, for the database of bank customers, clustering the customers, consists of automatically grouping the customers that have a similar profile. For example, a clustering algorithm could perhaps find that many female customers who are rich have a similar profile or that many young Canadians with a low income have a similar profile (this is just an example).
Thus, the goal of clustering is to find groups of instances having similar characteristics in a database. These groups of instances found by clustering are calledclusters. Thus, the goal of clustering is to find clusters of similar instances.
Let’s have a look at a second examplebefore giving a more formal definition of what is clustering. This time, we will considera database of 2D points. Consider the following database containing31 two dimensional points.
Instance 1
(1,1)
Instance 17
(16, 16)
Instance 2
(0,1)
Instance 18
(11.5, 8)
Instance 3
(1,0)
Instance 19
(13, 10)
Instance 4
(11,12)
Instance 20
(12, 13)
Instance 5
(11, 13)
Instance 21
(14, 12.5)
Instance 6
(13, 13)
Instance 22
(14.5, 12.5)
Instance 7
(12, 8.5)
Instance 23
(14.5, 11.5)
Instance 8
(13, 8)
Instance 24
(15, 10.5)
Instance 9
(13, 9)
Instance 25
(15, 9.5)
Instance 10
(13, 7)
Instance 26
(12, 9.5)
Instance 11
(11, 7)
Instance 27
(10.5, 11)
Instance 12
(8, 2)
Instance 28
(10, 10.5)
Instance 13
(9, 2)
Instance 29
(9, 3)
Instance 14
(10, 1)
Instance 30
(9, 4)
Instance 15
(7, 13)
Instance 31
(9,5)
Instance 16
(5, 9)
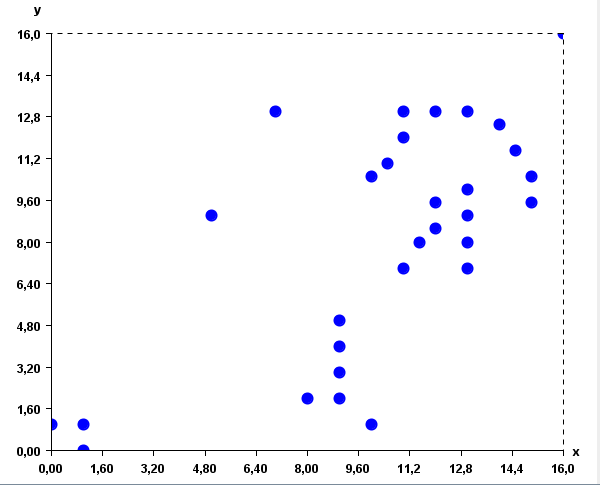
Each instance (point) in this database is described by two attributes: the X and Y coordinates. This database can be represented visually usually a XY chart:
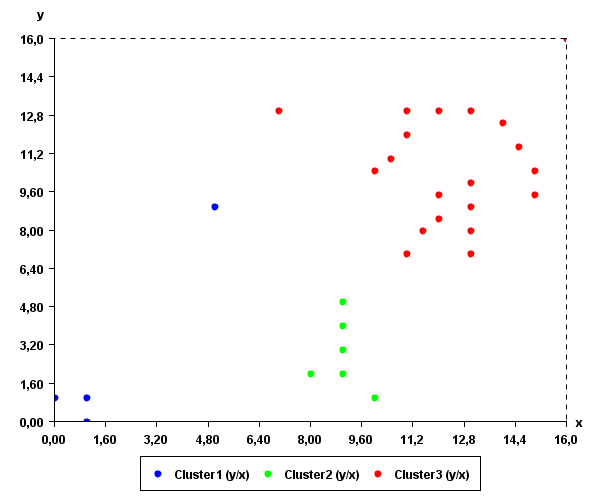
It can be observed in these figures that some points are quite close, while some other points are quite far away. In this context, the goal of clustering is to find groups of points that are similar (close to each other). By applying aclustering algorithmsuch asK-Means, three clusters could be found (represented by the blue, red and green colors):
Intuitively, these clusters somewhat make sense as they are groups of points that are close to each other.
Clustering has many applications. It can be used for example to cluster similar documents in categories (for example, automatically classifying news on a website into categories).
Clustering algorithms
To perform clustering, it is necessary to apply aclustering algorithm. There exists hundreds of clustering algorithms to find hidden clusters in data. Different algorithms have different advantages and disadvantages and can be more or less suitable to different types of data. Some of the most popular algorithms are for exampleK-MeansandDBScan.
In the following paragraphs, I will briefly explain how the K-Means algorithms works.
The K-Means algorithm
TheK-Means algorithmwas proposed in 1967 by MacQueen. This algorithm has two main parameters: (1) a database, (2) a positive integer Krepresenting the number of clusters to be extracted from the database.
TheK-Meansalgorithmconsists of thefollowing steps:
(1) The algorithm reads the database in memory. The database contains several instances.
(2) The algorithm initializeKempty clusters. Each cluster has aprototype, which is a randomly generated instance.
(3) Each instance in the database is assigned to the cluster having the closest prototype.
(4) Then, the prototype of each cluster is recomputed as the average of all the instances in that cluster.
(5) Then, Step3 and Step 4 are repeated several times, until the clusters become stable.
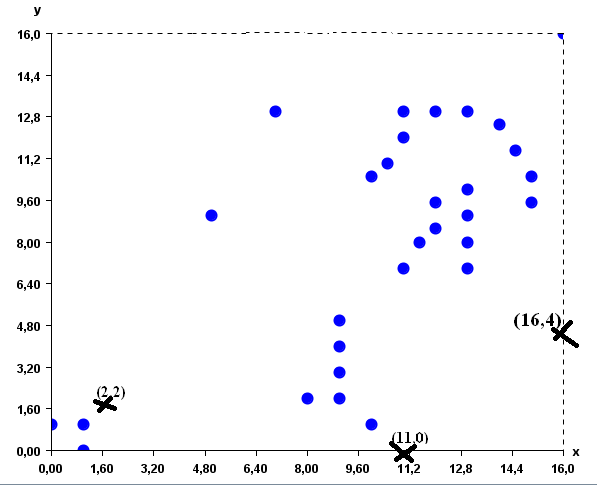
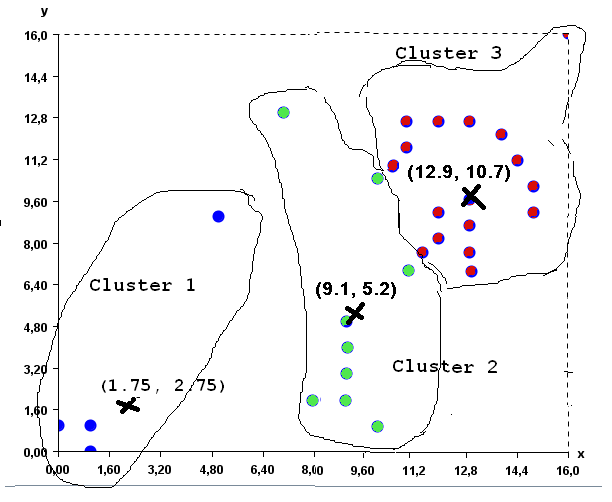
Now let me illustrate these steps withan exampleso that it becomes clear. By applyingK-Meanson the database of 2D points, (1) K-Means will first load the database of 31 points in memory. Then, assume that the user has set K = 3 to generate 3 clusters. (2)K-Meanswill initially createthree empty clusterswhich will have some random points as prototypes. Let say that thesethree points (prototypes) are (2,2), (16, 4) and (11, 0) . We can represent this visually as follows (where the prototypes are represented by the X symbol):
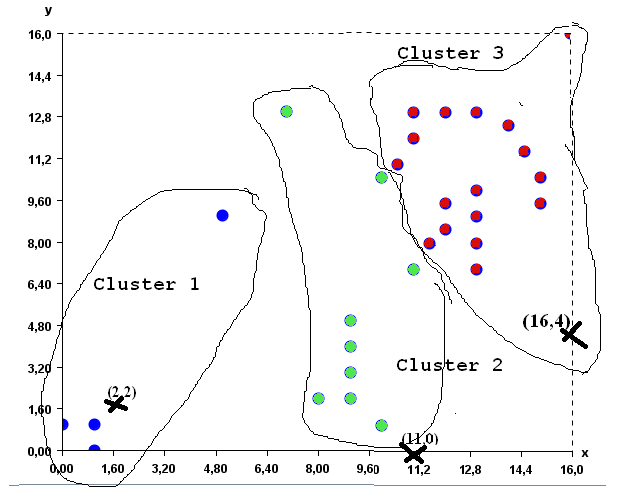
Then (3) K-means will assign each of the 31 points to the cluster having the closest prototype. The result will be as follows:
Then (4) the prototype of each cluster is recomputed as the average of the points that it contains. The new prototypes are approximately (1.75, 2.75), (9.1, 5.2) and (12.9, 10.7) for the three clusters of points.
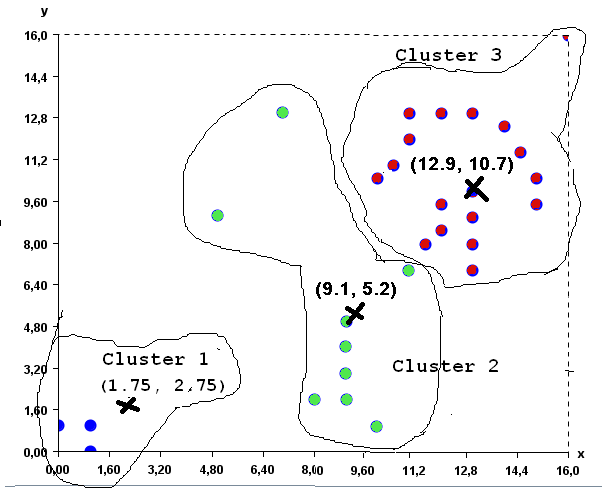
Then (3), each point is assigned to the cluster having the closest prototype. The result is the clusters shown in the picture below. As you can see, some points have moved from one cluster to another.
Then, step (4) is applied again to recompute the prototype of each cluster as the average of its points. The new prototypes are (0.7, 0.7), (12.4,10.8) and (8.7,4.1).
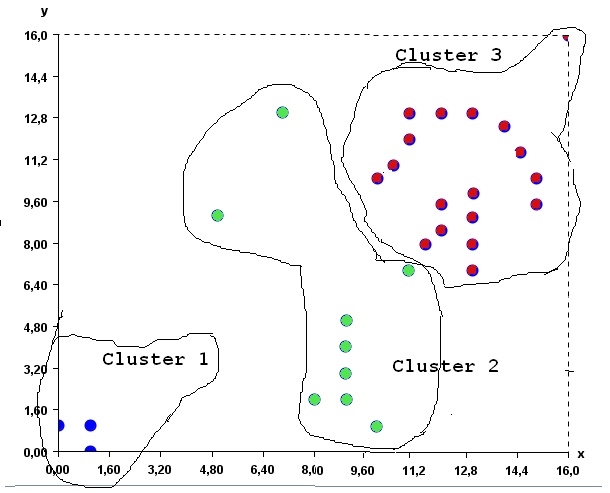
Then step (3) is applied again. K-Means assignseach point to the cluster having the closest prototype. Since the cluster did not change after this step, the K-Means algorithms stop and the final result is the following three clusters, here displayed with colors:
An open-source Java implementation of K-Means
If you want to try the K-Means algorithm with the above example by yourself, aJava implementation of K-Means is provided in theSPMF library.
To run the example, you will need to haveJava 1.8or higher installed on your computer.
(1) The first step is to download the database of points, which can be obtained here:
(2) Then, you will need to download the release version of SPMF, which is a file calledspmf.jar,and can be obtained from thedownload page of SPMF.
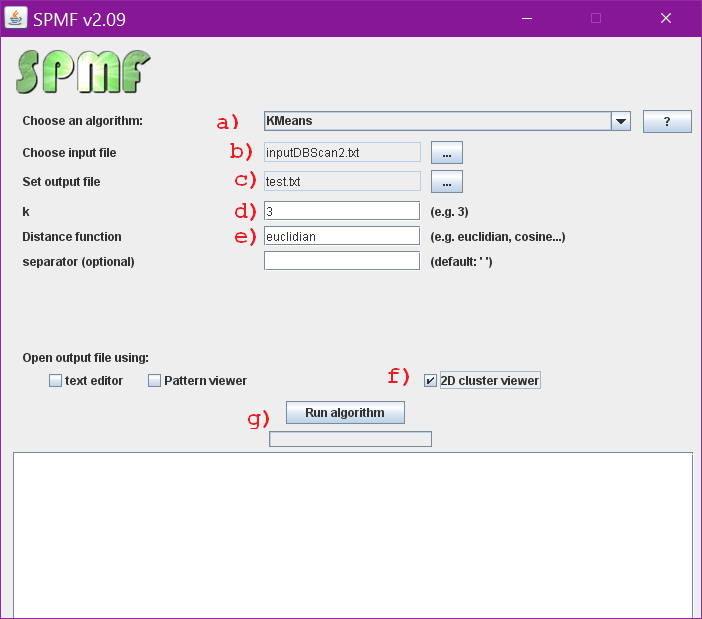
(3) Then, double-click on the filespmf.jarto launch SPMF. If it does not work, it means that there is a problem with the Java installation on your computer. If it works correctly, the user interface of SPMF should open:
(A) choose theKMeans algorithmin the combo box.
(B) choose the input file as “inputDBScan2.txt”
(C) set the output file as “text.txt”. The output of the algorithm will be written to that file.
(D) Set the parameter K to 3
(E) To be able to calculate how similar the instances are close to each other, we need to specify a distance function. For this example, we should use theEuclidian distance, as it is the typical distance function for comparing 2D points.
(F) Select the “cluster viewer” to see the results as a chart.
(G) Click the “Run algorithm” button” to launch theK-Meansalgorithm.
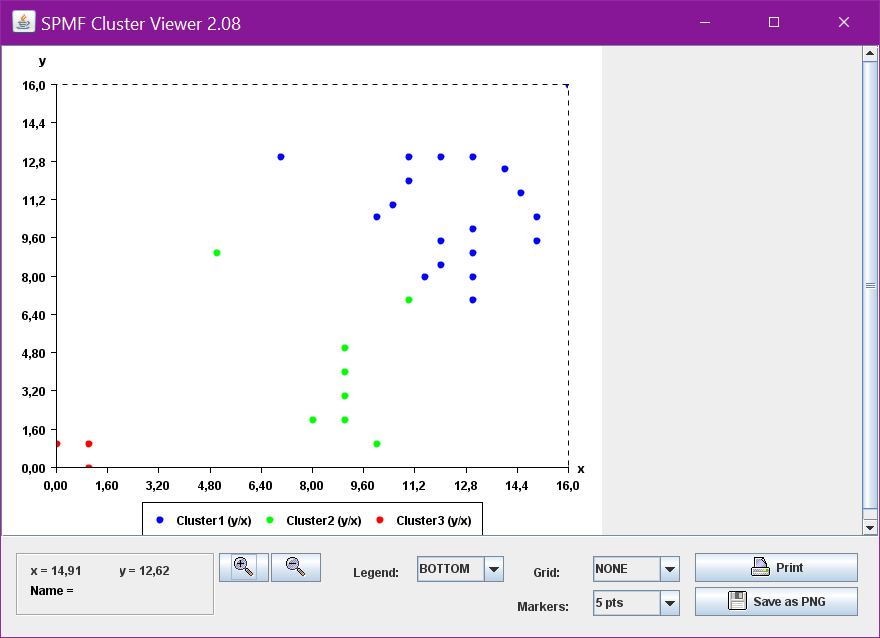
The result will be displayed in a window, such as this:
Note that it is quite possible that the result that you will obtain is not exactly the same. The reason is thatK-Meansis a randomized algorithm. In other words, K-Means utilize random numbers. Thus, if K-Means is run several times, it may not always generate the same result.
Why is the K-Means algorithm popular?
Having presented the K-Means algorithm, let’s now briefly discuss its characteristics in more details. Why is K-Means popular? The main reason is that it is a very simple algorithm. It is easy to implement and also easy to understand.
Some drawback of theK-Meansalgorithms is that the final result depends on how the initialprototypesare selected randomly. If we are lucky, we may find some nice clusters as in the above example, that somewhat make sense. However, if the initial points are not chosen in an appropriate way, the result may not be meaningful. There exists various solutions to this problem such as runningK-Meansseveral times, and then to choose the best set of clusters.
Another limitation ofK-Meansis that the user must explicitly specify the number of clusters to be found (the K parameter). But finding the best value for the K parameter may require to try several values.
To address these limitations various extensions ofK-Meanshave been proposed. Besides, many other clustering algorithms have been proposed.
Conclusion
This blog post has given an overview of the task ofclustering, a fundamental data mining task. The goal was to give a simple introduction. The post has explained how theK-Meansalgorithm works and has shown how to use theSPMFimplementation of K-Means. In a future blog post, I will explain theDBScan clustering algorithm, which is also offered in SPMF.
For the interested reader, a good introduction to clustering can be found in the book “Introduction to data mining” by Tan, Steinbach and Kumar. The first chapter about clustering is freely available here.
By the way, you can also try a demo version of k-means in your browser for teaching purpose with the K-Means demo tool.
Philippe Fournier-Vigeris a full professor and also the founder of theopen-source data mining software SPMF,offering more than 110 data mining algorithms. If you like this blog, you can tweet about it and/or subscribe to my twitter account @philfv to get notified about new posts.
This blog post briefly explain howtime series data mining can be performed with theJava open-source data mining library SPMF(v.2.06). It first explain what is a time series and then discuss how data mining can be performed on time series.
What is a time series? What is the difference with sequences?
There are two main types of sequential data considered in data mining: sequences and time series.
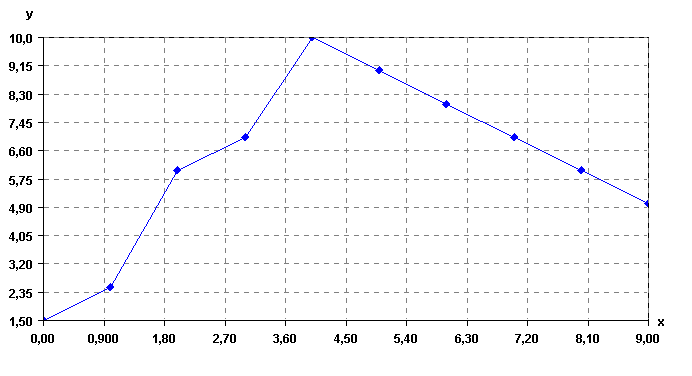
Atime-series is an ordered list of numbers. For example, the figure below shows atime-series. This time series could represent for example, temperature readings on different days, collected with sensors. Time series are also used to represent many other types of data such as stock market data.
A time series
On the other hand, asequenceis an ordered list of nominal values (symbols). For example, a sequence is shown below.
a, b, c, e, g, h, a, b, c, e
This sequence indicates that an item (symbol) a, was followed by an itemb, which was followed by an itemc, then,e, g, h, a, b, c, ande, in that order. Sequences have also many real-life applications. They can be used for example to represent sentences in texts (sequences of words), sequences of items purchased by customers in retail stores, and sequences of webpages visited by users.
How to analyze time series?
Bothtime seriesandsequencescan be analyzed usingdata mining techniquesto discover interesting patterns for understanding the data or decision-making. Sincetime seriesare a type ofnumericdata,andsequencesaresymbolicdata,the traditional techniques for analyzing time series and sequences are quite different. However, it is possible to convert time series to sequences by discretizing the time series (transforming the numbers into symbols. Then techniques for analyzing sequences can also be applied to analyze the time series.
There exists several ways of transforming time-series to sequences. One of the most popular techniques is theSAX algorithm(Lin et al., 2007). But many other techniques exist and variations. TheSPMF open-source data mining librarydiscussed in this blog post, offers a fastJava implementation of the SAX algorithm. Let’s see how it works.
Discretizing a time series
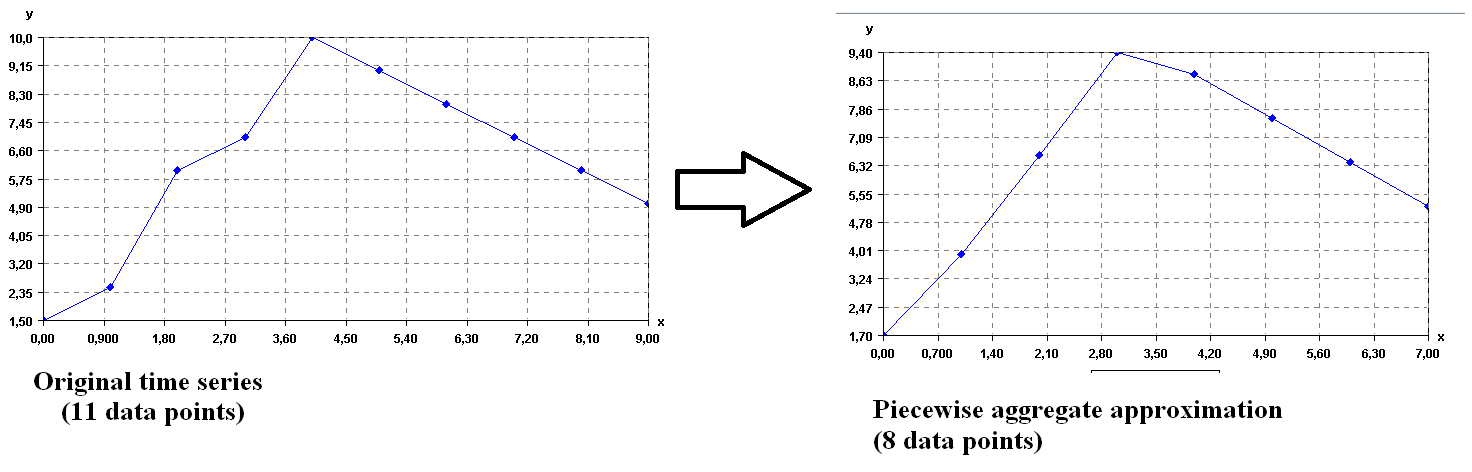
Consider the time series shown in the previous figure. It containsn=11 data points. To apply the SAX algorithm, it is necessary to specify a number of symbols wand a number of data points v. Let’s say that the number of symbols is 4 and that the number of data point is 8. The SAX algorithm will perform two steps.
First, it will convert the time series from 11 data points to 8 data points. To do this, it will split the time series into 8 segments and replace each segment by its average. This is called thepiecewise aggregate approximation (PAA)of the time series. Visually, this gives the following result.
Transforming a time series to its PAA representation
As it can be seen above, transforming a time series to its PAA representation is a way of reducing the dimensionality of a time series by reducing the number of data points.
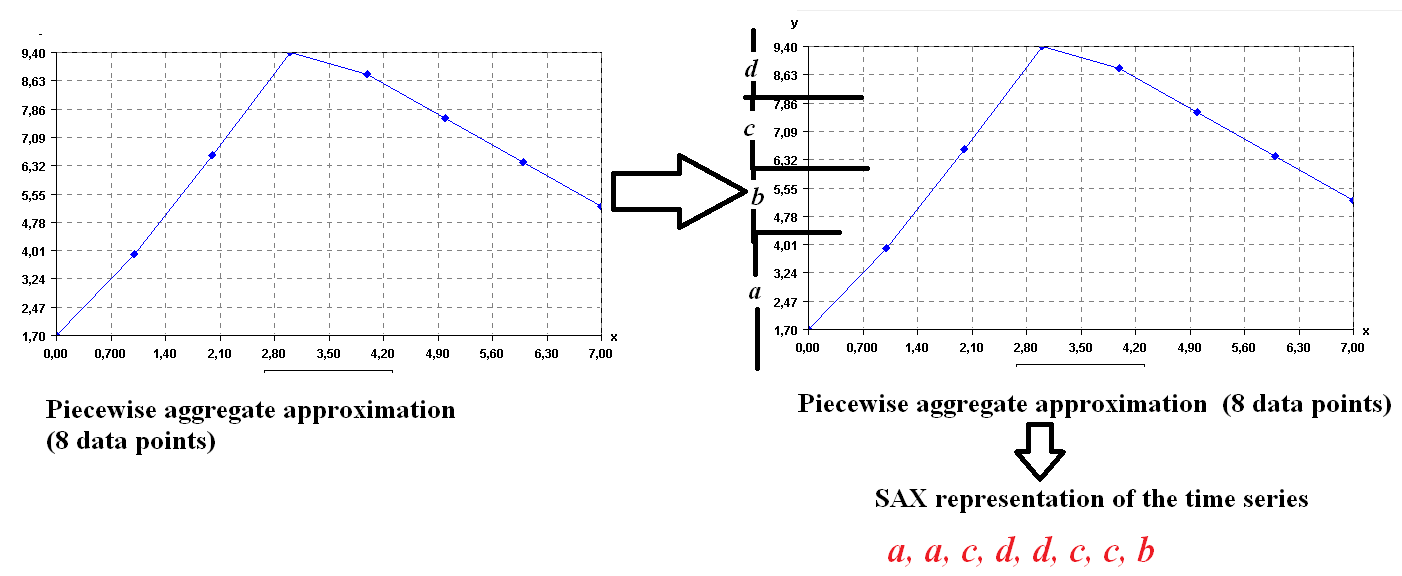
Second, the SAX algorithm transforms the PAA representation of the time series to symbols. Each data point is replaced by a symbol. The number of symbols is selected by the user (here we assume thatv = 4 symbolsfor this example). Now, the main question is how the symbols are chosen? The main idea in SAX is to assume that values follow a normal distribution and to choose the symbol to represent various intervals of values such that each interval is equally probable under the normal distribution (for more details, see the paper of Lin et al. 2007). Applying the SAX algorithm implementation of SPMF on the time series produces the following result.
Four symbols are created: a= [-Infinity, 4.50] b= [4.50, 6.2] c= [6.2, 7.90] d= [7.90,Infinity]
Then the result is a sequence of symbols: a, a, c, d, d, c, c, b. Let’s see this more visually in the following figure.
SAX representation of the time series
This sequence is the symbolic representation of the time series. Then, after a time series has been converted to a sequence, it is possible to apply traditional pattern mining algorithms on the time series.
For example, in the SPMF library, several algorithms are providing for performing data mining on sequences of symbols. However, most of them requires to have several sequences of symbols to for example find patterns common to several sequences (sequential pattern mining). If one has a single time series, this is not a problem. It is also possible to split a time series into several sequences.
Splitting a time series
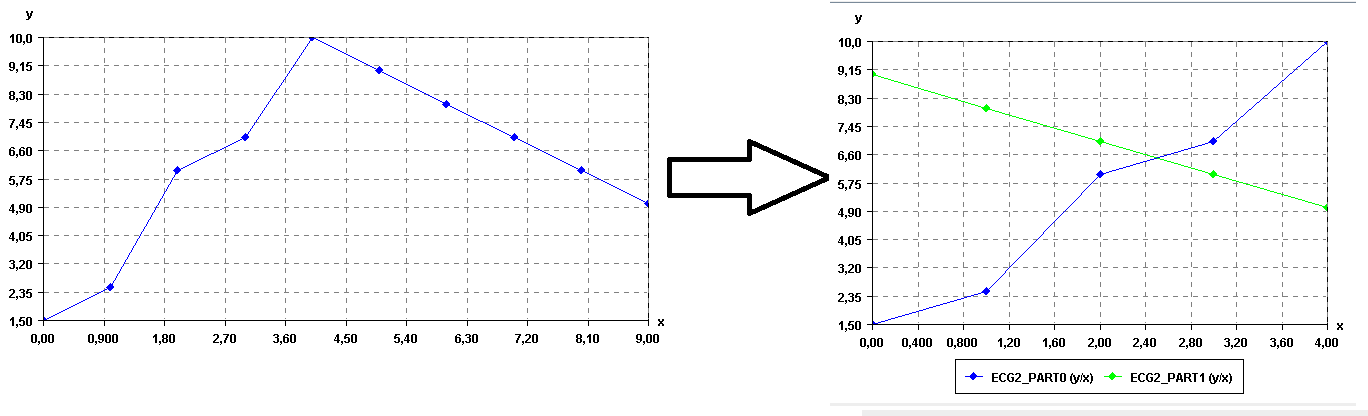
In SPMF, there is currently two ways of splitting a time series: (1) splitting into segments having a given number of data points, or (2) splitting a time series into a given number of segments. For example, if we split the above time series into two segments, we would obtain:
Splitting a time series
Then, these two time series could be converted to sequence of symbols using the SAX algorithm to apply traditional pattern mining algorithms such as sequential pattern mining and sequential rule mining algorithms, to find patterns that are common to these sequences. Of course, this is just a toy example, so there is no interesting patterns to be found in these time series. 😉
Removing noise in a time series using the moving average
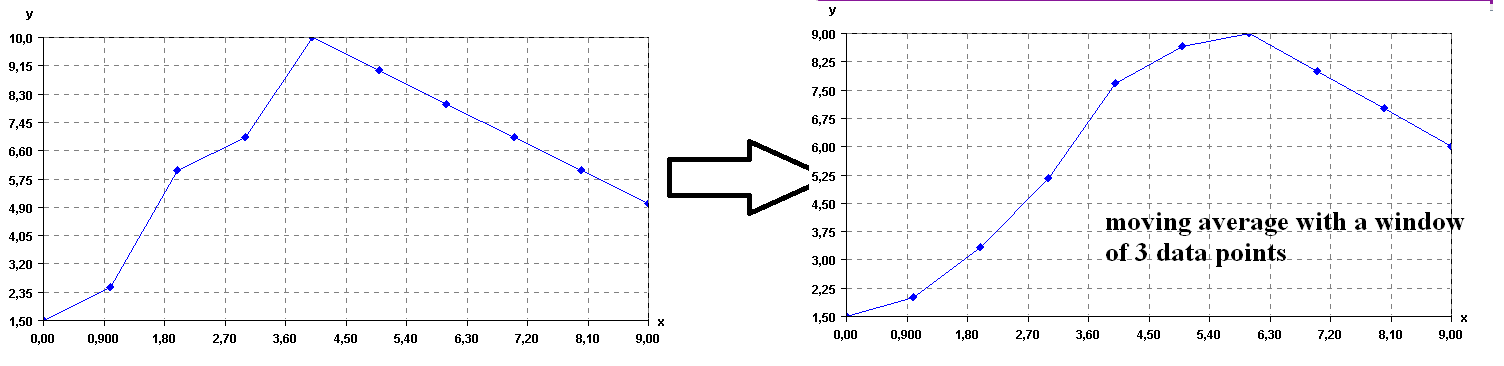
There exists various ways of removing noise in time series. One of the simplest is to calculate themoving average of the time series. To do this, the user must specify a window sizez(a number of data points). Then, each data point of the time series is replaced by the average of the previous zpoints. For example, if we use again the same time series, and set zto 3 points, the result is:
Moving average of a time series
As it can be seen in this example, applying the moving average makes the time series to become more “smooth”.
Other possibilities: time series clustering and vizualization
This blog post has given an overview of the main operations for time series mining in SPMF. More details can be found in the documentation of SPMF in theSPMF website.
Note that it is also possible to apply clustering algorithms such as K-Means, also provided in SPMF, to automatically group similar time series (time series clustering).
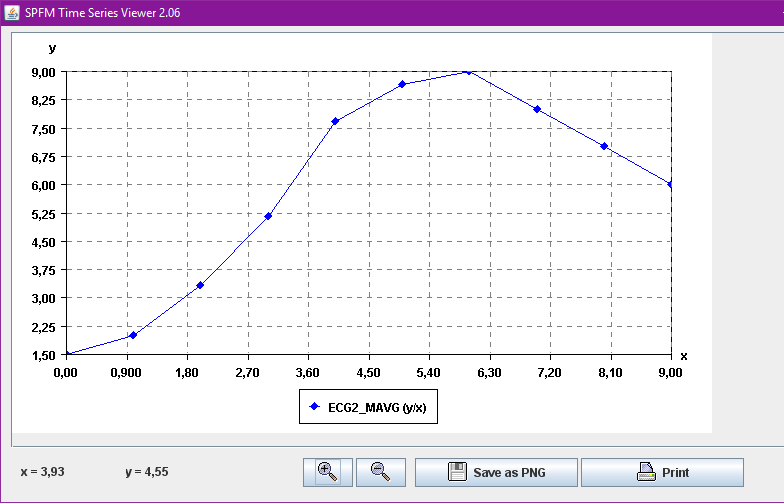
Besides, a time series viewer is also integrated in SPMF for visualizing time series and performing basic operation such as zooming in, zooming out, and printing.
SPMF time series viewer
This time series viewer will also be improved in future versions of SPMF, with additional features for manipulating time series. Other features will also be added for time series mining. Any code submission related to time series is also welcome.
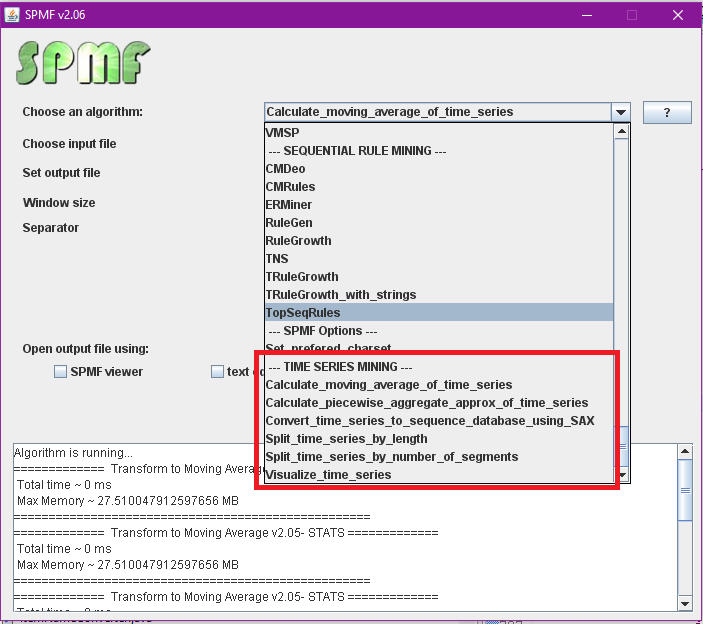
For those familiar with SPMF, all the time series operations are grouped inside a new category called “time series mining” in the user interface of SPMF:
Time series operations in SPMF 2.06
Conclusion
In this blog post, we have introducedtime series data miningwith theSPMF Java open source data mining library. This gives a brief overview of possibilities for time series mining. Of course, there exist numerous other algorithms for time series mining. But this already provides many possibilities.
If you like this blog, you can subscribe to the RSS Feed or my Twitter account (https://twitter.com/philfv) to get notified about future blog posts. Also,if you want to support this blog, please tweet and share it!
References
Lin, J., Keogh, E., Wei, L., Lonardi, S.: Experiencing SAX: a novel symbolic representation of time series. Data Mining and Knowledge Discovery 15, 107–144 (2007)