Pattern mining is a popular research area in data mining, which aims at discovering interesting and useful patterns in data. It is a field of research that has been active for over 25 years and there is a lot of technical terms related to this field. Thus, in this blog post, I will provide a short glossary of key terms found in pattern mining papers.

- Antecedent: The left side of an association rule.
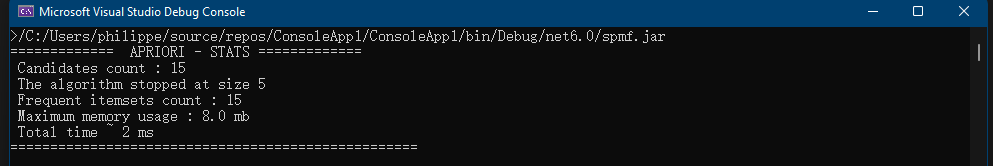
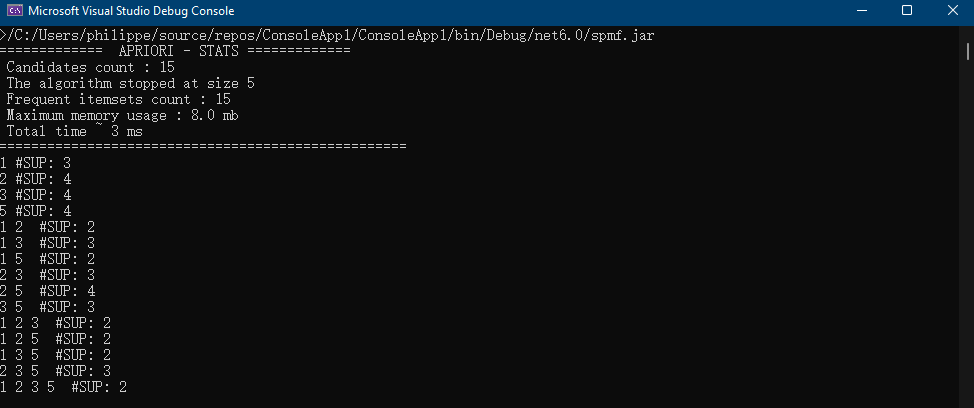
- Apriori Algorithm: Apriori is a frequent itemset mining algorithm used to identify frequent itemsets in a dataset. It is the first algorithm for that task.
- Association Rule: A rule that expresses the dependence between two itemsets.
- Association Rule Mining: A technique for discovering associations and relationships between items in a dataset
- Closed Episode: An episode that is not a proper subset of any other episode.
- Closed Frequent Itemsets: A set of itemsets that are frequent and contain no supersets that are also frequent.
- Closed Sequential Patterns: A set of sequences of items that are frequent and contain no supersets that are also frequent.
- Consequent: The right side of an association rule
- Eclat Algorithm: A frequent itemset mining algorithm used to identify frequent itemsets in a dataset.
- Episode: A collection of one or more items or events that appear in a sequence.
- Episode Rule: A rule that expresses the dependence between two episodes, or between events.
- Episode Rule Mining: A process of discovering patterns of relationships between events in a sequence, which have the form of rules.
- Episode Mining: The process of discovering patterns that appear in a single long sequence of events with timestamps
- Frequent Episode: An episode that appears in a dataset with a support greater than a given threshold.
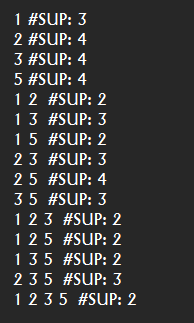
- Frequent Itemset: An itemset (set of items) that appears in a dataset with a support greater than a given threshold.
- FP-Growth Algorithm: A frequent itemset mining algorithm used to identify frequent itemsets in a dataset.
- GSP Algorithm: A sequential pattern mining algorithm used to identify frequent patterns in a sequence of items. It is the first algorithm for that problem.
- Graph Database: A database that stores data in the form of graphs (multiple graphs).
- Graph Mining: The process of discovering patterns, trends, and relationships in graphs.
- High-Utility Itemsets: A set of itemsets with a high total profit associated with them.
- High-Utility Sequential Patterns: A set of sequences of items with a high total profit associated with them.
- Itemset Mining: The process of discovering patterns and relationships between items in a dataset.
- Itemset: A collection of one or more items that appear in a sequence.
- Lift: A measure of the strength of an association rule.
- Minimum Support: A parameter used to specify the minimum number of occurrences of an itemset or pattern for it to be considered frequent.
- Minimum Confidence: A parameter used to specify the minimum confidence of an association rule for it to be considered valid.
- Maximal Episode: An episode that is as long as possible in a sequence.
- Maximal Frequent Itemsets: A set of itemsets that are frequent and contain no subsets that are also frequent.
- Maximum Gap: A parameter used to specify the maximum gap between two items in a sequence for it to be considered a valid pattern.
- Maximum Length: A parameter used to specify the maximum length of a pattern for it to be considered valid.
- Maximal Sequential Patterns: A set of sequences of items that are frequent and contain no subsets that are also frequent.
- Maximum Window Size: A parameter used to specify the maximum size of a sliding window for it to be used for pattern mining.
- Periodicity Constraint: A parameter used to specify the minimum periodicity of an itemset or pattern for it to be considered frequent.
- Periodic Itemsets: A set of itemsets that occur frequently and have a consistent period of occurrence.
- Periodic Pattern Mining: The process of finding patterns that are regularly appearing over time in a sequence of events. This can be done using algorithms such as PFPM.
- Periodic Sequential Patterns: A set of sequences of items that occur frequently and have a consistent period of occurrence.
- Prefix Span Algorithm: A sequential pattern mining algorithm used to identify frequent patterns in a sequence of items. It is an important algorithm but faster algorithms have been developed such as CM-SPAM and CM-SPADE (2014), and others.
- Prefix-tree: A tree-like data structure used by algorithms such as FP-Growth to store information. The information can be transactions, itemsets or other information.
- Sequence Database: A collection of sequences that can be used for sequence rule mining.
- Sequential Patterns: A set of sequences of items that occur frequently in a dataset.
- Sequential Pattern Mining: The process of discovering patterns and relationships between sequences of items.
- Sequential Rule Mining: The task of finding relationships between events or symbols in sequences that have the form of rules.
- Subgraph: A graph that is part of another graph.
- Subgraph Mining: The process of finding subgraphs that are interesting in a single graph or a graph database.
- Subsequence: A subset of a sequence that appears in the same order.
- Supersequence: A sequence that contains all the elements of a sequence.
- Support: A measure of how often an itemset appears in a dataset.
- Temporal Sequence Mining: A process of discovering patterns in time-stamped sequences.
- Time-Gap Constraint: A parameter used to limit the maximum gap between two items in a sequence for it to be considered a valid pattern.
- Window Constraint: A parameter used to limit the size of a sliding window used to identify sequential patterns.
==
Philippe Fournier-Viger is a professor and the founder of the open-source data mining software SPMF, offering more than 250 data mining algorithms.