In this blog post, I will talk about a great resource that can help to improve your academic writing. It is a website, called the Academic Phrasebankcreated by Dr. John Morley from the University of Manchester. This website, also published as a book, contains lists of sentences that are commonly used in research papers, each categorized according to its functions and the section of the paper where it appears. This bank of common sentences is very useful for authors who don’t know how to express their ideas, or would like to get some inspiration or find different ways of writing their ideas.
Below, is a screen shot of the main menu of the website:
There are six categories corresponding to the different sections of a typical research paper. Consider the first category, which is called “Introducing Work“. Lets say that we click on it to find out about common sentences to be used in the introduction of a paper. Then, some sub-categories are shown such as:
Establishing the importance of the topic for the world or society
Establishing the importance of the topic for the discipline
Establishing the importance of the topic as a problem to be addressed
Explaining the inadequacies of previous studies
Explaining the significance of the current study
Describing the research design and the methods used
…
Then, lets say that we choose the first sub-category. This will show us a list of common sentences for establishing the importance of a research topic. Here are a few of those sentences:
X is fundamental to …
X has a pivotal role in …
X is frequently prescribed for …
X is fast becoming a key instrument in …
X plays a vital role in the metabolism of …
X plays a critical role in the maintenance of …
Xs have emerged as powerful platforms for …
X is essential for a wide range of technologies.
X can play an important role in addressing the issue of …
Xs are the most potent anti-inflammatory agents known.
There is evidence that X plays a crucial role in regulating …
… and many others…
I will not show more examples but you can try the website to have a look at other categories
My opinion: I think that this website is quite rich and useful. I write many research papers and tend to always use more or less the same sentence structures. But by looking at this phrase bank, it gives me some ideas about how I could try using other types of sentences as well. I think that this can help improve my writing style a bit in future papers!
That is all for today. I just wanted to share this useful resource for academic writing!
Recently, there has been some debate on the Machine Learning sub-Reddit about the reproducibility or I should say the lack of reproducibility of numerous machine learning papers. Several Reddit users complained that they spent much time (sometimes weeks) to try to replicate the results of some recent research papers but simply failed to obtain the same results.
To address this issue, some Reddit user launched a website called Papers Without code to list all papers that are found to have results that cannot be reproduced. The goal of this website is apparently to save time by indicating which papers cannot be reproduced and perhaps even to put pressure on the authors to make reproducible papers in the future. On the website, someone can submit a report about a paper that is not reproducible by indicating several information such as how much time was spent on trying, what is the title of the paper and its authors. Then, the owner of the website first send an e-mail to the first author of the paper to give a chance to provide an explanation before the paper is added to the list of non-reproducible papers.
The list of papers without code can be found here. At the time of writing this blog post, there are only four papers on the list. For some of thes papers on that list, some people mentioned that they even tried to contact the authors of papers but got some dodgy responses and that some promised to add the code to GitHub with a “coming soon” notice, before eventually deleting the repository.
Personally, I am not sure that creating such website is a good idea because some papers may be added to this list and it may be undeserved in some cases, and have an impact on the reputation of some researchers. But at the same time, there are many papers that simply cannot be reproduced and many people may waste time trying to reproduce them. The website owner of PapersWithoutCode has indicated on Reddit that s/he will at least take some steps to prevent problems from happening such as to verify the information about the sender, and to inform the first author of a paper and giving him at least one week to answer before adding it to the list.
On Reddit a comment was that it is “Easier to compile a list of reproducable” papers. In fact, there is a website called Paper with Code that does that for machine learning, although it is not exhaustive. And some people claimed on Reddit that at least 50% to 90% of papers are not reproducible based on their experience. I don’t know if it is true, but there are certainly many. An undergraduate student on Reddit also said that he does not understand why providing code is not a requirement when submiting a paper. This is a good point, as it is not complicated to create an online repository and upload code…
Why I talk about this? While, I am not convince that this website is a good idea, I think that it raises an important debate about reproducibility of research. In some other fields such as cancer research, it was pointed out that several studies are difficult to reproduce. However, in computer science, this should not be so much of a problem as code can be easily shared. Unless there is some confidential or commerical restrictions on research projects, it should be possible for many researchers to publish their code and data at the time of submiting their papers. Thus, a solution could be to make this requirements more strict for conferences and journals at the time of submission.
Personally, I release the source code and data of almost all the papers where I am the corresponding author. I put the code and data in my open-source SPMF software, unless it is related to a commercial project and that I cannot share the code. This has many advantages: (1) other people can use my algorithms and compare with them without having to spend time to re-implement the same algorithms again, (2) people can use my algorithms for some real applications and it is useful to them, (3) this increase the number of citations of my papers and (4) it convince reviewers that results in my papers can be reproduced.
Another reason why I share the code of my research is that as a professor, much of my research is funded by the government through the university or grants. Thus, I feel that it is my duty to share what I do as open-source code (when possible).
What do you think? I would like to read your opinion in the comment section below.
In this blog post, I will give an overview of some of the main pattern mining tasks, to explain what kind of patterns can be found in different types of symbolic data. I will describe some main types of data and list some main types of patterns that can be found in the data using pattern mining algorithms. This list is not exhaustive but covers some of the main problems studied by researchers in pattern mining and some variations.
To find patterns in your data, there are many data mining algorithms that can be used. To apply the algorithms described below, you may find fast, efficient and open-source implementations of pattern mining algorithms in the SPMF software/library (which I am the founder), which offers over 200 algorithms.
1.Finding Patterns in Binary Records
Data description: This first common type of data is a table containing a set of records described using a set of binary attributes. For example, a binary table is shown below. This table contains four records called T1, T2, T3 and T4, which are described using four five attributes (a,b,c,d,e)
A binary table (also called transaction database)
This type of data is very common in many fields. For example, it can be used to represent:
what some customers have purchased in a store (record = customer, attributes = purchased items)
the words appearing in text documents (record = text document, attributes = appearance of a word)
the characteristics of animals (record = animal, attributes = characteristics such as has fur?)
What kind of patterns can be found in this data?
The main type of patterns that can be discovered in a binary table are:
frequent itemsets: a frequent itemset is a set of values that appear in many records. For example, by using some algorithms such as FPGrowth, we can find that the itemset {a,b} appears three times in the above table, as well as other itemsets such as {d,e}, {e}, {a}, {d} and others. In a real application, someone could for example find that many people buy bread and milk together in a store.
association rules: an association rule indicate some strong relationship between some attributes. It is has the form of a rule X –> Y indicating that if some attribute values X are found in a record, they are likely associated with some other values Y. For example, in the above database, it can be found that {a,b}–> {e} is a strong association rules because (1) it is frequent (appears many times in the database), and also it has a high confidence (or conditional probability), that is everytime that {a,b} appears, {e} also appears.
rare itemsets: Those are sets of values that do not appear many times in the data but are still strongly correlated.
2. Finding Patterns in a Sequence of Binary Records
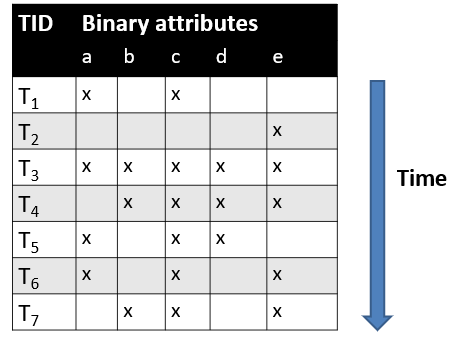
Data description: This is a sequence of records, where each record is described using binary attributes. Records are ordered by time or other factors. For example, a binary table where records are ordered is shown below. This table contains four records called T1, T2, T3 and T4, which are described using four five attributes (a,b,c,d,e)
A binary table with records ordered by time
This type of data is common in various fields. For example, it can be used for
representing what a customer has purchased in a store over time (record = each transaction made by a customer, attributes = purchased items, ordered by purchase time)
the words appearing sentences of a text document (record = word in a sentence, attributes = appearance of a word, ordered by sentences)
a sequence of locations visited by a person in a city (record = the position at a given time, attribute = the point of interest or location)
a DNA sequence (record = a nucletoride, attribute: the nucleotide type such as ACGT, ordered by appearance) such as COVID-19 sequences
The main type of patterns that can be discovered in a sequence of binary records are:
frequent episodes: an episode is of values that often appear close to each other. For example, an episode can be <{e}{c}> indicating that e is often followed by c, shortly after. To discover frequent episodes some algorithms are MINEPI, WINEPI, EMMA and TKE. (see a survey of episode mining for more details)
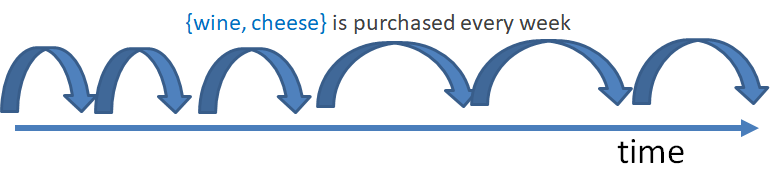
periodic itemsets: a periodic itemset is a set of values that is always re-appearing over time in a sequence of records. For example, in the above example, the itemset {a,c} always re-appear every one or two transactions, and hence can be called “periodic”. This type of patterns can be found by algorithm such as PFPM an others. An example application of finding periodic patterns is to study the behavior of customers in a store. It could be find that someone regularly purchase wine and cheese together.
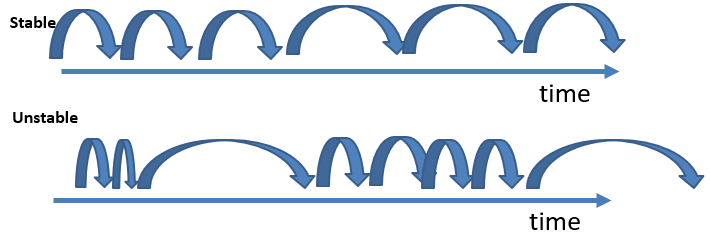
stable patterns: a stable patterns is a periodic patterns that has a stable periodic behavior over time. This means that the time between each occurrence of the pattern is more or less stable. The SPP-Growth algorithm can be used for this task. Here is an intuitive illustration of the concept of stability:
recently frequent patterns: The goal is to find patterns that have appeared many times recently rather than in the past. Algorithms such as EstDec can be used for this.
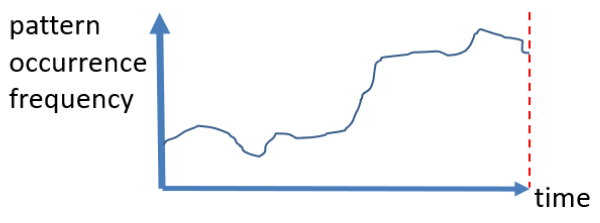
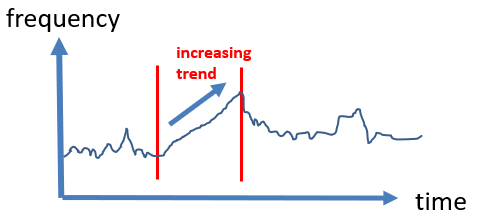
trends: Some algorithms are also designed to find increasing or decreasing trends. For example, some set of values may have may have an occurrence frequency that is slowly increasing during some time period. Such patterns can be found using some algorithms such as LTHUI-Miner.
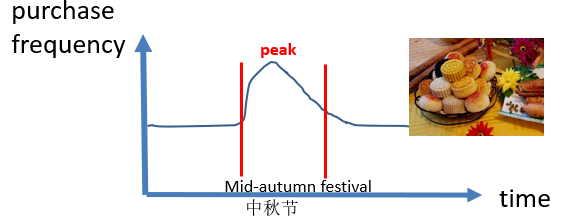
peaks: another interesting type of patterns that can be found in a sequence of records is peaks. A peak means that some set of values appears much more often than usual during some time interval. Some algorithm to find peak in a sequence of records is PHUI-Miner. For example, the picture below show that some type of food called “moon cakes” have a sale peak during some specific time period of the year in China, which is the mid-autumn festival.
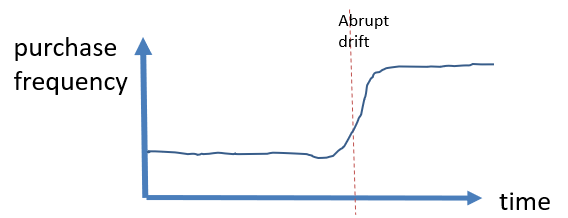
concept drifts: A concept drift is an abrupt of slow changes that happens over time. For example, it could be found in customer data, that the sales of some products as suddenly increased a lot due to the products being advertised on TV. This is illustrated with a picture:
3.Finding Patterns in a Sequence Database
Data description: Another type of data that is very common is a database of sequences of records. This is the same as the above data type except that instead of having a single sequences, we have a database containing multiple sequences. Below is an example, sequence database containing four sequences called s1, s2, s3 and s4. The first sequence indicates that some value a is followed by a value b, which is followed by c, and then by a, then b, then e, and finally f.
A sequence database
This type of data is common in various fields. For example, it can be used for
representing what a set of customers have each purchased in a store over time (sequence = the sequence of transaction made by a customer, values = purchased items)
the words appearing in sentences of a text document (sequence = a sentence where values represent words, each sentence is a sequence).
the sequence of locations visited by tourists in a city (sequence = the list of tourist spots visited by a tourist, each sequence represents a tourist)
and more..
The main type of patterns that can be discovered in a sequence of binary records are:
sequential patterns: a sequential pattern is a subsequence that appears in many sequences of the input database. In the above example, a sequential pattern is <{a},{b},{a}> because this patterns appear in the four sequences. Some algorithms for this tasks are GSP, CM-SPAM and CM-SPADE. It is also possible to add various constraints such as whether gaps are allowed or not between values in a sequential patterns. Some example of application is to find frequent sequence of locations visited by tourists and frequent sequence of purchases made by customers:
sequential rules: A sequential rule indicate some strong relationship between some values in several sequences. It is has the form of a rule X –> Y indicating that if some attribute values X appears, they are likely to be followed by some other values Y. For example, in the above database, it can be found that {a,b}–> {f} is a strong sequential rules because (1) it is frequent (appears many times in the database), and also it has a high confidence (or conditional probability), that is {a,b} is always followed by {f} . There are many algorithms for discovering sequential rules such as RuleGrowth, CMRules, and RuleGen. Some offer additional features or constraints such as to handle data with timestamps.
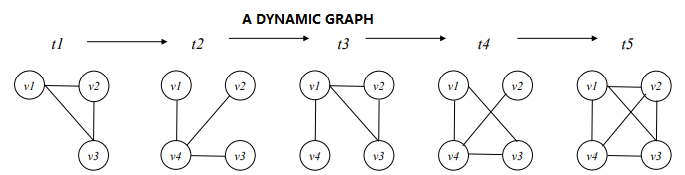
4.Finding Patterns in a Graph, Trees and Dynamic Graphs
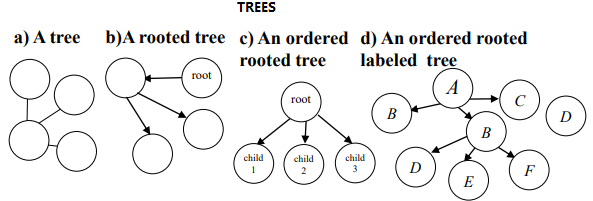
Data description: Another type of data that is quite popular aregraphs. They can be used to represent various data types such as social networks and chemical molecules. There are various types of graphs and some algorithms to analyze them. Some main graph types are shown below (taken from this survey):
Some main type of patterns that can be discovered in one or more graphs are:
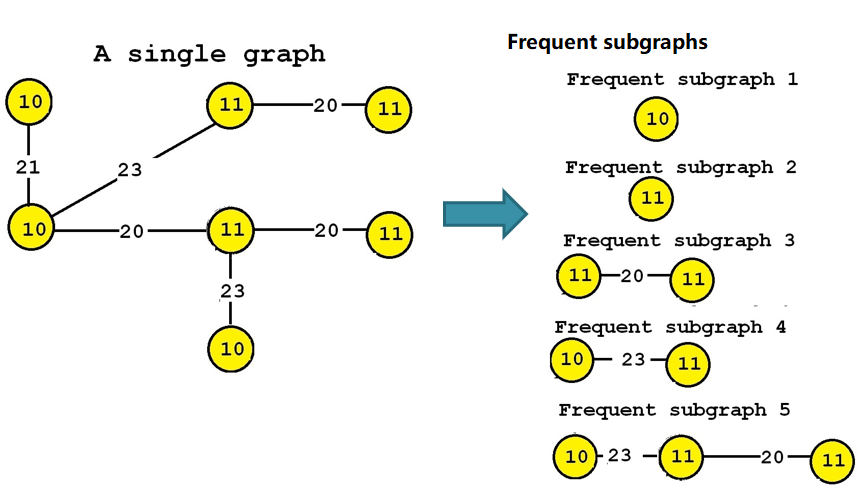
frequent subgraphs: those are subgraphs that appear many times in a large graph, or subgraphs that appear in many graphs. Some algorithms for this task are Gaston, GSPAN and TKG. Some illustrations are given below:
Illustration of finding frequent subgraphs in a graph database (all the subgraphs on the right appear in at least three graphs on the left)An illustration of finding frequent subgraphs in a single large graph (all the subgraphs on the right appears at least twice in the graph on the left)
frequent subtrees: the goal is to find trees that appear in many trees or many times in a large tree.
dynamic patterns: various types of patterns can be found in a graph that is evolving over time such as trend sequences, attribute evolution rules, etc. Those patterns can reveal how a graph is evolving. Some recent algorithms are AER-Miner and TSeqMiner.
5.Finding Patterns in TimeSeries
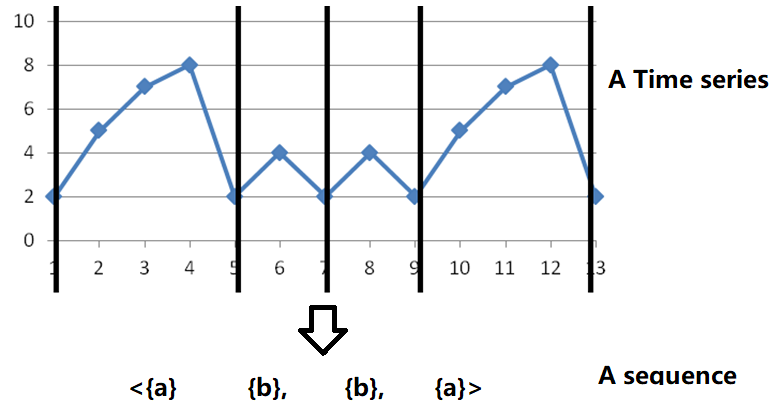
Data description: Another type of data is time series. A time series is a sequence of numbers. It can be used to represent data such as daily weather observations about the temperature or wind speed, or the daily price of stocks. Here is some example of time series, where the X axis is time and the Y exist represents the temperature (celcius):
To analyse a time series, some methods like shapelet mining are specifically designed to analyze time series. They can find shapes that appear frequently in a time series. Another solution is simply to transform a time series into a sequenceof symbols using an algorithm such as SAX, and then to apply an algorithm to find patterns in a sequence of records as previously described.
6. Some other variations
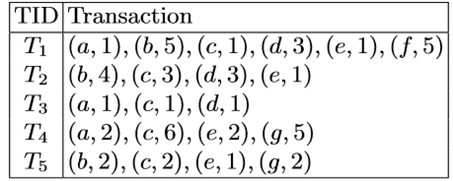
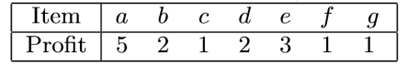
There are also several other data types that are variations of the ones that I have described above. A popular type of data in recent year is a table of record where attributes can have numeric values. For example, the database below show a transaction database with quantities:
This database can for example indicate what a customer has made five transactions (T1 to T5) in a retail store. For instance, the first transaction may indicate that the customer has purchased 1 unit of item a (apple) with 5 units of item b (bread), 1 unit of item c (cake), 3 units of item d, 1 unit of item e, and 5 units of item f. It is also possible to have another table to indicate the profit yield by the sale of each item such as below:
This table indicates that item a yields a 5$ profit, item b yield a 2$ profit and so on. By analyzing such database, it is possible for example to find a type all the sets of items purchased together that yield a lot of money. This problem is called high utility itemset miningand is actually quite general. It can be applied to other types of data as well, and can be generalized to sequences. Many researchers have been working on this topic in recent years.
Conclusion
In this blog post, I have given some overview of some main pattern mining problems for analyzing mainly symbolic data such as database of records, sequences of records, graphs and sequence databases.
If you are interested by this, you can consider using the SPMF open-source library that I have founded, which offers implementations of over 200 pattern mining algorithms: SPMF software/library. On the website, you can also find datasets to play with those types of algorithms.
— Philippe Fournier-Viger is a professor of Computer Science and also the founder of the open-source data mining software SPMF, offering more than 120 data mining algorithms.
Today, I will discuss how to write a good research grant proposal. This topic is important for researchers, who are at the beginning of their careers and want to obtain funding for their research projects. A good research proposal can be career-changing as it may allow to secure considerable funding that may for example, help to obtain a promotion. On the other hand, a poorly prepared research proposal is likely to fail. To avoid writing a very long post on this topic, I will focus on the key points for writing a good project proposal.
Preparation
Before writing a research grant proposal, the first step is preparation. Preparation should ideally start several weeks or months before the deadline. The reason is that writing a proposal takes time and that unexpected events may occur, which may delay the progress. Moreover, starting earlier allows to ask feedback from peers and to think more about the content and how to improve the proposal.
Another important aspect of preparation is to choose an appropriate funding program for the proposed research project.
The research question
A key aspect of preparing a research grant proposal is to choose a research question that will be addressed by the research project.
The key points to pay attention related to the research question are that: (1) the research question is new and relevant, (2) the research project is feasible within the time frame, using the proposed methodology and given the researcher(s)’s background and skills, and (3) the research project is expected to have an important impact (be useful). In the project proposal, the above elements (1), (2), and (3) need to be clearly explained to convince the reviewers that this project deserved to be funded.
Choosing a good research question takes time, but it is very important.
Literature review
Another important part of a project proposal is the literature review, which should provide an overview of relevant and recent studies on the same topic. It is important that the literature review is critical (highlight the limitations of previous studies) with respect to the research question. Moreover, the literature review can be used to highlight the importance of the research question, and its potential impact and applications.
References should be up-to-date (preferably from the last five years). But older references can be included, especially if they are the most relevant.
Methodology
A good proposal should also clearly explain the methodology that will be used, and the theoretical basis for using that methodology.
About carrying out experiments, one should explain how participants will be recruited and/or data will be obtained, how big the sample size will be(to ensure that results are significant), how results will be interpreted, and how do deal with issues related to ethics.
If a methodology is well-explained and detailed, it indicates that the researcher has a clear plan about how he will conduct the research. This is important to show that the project is feasible.
Timeline of the project
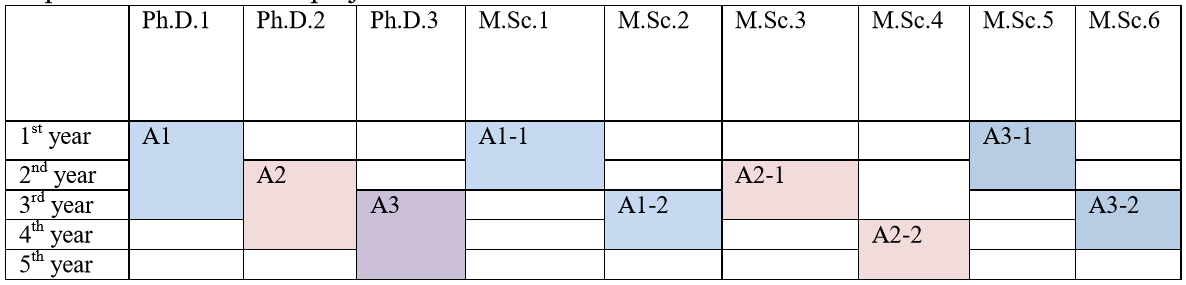
To further convince reviewers that the project will succeed, it is important to also provide a clear timeline for the project. That timeline should indicate when each main task will be done, by who, and what will be the result or deliverables for each task. For example, one could say that during the first 6 months, a PhD student will do a literature review and write a journal paper, while another student will collect data, and so on.
The timeline can be represented visually. For example, I show below a timeline that I have used to apply for some national research funding. That project was a five year projects with three main tasks. I have divided the task clearly among several students.
Note that it is good to mention the names of the students or staff involved in the project, if the names are known. It can also be good to explain how the students will be recruited.
Equipment
It is also useful to mention the equipment or facilities that are available at the institution where the researcher works, and that will help to carry the project.
Impact
Another very important aspect is to write clearly what will be the expected impact of the research project. The impact can be described in terms of advances in terms of knowledge, but also in terms of benefits to the society or economy. In other words, the proposal should explain why the project will be useful.
Budget
A project proposal needs to also include a budget that must follow the guidelines of the targeted funding source. It is important that the amounts of money are reasonable and justifications are provided to explain why the money is required.
Team, institution, and Individual
A proposal should also explain that the applicant and its team have the suitable background and skills required for successfully conducting the project. This is done by describing the background and skills of researchers, and how they fit the project.
Conclusion
In this blog post, I have discussed the key points that a good research proposal should include. I could say more about this topic, but I wanted to not make it too long for a blog post.
This is a website that let you automatically generate reviews to reject papers. The reviewer need to check some boxes about what is the content of the paper, and then a review is generated. Note that it is not meant to be used by reviewers in real-life. It was created as an April fool’s joke. But it is interesting to try and see what kind of review is generated. For example, I generated a review:
Dear Author,
 Thank you very much for your submission.  We have enclosed detailed reviews of your paper below.

 Reviewer 2

 Generally speaking, this is interesting work which may well find some readers in the community.  However, in its present form, the paper suffers from a number of issues, which are outlined below.

 Area

 Computer Science is not new.  The past decade has seen a flurry of papers in the area, which would indicate progress and interest.  However, the impact outside of Computer Science has been very limited, as is easily reflected in the ever-decreasing number of citations.  Unfortunately, Computer Science finds itself in a sandwich position between a more theoretical community and a more practical community, which can both claim a bigger intellectual challenge and a greater relevance in practical settings.  This is especially true for the field of Data mining, where the last big progress is now decades ago.  As refreshing it feels to finally again see progress claimed in the field, the present paper must be read and evaluated in this context.

 Approach
The paper suffers from an excess of formalism.  Several important definitions are introduced formally only, without a chance to clearly understand their motivation or usage.  The authors should be encouraged to make more use of informal definitions, building on the well-established formal definitions in the community.

 For readers, it is helpful to see the approach being demonstrated in a limited setting that facilitates control and comprehension.  However, real-world settings are much more detailed, and much more challenging.  If the approach is ever to succeed in practice, having a demonstrator that copes with real-world conditions is a must; the authors would be encouraged to work with industry to get access to appropriate settings and data sets.

 Evaluation
 This reviewer read until Page 2, and the evaluation seems to be okay.
 The fact that your evaluation involves students is also a cause for concerns - not only for ethical reasons, but also for the sake of generality.  Generally speaking, results achieved with students cannot generalize to results achieved with the general public - especially not in Computer Science.  You have to run your evaluation and experiments involving a wider range of subjects.
 Limitations
 The section on 'future work' fits into this very picture: There clearly is still a lot of additional work to do until this approach can begin to sho (...)
The code of that website is open-source but the approach is really simple if you look under the hood. A review is generated using some simple IF conditions.
If you have submitted several papers to journals and conferences, you will know that sometimes, we are not lucky and some reviewers can give some very bad comments rather than adopting a constructive approach. This website lists several bad comments given by reviewers. Here are a few examples:
“Indeed, by the end of the paper, the reader is left with a feeling of ‘so what now?’”
” The fact that the question of this paper has never been asked should, on balance, count against the paper.”
“Is this really a discovery or just the confirmation of math?”
“I don’t see how your approach has potential to shed light on a question that anyone might have.”
“The paper could be considered for acceptance given a rewrite of the paper and change in the title and abstract. “
” This discussion might be better directed to a different audience, perhaps an undergraduate class “
“I am personally offended that the authors believed that this study had a reasonable chance of being accepted to a serious scientific journal.”
If you don’t know this website already, it offers some good cartoons about graduate student life. There are hundreds of comic strips, and some are really funny and to the point. When, I was a graduate student, I keep reading this every week. Although the author seems to have stopped uploading new comic strips, there is a big archive of old comics. There are also two movies that were made based on these comics called the PHD Movie 1 and PHD Movie 2. The 200 most popular comic strips from this website: http://phdcomics.com/comics/most_popular.php
An example of comic from PhDComics – Copyright (c) Jorge Cham
This website offers a tool to randomly generate computer science research papers. This was designed as a joke. But it is funny to try it and see what is generated. It can even generate some graphs and charts. To use the tool, all you need to do is fill the author names and click “Generate“:
The User interface of SCIGEN
Although papers generated by this tool generally do not make sense when you look at the details, some people have submitted generated papers to some predatory conferences to show that there is no review process and that the goal is just to get some money. You can see more details about that story on the website of SCIGEN.
Conclusion
That is all for today. I just wanted to share a few interesting websites that are not useful for your research but I think are funny or interesting.
If you have some other good websites, you may post them in the comment section below.
— Philippe Fournier-Viger is a professor of Computer Science and also the founder of the open-source data mining software SPMF, offering more than 120 data mining algorithms.
Today, I will talk about how to cite equations in research papers, and give a few advices that may be useful to researchers. The idea of this blog post comes from a discussion that I had with some colleagues about the proper way of citing equations. As you know, some papers will contains equations like this:
u= q × p (1)
And then authors will also refer to this equation in the text such as “Equation (1) explains how to calculate the utility of a pattern“. This way of citing equations is generally viewed as acceptable and very common. But is this the best way of refering to equations?
There are a few things that need to be discussed.
First, there are researchers that will say that “equation” is a word with a broad meaning and that it is better to use a more specific term when possible. Following this principe, one could say “Formula (1) explains how to calculate the utility of a pattern” in the above example. There are several terms that can be used depending on the context such as “formula“, “reccurrence“, “inequality” and “identify“. So what is the difference?
A mathematical expression is an mathematical phrase that contains some numbers or variables connected by some operators. For example, 1+1 is an expression, and 1+1=2 is also an expression.
An equation is a mathematical expression that contains the = symbol. For example 1 = 1 is an equation, and a = b + c is also an equation. Such statements can also be called an equality.
An identify is an equality that is true no matter what values are given to the variables that it contains. For example, x + x = x × 2 is an identify.
An inequality is a matematical expression where we compare two expression that are not equal by using the symbols such as < > = ≥ ≤ ≠. For example, x+c < d is an inequality. It is not an equation!
The definition of a formula is quite broad and some will disagree on the exact meaning. But generally, a formula expresses how to calculate some variable based on one or more variables. For example, equation (1) in the example is a formula for calculating the utility of a pattern. It tells how to find the value of a variable “u” from the values of two variables “q” and “p”. Thus, it can be called a formula. Another example is the Pythagorean theorem which is a formula that can be written as an equation: a^2 + b^2 = c^2.
and there are others…
Second, some researchers will suggest to avoid using abbreviations to refer to equations such as “eq. (1)” and “eqn. (1) but instead to write in full “equation (1)” or “formula (1)”.
Third, it is recommended to not just refer to equations in the text but also to add some words to help the reader to remember what the equation is about. This is explained clearly with some examples in the “Handbook of writing for the mathematical sciences“ of Higam:
“When you reference an earlier equation it helps the reader if you add a word or phrase describing the nature of that equation. The aim is to save the reader the trouble of turning back to look at the earlier equation. For example, “From the definition (6.2) of dual norm” is more helpful than “From (6.2)”; and “Combining the recurrence (3.14) with inequality (2.9)“ is more helpful than “Combining (3.14) and (2.9)“. Mermin [200] calls this advice the “Good Samaritan Rule”. As in these examples, the word added should be something more informative than just “equation” (or the ugly abbreviation “Eq.”), and inequalities, implications and lone expressions should not be referred to as equations.” (color and bold formatting added by me)
That is all for today! Hope that this has been interesting and will be useful in your papers.
— Philippe Fournier-Viger is a professor of Computer Science and also the founder of the open-source data mining software SPMF, offering more than 120 data mining algorithms.
Recently, my team has been working on analyzing COVID-19 genome sequences using pattern mining and other data mining and AI techniques. We have recently published a paper in the Applied Intelligence journal about this.
In this blog post, I will give some brief overview of this. The PDF of thepaper can be found here:
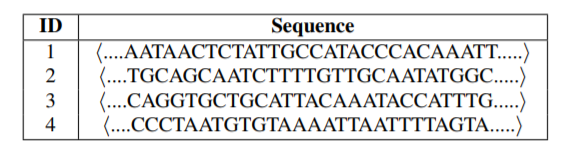
The main idea of the paper is the following. We have obtained genome sequences of different strains of the COVID-19 virus. These genome sequences can be viewed as strings of letters (nucleotides). For example, below is four sequences of nucleotides:
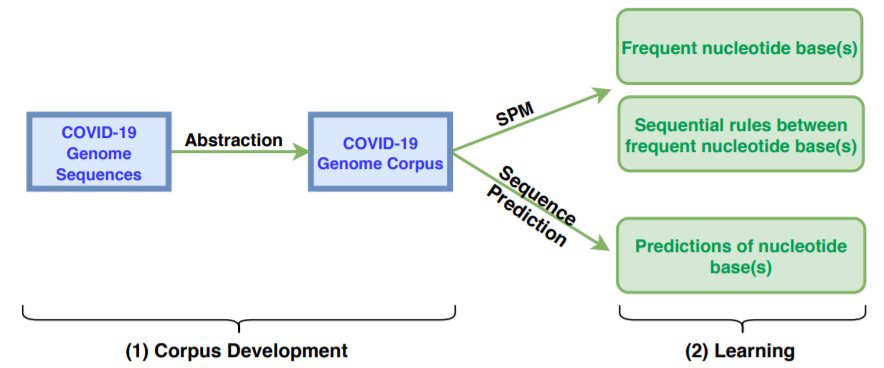
Then, after preprocessing these sequences, it is possible to analyze them using pattern mining algorithms and other artificial intelligence techniques. The main process is the following:
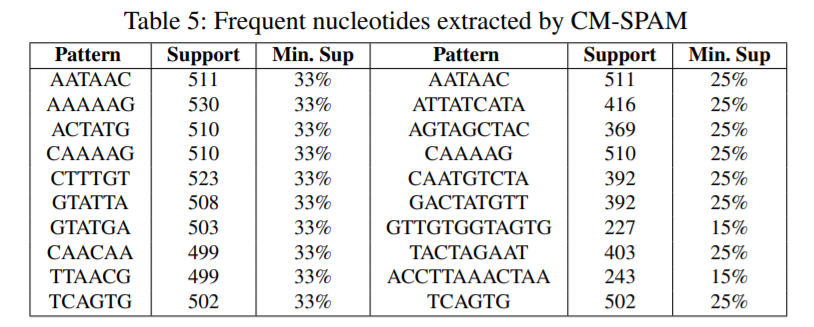
First we prepare the data (step 1), and then we apply different techniques (step 2). First, we have applied itemset mining, sequential pattern miningand sequential rule mining techniques to find patterns that are common to many genome sequences. Some examples of sequential patterns (sequences of nucleotides that appear often) find by the CM-SPAM algorithm are below:
This is just to give an overview. Other types of patterns are discussed in the paper in more details.
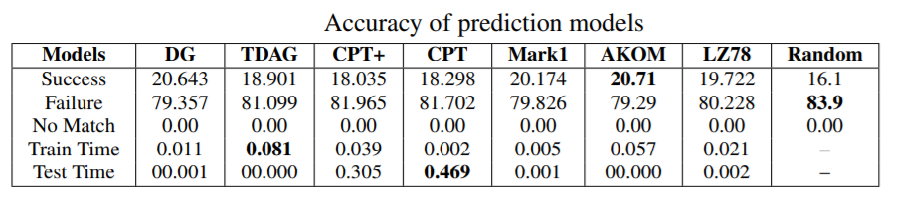
Second, we also tested sequence prediction models to see if the nucleotides in genome sequences can be predicted. We compared various models offered in the SPMF data mining software and got results like this:
In general, prediction of genome sequence does not give a high accuracy but still better than a random prediction. We discuss these results in more details in the paper.
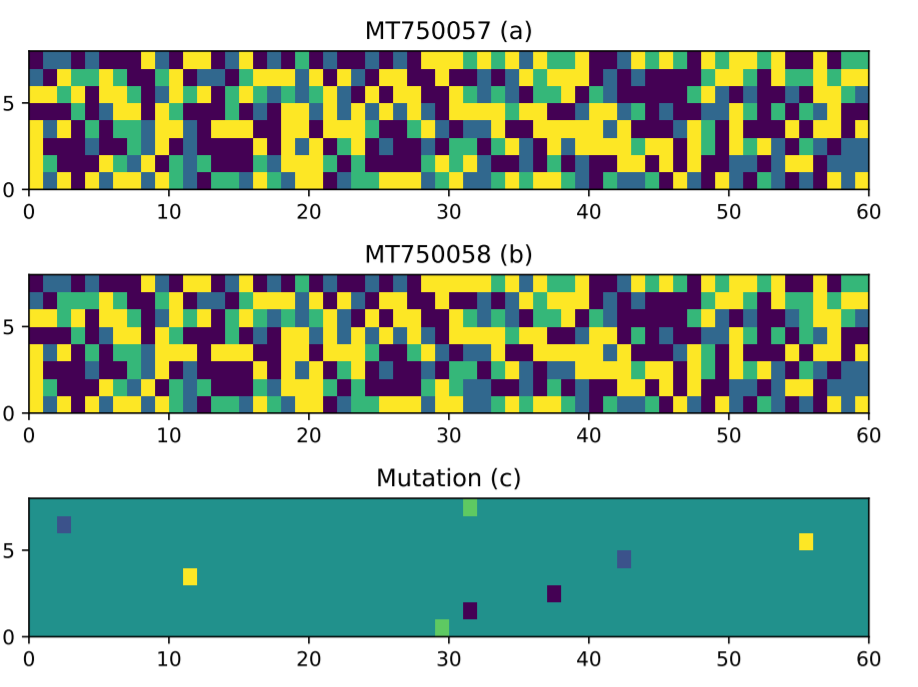
Third, we also designed some mutation analysis algorithm to compare different strains of the coronavirus. For example, by comparing two strains, we identified some mutations:
That is just a brief overview of the paper!
There are many possibilities for extensions of this research. In particular, various other pattern mining algorithms and machine learning algorithms could be applied as well. Using the code and data provided above, you can also make your own research on this topic! Besides, the tools presented in this paper can also be applied to other genome sequences beside the COVID-19 virus.
Hope this has been interesting.
— Philippe Fournier-Viger is a professor of Computer Science and also the founder of the open-source data mining software SPMF, offering more than 120 data mining algorithms.
Today, I am happy to announce that a new version of theSPMF open-source data mining software is released (v. 2.44). This is the download page. This new version was made possible due to several contributors.
What is new?
New data mining algorithms: – LTHUI-Miner for mining the locally-trending high utility itemsets (by Yanjun Yang) – MLHUI-Miner for discovering the multi-level high utility itemsets (by Ying Wang) – AER-Miner for mining attribute evolution rules in a dynamic attributed graph (by Ganghuan He) – TSPIN for mining the top-k stable periodic patterns in a transaction database (by Ying Wang, Peng Yang)
New datasets: – Fruithut, Liquor and E-commerce (prepared by Ying Wang)
Some bug fixes: – Fixed a small bug in DFIN (thanks to Nader Aryabarzan) – Fixed a bug in the user interface for TKG (thanks to..) – Fixed a small error in the DB_LHUI.txt example file
Some new tool: – Added a new tool to fix problems in transactions databases with time and utility information
Some new feature: – Added a feature for saving or loading a trained sequence prediction model from file (for the AKOM, DG, TDAG, LZ78, PPM, CPT, and CPT+ algorithms)
The SPMF project is still under active development. The next version will be released in a few weeks as I still have received several algorithms that are waiting to be added to SPMF. The next release will include several new sequential pattern mining algorithms.
Would you like to contribute to SPMF?
The SPMF project is quite successful due to the numerous contributors that are provided some code, reported bugs and also provided many comments. If you are interested to contribute something (code of some algorithms or other things), please leave me an e-mail at philfv8 AT yahoo DOT com.
Have you ever wanted to write an academic book or wondered what are the steps to write one? In this blog post, I will give an overview of the steps to write an academic book, and mention some lessons learned while writing my recent book on high utility pattern mining.
Step 1.Think about a good book idea. The first step for writing a book is to think about the topic of the book and who will bethe target audience. The topic should be something that will be interesting for an audience. If a book focuses on a topic that is too narrow or target a small audience, the impact may be less than if a more general topic is chosen or if a larger audience is targeted.
One should also think about the content of the book, evaluate how much time it would take to write the book, and think about the benefits of making the book versus spending that time to do something else. It is also important to determine the book type. There are three main types of academic books:
First, one may publish a textbook, reference book or handbook. Such book must be carefully planned and written in a structured way. The aim is to write a book that can be used for teaching or used as a reference by researchers and practitioners. Because such book must be well-organized, all chapters are often written by the same authors.
Second, one may publish an edited book, which is a collection of chapters written by different authors. In that case, the editors typically write one or two chapters and then ask other authors to write the remaining chapters.This is sometimes done by publishing a “call for chapters” online, which invite potential authors to submit a chapter proposal. Then, the editor evaluates the proposal and select some chapters for the book. Writing such book is generally less time-consuming than writing a whole book by oneself because the editors do not need to write all the chapters. However, a drawback of such book is that chapters may contain redundancy and have different writing styles. Thus, the book may be less consistent than a book entirely written by the same authors. A common type of edited book is also the conference or workshop proceedings.
Third, one may publish his Ph.D. thesis as a book if the thesis is well-written. In that case, one should be careful to choose a good publisher because several predatory publishers offer to publish theses with a very low quality control, while taking all the copyrights, and then selling the theses at very expensive prices.
Step 2. Submit a book proposal After finding a good idea for a book, the next step is to choose a publisher. Ideally, one should choose a famous publisher or a publisher that has a good reputation. This will give credibility to the book, and will help to convince potential authors to write chapters for the book if it is an edited book.
After choosing a publisher, one should write a book proposal and send it to the publisher. Several publishers have specific forms for submitting a book proposal, which can be found on their website or by contacting the publisher. A book proposal will request various information such as: (1) information about the authors or editors, (2) some sample chapter (if some have been written), (3) is there similar books on the market?, (4) who will be the primary and secondary audience?, (5) information about the conference or workshop if it is a proceedings book, (6) how many pages, illustrations and figures the book will contain?, (7) what is the expected completion date?, and (8) a short summary of your book idea and the chapter titles.
The book proposal will be evaluated by the publisher and if it is accepted, the publisher will ask to sign a contract. One should read the contract carefully and then sign it if it is satisfying.
Step 3. Write the book Then the next step is to write the book, which is generally the most time-consuming part. In the case of a book written all by the same authors, this can require a few months. But for an edited book, it can take much less time. Editor must still find authors for writing the chapters and perhaps also write a few chapters.
After the book have been written, it should be checked carefully for errors and consistency. A good idea is to ask peers to check the book to see if something need to be improved. For an edited book, a review process can be organized by recruiting reviewers to review each chapter. The editors should also spend some time to put all the chapters together and combine them in a book. This can take quite a lot of time, especially if the authors did not respect the required format. For this reason, it is important to give very clear instructions to authors with respect to the format of their chapters before they start writing.
Step 4. Submit the book the publisher After the book is written, it is submitted to the publisher. The publisher will check the content and the format and may offer other services such as creating a book index or revising the English. A publisher may take a month or two to process a book before publishing it.
Step 5. Promote the book After writing a book, it is important to promote it in an appropriate on the web, social media, or at academic conferences. This will ensure that the book is successful. Of course, if one choose a good publisher, the book will get more visibility.
Lessons learned This year, I published an edited book on high utility pattern mining with Springer. I followed all the above steps to edit that book. I first submitted a book proposal to Springer, which was accepted. Then, I signed the contract, and posted a call for chapters. I received several chapter proposals and also asked other researchers to write chapters. The writing part took a bit of time because although I edited the book, I still participated to the writing of six of the twelve chapters. Moreover, I also asked various people to review the chapters. Then, it took me about 2 weeks to put all the chapters together and fix the formatting issues. Overall, the whole process was done over about 1 year and half, but I spent perhaps 1 or 2 months of my time. Would I do it again? Yes, because I think it is a good for my career, and I have some other ideas for books.
The most important lesson that I learned is to give more clear instructions to authors to reduce formatting problems and other issues arising when putting all chapters together.
Conclusion In this blog post, I have discussed how to write an academic book. Hope you have learned something! Please share your comments below. Thanks for reading!
In this blog post, I will give an introduction to an interesting data miningtask called frequent subgraph mining, which consists of discovering interesting patterns in graphs (a pattern mining task). This task is important since data is naturally represented as graph in many domains (e.g. social networks, chemical molecules, map of roads in a country). It is thus desirable to analysze graph data to discover interesting, unexpected, and useful patterns, that can be used to understand the data or take decisions.
What is a graph? A bit of theory…
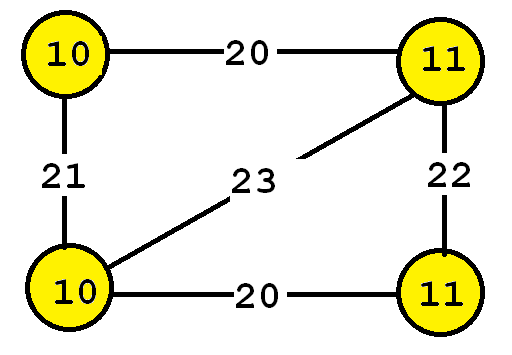
But before discussing the analysis of graphs, I will introduce a few definitions. A graph is a set of vertices and edges, having some labels. Let’s me illustrate this idea with an example. Consider the following graph:
This graph contains fourvertices (depicted as yellow circles). These vertices have labels such as “10” and “11”. These labels provide information about the vertices. For example, imagine that this graph is a chemical molecule. The label 10 and 11 could represent the chemical elements of Hydrogen and Oxygen, respectively. Labels do not need to be unique. In other words, the same labels may be used to describe several vertices in the same graph. For example, if the above graph represents a chemical molecule, the labels “10” and “11” could be used for all vertices representing Oxygen and Hydrogen, respectively.
Now, besides vertices, a graph also contains edges. The edges are the lines between the vertices, here represented by thick black lines. Edges also have some labels. In this example, four labels are used, which are 20, 21, 22 and 23. These labels represents different types of relationships between vertices. Edge labels do not need to be unique.
Types of graphs: connected and disconnected
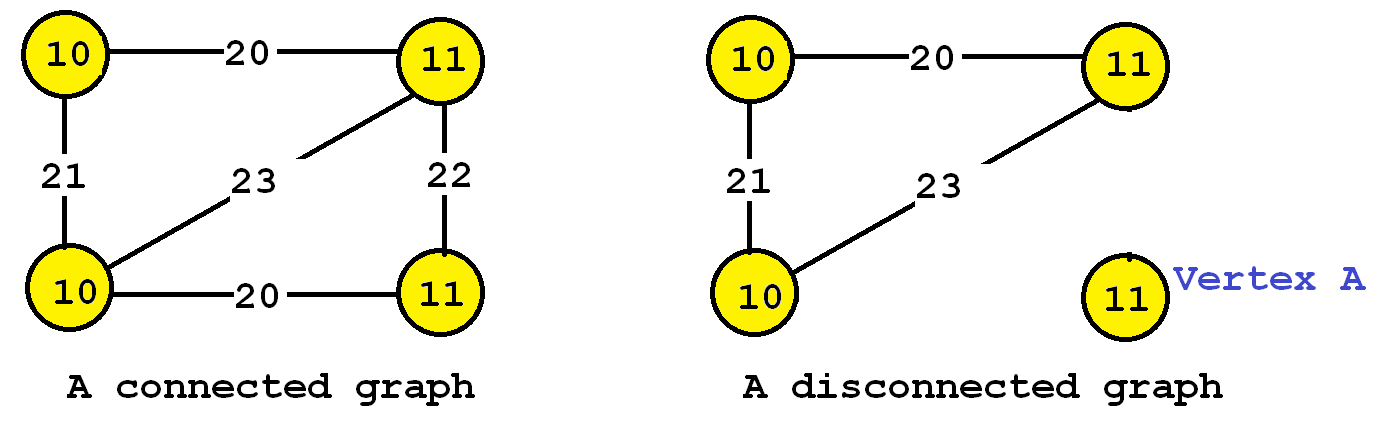
Many different types of graphs can be found in real-life. Graphs are either connected or disconnected. Let me explain this with an example. Consider the two following graphs:
The graph on the left is said to be a connected graph because by following the edges, it is possible to go from any vertex to any other vertices. For example, imagine that vertices represents cities and that the edges are roads between cities. A connected graph in this context is a graph where it is possible to go from any city to any other cities by following the roads. If a graph is not connected, it is said to be a disconnected graph. For example, the graph on the right is disconnected since Vertex A cannot be reached from the other vertices by following the edges. In the following, we will use the term “graph” to refer to connected graphs. Thus, all the graphs that we will discuss in the following paragraphs will be connected graphs.
Types of graphs: directed and undirected
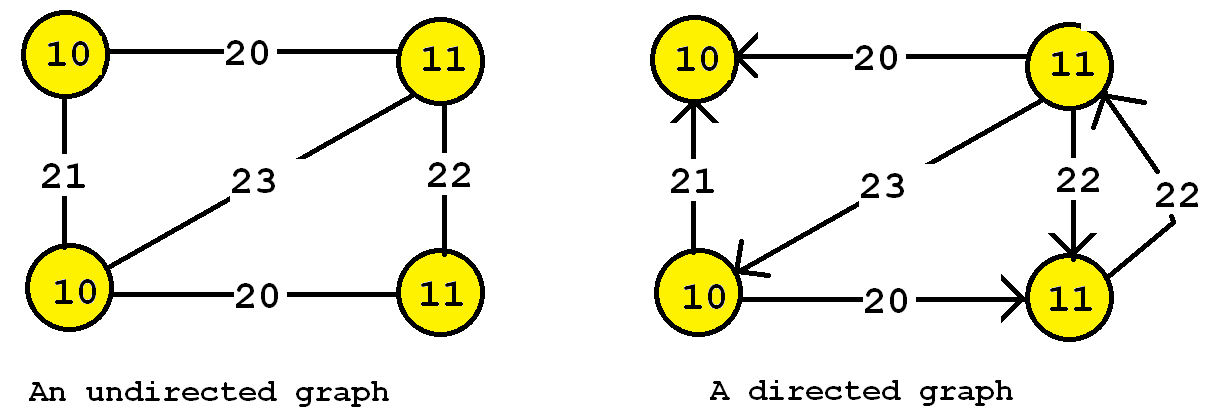
It is also useful to distinguish between directed and undirected graphs. In an undirected graph, edges are bidirectional, while in a directed graph, the edges can be unidirectional or bidirectional. Let’s illustrate this idea with an example.
The graph on the left is undirected, while the graph on the right is directed. What are some real-life examples of a directed graph? For example, consider a graph where vertices are locations and edges are roads. Some roads can be travelled in both directions while some roads may be travelled in only a single direction (“one-way” roads in a city).
Some data mining algorithms are designed to work only with undirected graphs, directed graphs, or support both.
Analyzing graphs
Now that we have introduced a bit of theory about graphs, what kind of data mining task can we do to analyze graphs? There are many answers to this question. The answer depends on what is our goal but also on the type of graph that we are analyzing (directed/undirected, connected/disconnected, a single graph or many graphs).
In this blog post, I will explain a popular task called frequent subgraph mining. The goal of subgraph mining is to discover interesting subgraph(s) appearing in a set of graphs (a graph database). But how can we judge if a subgraph is interesting? This depends on the application. The interestingness can be defined in various ways. Traditionally, a subgraph has been considered as interesting if it appears multiple times in a set of graphs. In other words, we want to discover subgraphs that are common to multiple graphs. This can be useful for example to find association between chemical elements common to several chemical molecules.
The task of finding frequent subgraphs in a set of graphs is called frequent subgraph mining. As input the user must provide:
a graph database (a set of graphs)
a parameter called the minimum support threshold (minsup).
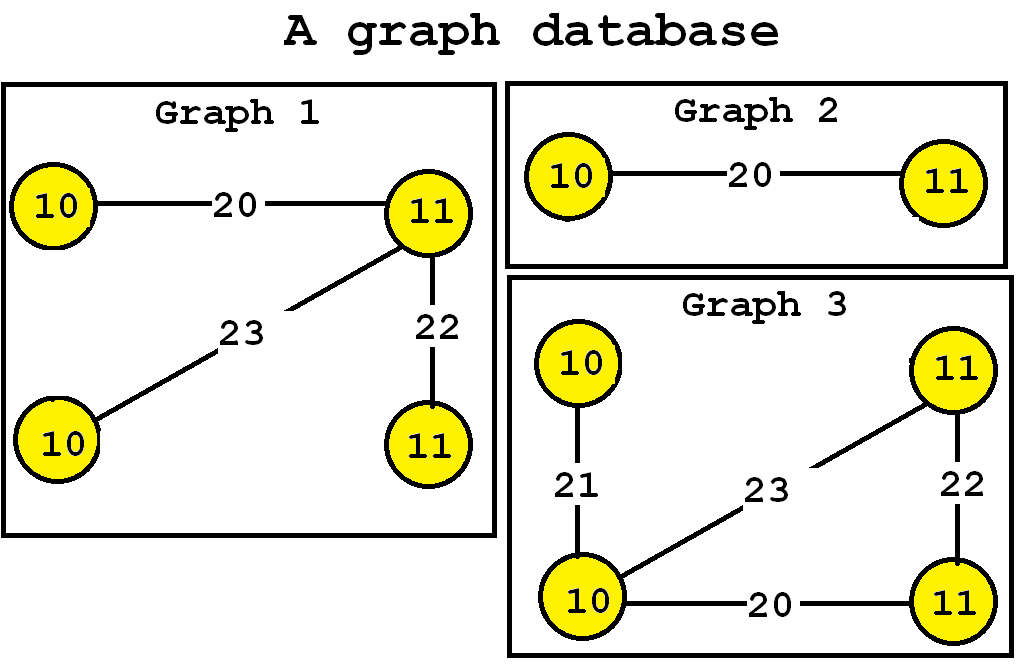
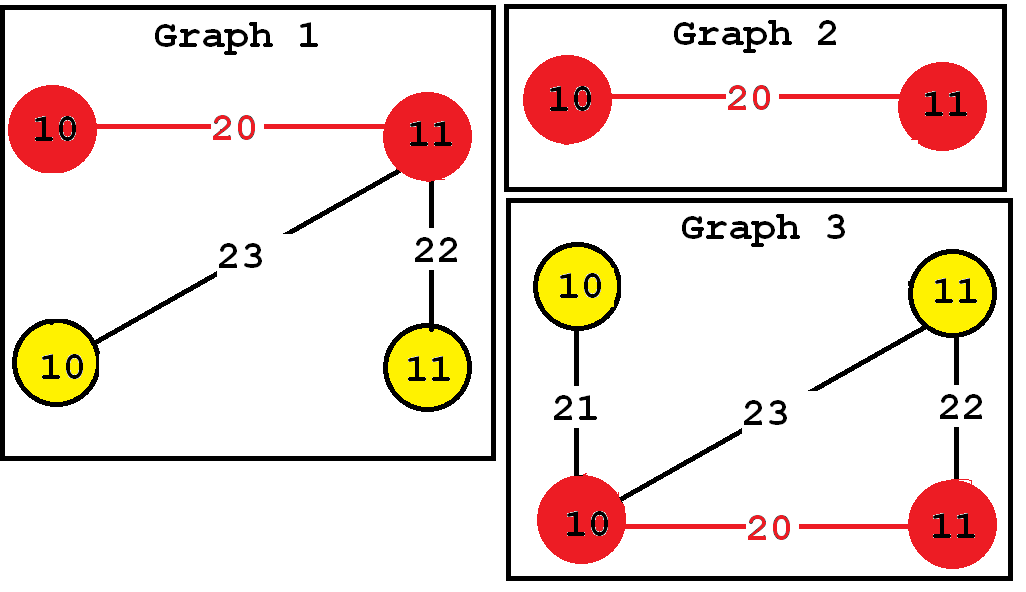
Then, a frequent subgraph mining algorithm will enumerate as output all frequent subgraphs. A frequent subgraph is a subgraph that appears in at least minsup graphs from a graph database. For example, let’s consider the following graph database containing three graphs:
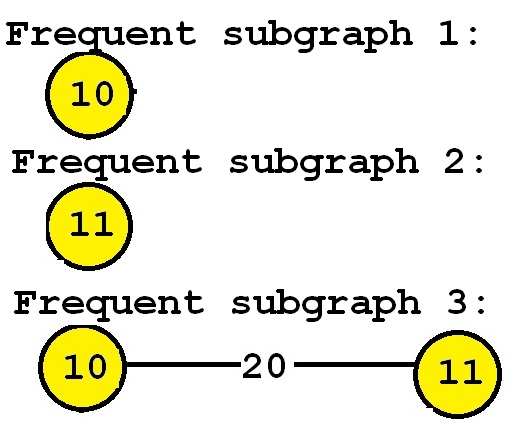
Now, let’s say that we want to discover all subgraphs that appear in at least three graphs. Thus, we will set the minsup parameter to 3. By applying a frequent subgraph mining algorithm, we will obtain the set of all subgraphs appearing in at least three graphs:
Consider the third subgraph (“Frequent subgraph 3”). This subgraph is frequent and is said to have a support (a frequency) of 3 since it appears in three of the input graphs. These occurrences are highlighted in red, below:
Now a good question is how to set the minsup parameter? In practice, the minsup parameter is generally set by trial and error. If this parameter is set too high, few subgraphs will be found, while if it is set too low, hundred or millions of subgraphs may be found, depending on the input database.
Now, in practice, which tools or algorithms can be used to find frequent subgraphs? There exists various frequent subgraph mining algorithms. Some of the most famous are GASTON, FSG, and GSPAN.
Mining frequent subgraphs in a single graph
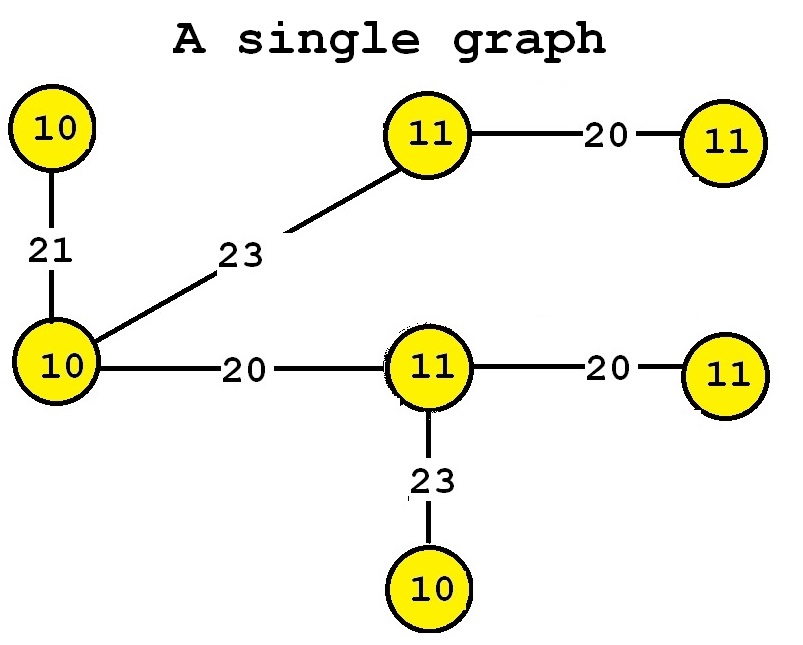
Besides discovering graphs common to several graphs, there is also a variation of the problem of frequent subgraph mining that consists of finding all frequent subgraphs in a single graph rather than in a graph database. The idea is almost the same. The goal is also to discover subgraphs that appear frequently or that are interesting. The only difference is how the support (frequency) is calculated. For this variation, the support of a subgraph is the number of times that it appears in the single input graph. For example, consider the following input graph:
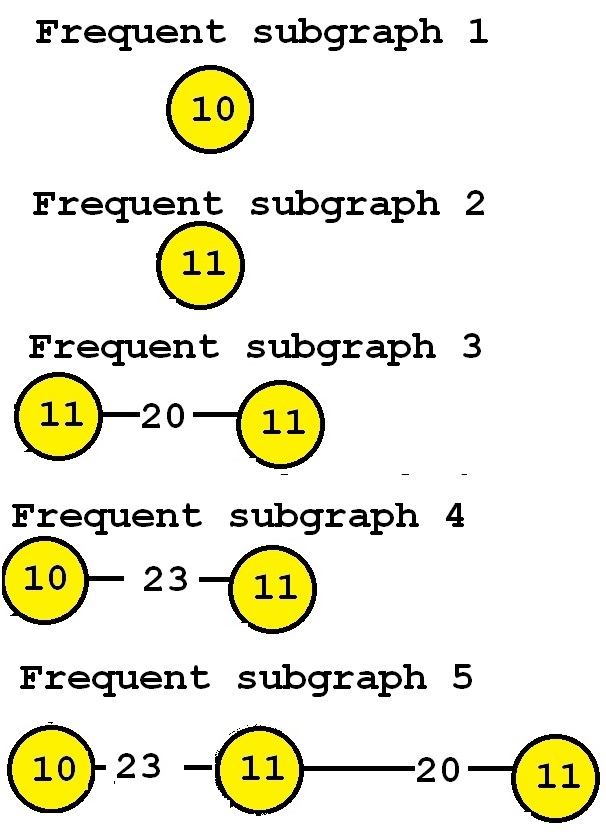
This graph contains seven vertices and six edges. If we perform frequent subgraph mining on this single graph by setting the minsup parameter to 2, we can discover the five following frequent subgraphs:
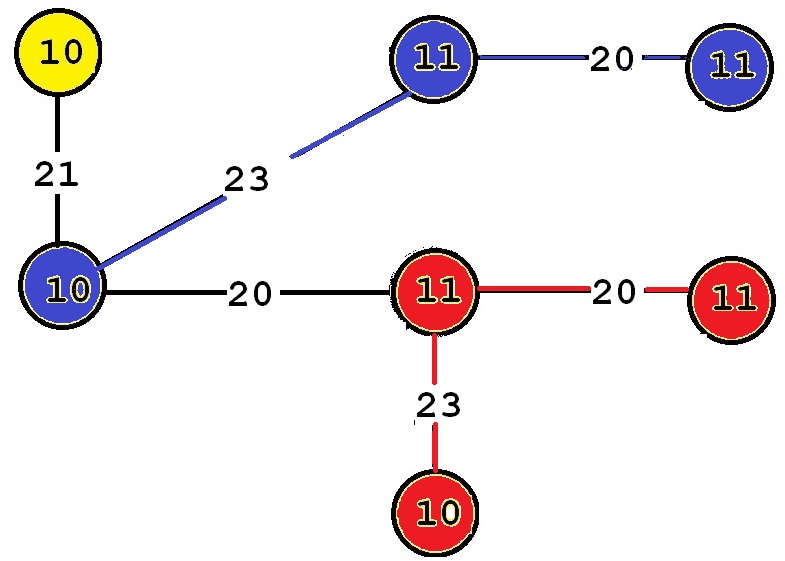
These subgraphs are said to be frequent because they appear at least twice in the input graph. For example, consider “Frequent subgraph 5”. This subgraph has a support of 2 because it has two occurrences in the input graph. Those two occurrences are highlighted below in red and blue, respectively.
Algorithms to discover patterns in a graph database can often be adapted to discover patterns in a single graph.
In this blog post, I have introduced the problem of frequent subgraph mining, which consists of discovering subgraphs appearing frequently in a set of graphs. This data mining problem has been studied for more than 15 years, and many algorithms have been proposed. Some algorithms are exact algorithms (will find the correct answer), while some other are approximate algorithms (do not guarantee to find the correct answer, but may be faster).
Some algorithms are also designed to handle directed or undirected graphs, or mine subgraphs in a single graph or in a graph database, or can do both. Besides, there exists several other variations of the subgraph mining problem such as discovering frequent paths in a graph, or frequent trees in a graph.
Besides, in data mining in general, many other problems are studied related to graphs such as optimization problems, detecting communities in social networks, relational classification, etc.
In general, problems related to graphs are quite complex compared to some other types of data. One of the reason why subgraph mining is difficult is that algorithms typically need to check for “subgraph isomorphisms“, that is to compare subgraphs to determine if they are equivalent. But nonetheless, I think that these problems are quite interesting as there are several research challenges.
I hope that you have enjoyed this blog post. If there is some interest about this topic, I may do another blog post on graph mining in the future.
— Philippe Fournier-Viger is a professor of Computer Science and also the founder of the open-source data mining software SPMF, offering more than 120 data mining algorithms.