
Today, I would like to introduce an upcoming feature that will be released in the next version of SPMF (v. 2.60). It is a tool called the Memory Viewer. This tool is very simple yet useful for investigating the performance of algorithms. Here is a preview of how it works.
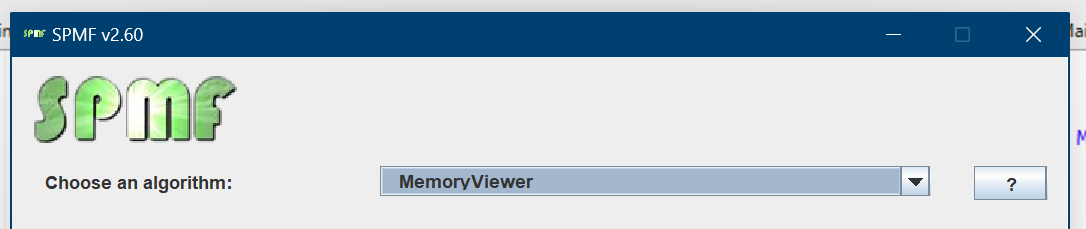
To launch the Memory Viewer in the user interface of SPMF, we need to select the algorithm “Memory Viewer” .
and then click “Run algorithm”.
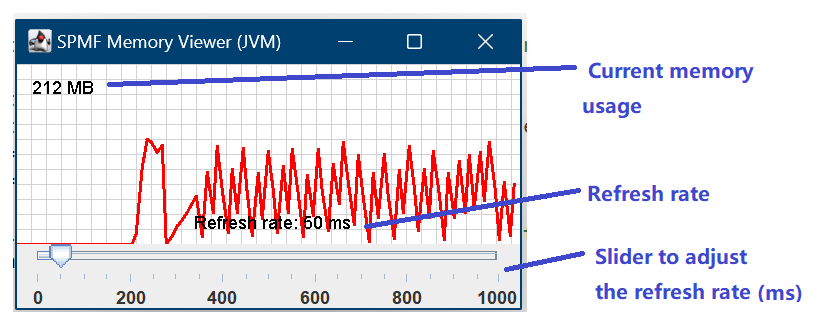
This will open a separated window for monitoring the current memory of the Java Virtual Machine (JVM) in real-time. This window is shown here on the right:
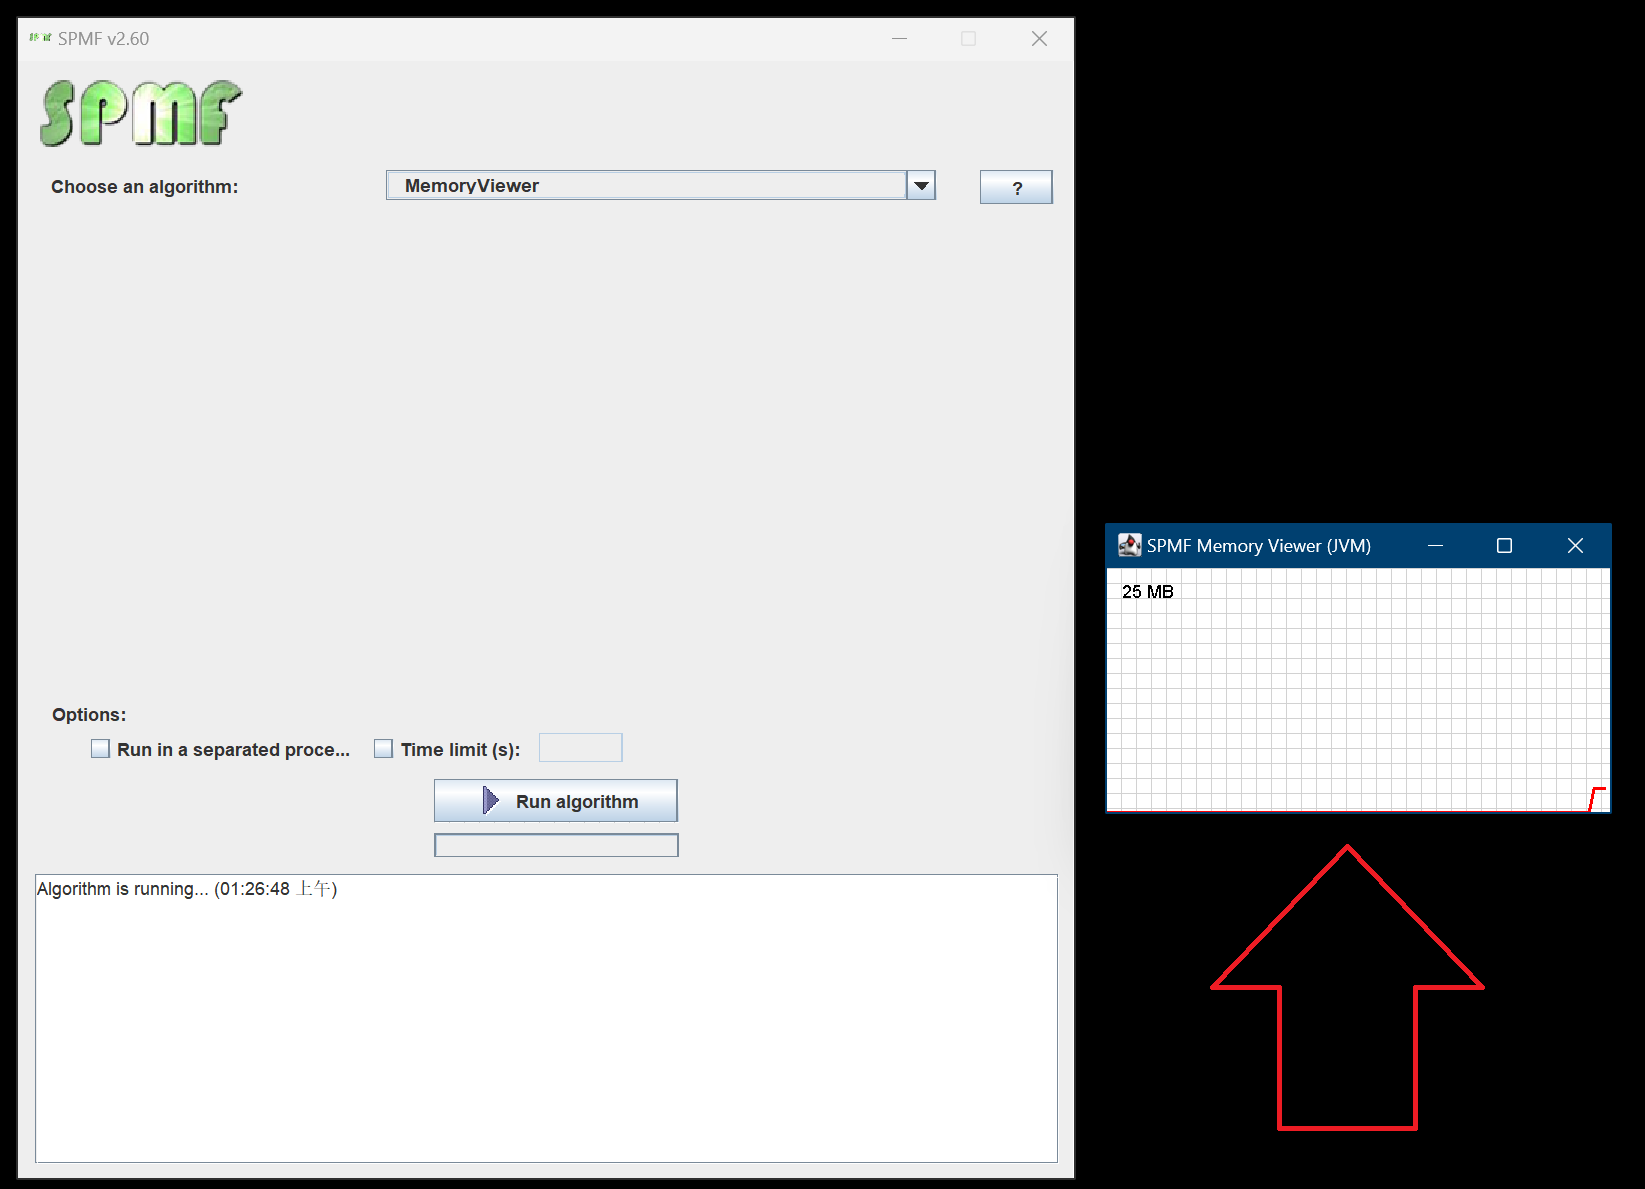
That window displays the current memory usage of the JVM and updates it every second. It displays the last 100 seconds. After opening it, you can run a data mining algorithm and the memory usage will then be updated through the algorithm’s execution like this:
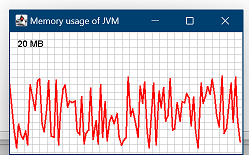
This is a very simple tool, but I think it is quite useful to get some insights about the performance of the algorithms that are running.
Note that this tool will only monitor the performance of algorithms that are running in the same JVM as SPMF. Thus, if you select the option “Run in a separated process” of SPMF to run an algorithm in a separated JVM, the memory will not be monitored.
Update: Thanks for the feedback. I have also added a slider to let the user change the refresh rate of the Memory Viewer:
That is all for today. I just wanted to show you some upcoming feature, as I am currently working on the next release of SPMF. If you have some suggestions, please leave them in the comment section below.
—
Philippe Fournier-Viger is a distinguished professor working in China and founder of the SPMF open source data mining software.


