
Today, I will give you a preview of another upcoming feature of SPMF, which will be released in the next version of SPMF (2.59). It is the Graph Viewer tool.
The Graph Viewer is a simple tool for visualizing graphs. The Graph Viewer is designed to display graphs that can be directed or undirected, and have labels. The Graph Viewer can also automatically choose an appropriate layout for visualizing a graph.
Why a Graph Viewer in SPMF? It will be used to allow users to visualize input files containing graphs and output files containing frequent subgraphs. This is useful to visualize the inpu files of frequent subgraph mining algorithms such as gSpan, cgSpan and TKG, as well as the patterns that are discovered by these algorithms (frequent subgraphs).
I have completely implemented the Graph Viewer in Java, without using external libraries so as to avoid dependencies and to make it as lightweight and fast as possible, a long-time design goal of SPMF. In fact, unlike many other data mining libraries and open-source projects, SPMF do not have any external dependencies and the code is well optimized. This ensure the stability of the project and avoid problems that could arise from relying on external libraries.
Let me now show you the current features of the Graph Viewer, which may still be updated or improved in the final release.
Opening a graph file
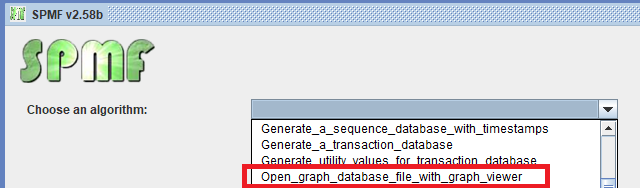
The first feature is to open an input file containing one or more graphs. This is done by selecting the Graph Viewer tool:
Then, let’s say that we open the example file contextTKG.txt offered in SPMF, which contains three graphs. The Graph viewer will display graphs in a window like this:
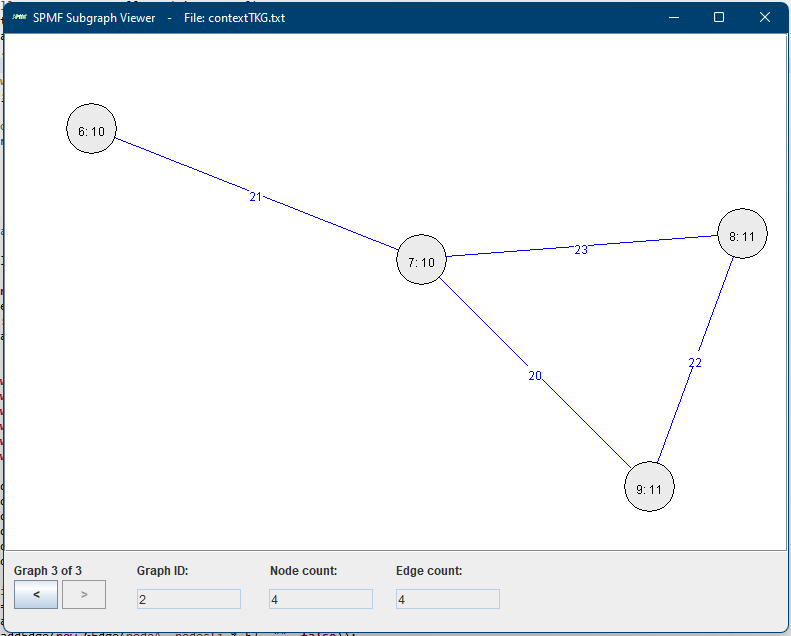
Here we see the third graph from the file. At the bottom, there are two buttons < > for navigating to the previous or the next graph. In the above picture, the third graph is shown (Graph 3 of 3). This graph has ID 3, and contains 4 nodes and 4 edges, as indicated in the bottom part of the Window. The nodes are displayed with a text of the form x:y where x is the node ID and y is the node label. Edges are displayed in blue color with their labels.
To display the graph in a pleasant way, I have implemented a forced directed graph layout algorithm, which is the Fruchterman/Reingold (1991) algorithm. It automatically places the nodes in an appropriate location so that the graph can be displayed in a beautiful way.
Opening a pattern file
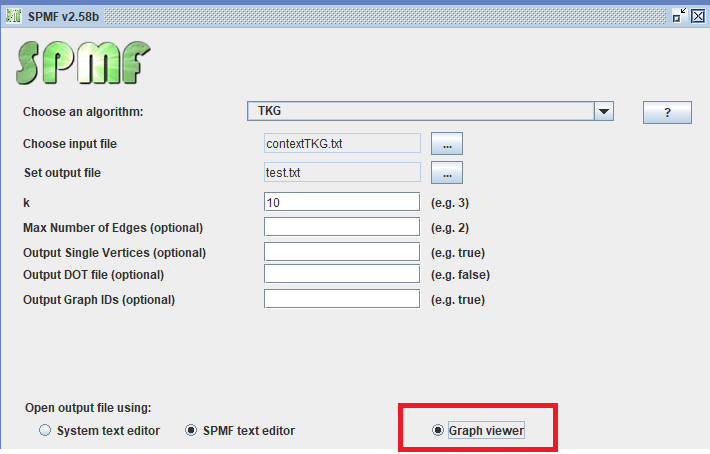
We can also use the graph viewer tool to display the frequent subgraphs found by an algorithm such as TKG. For example, here I apply the TKG algorithm and select the “Graph Viewer” tool to open the result file.
The result is 16 frequent subgraphs, which are displayed by the Graph Viewer as follows:
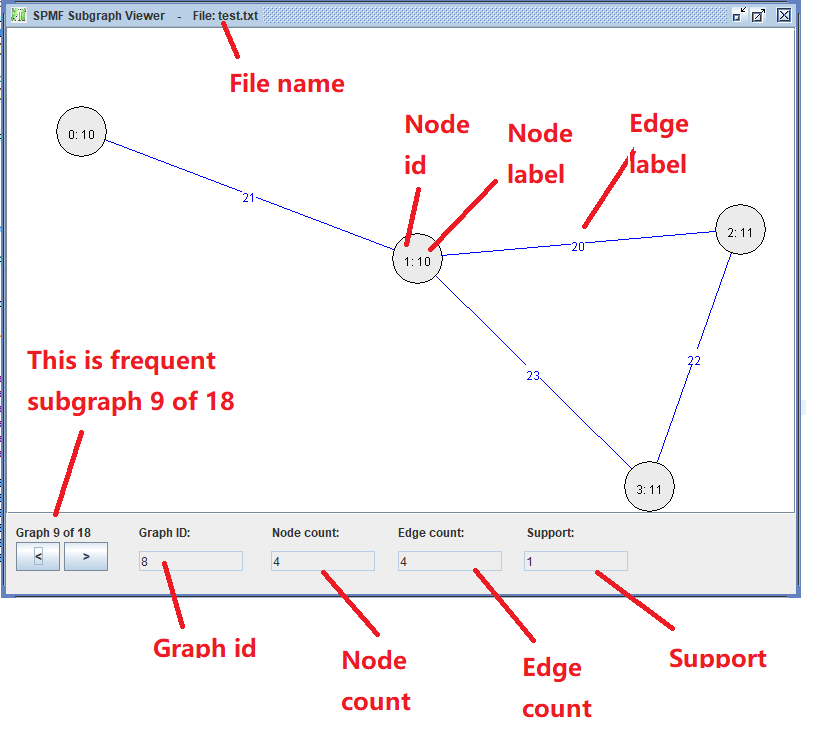
In the above picture, we see the frequent subgraph 9. We can use the buttons <> to move to the previous or next frequent subgraph, and thus view all of the 18 subgraphs that have been found. The support of each subgraph is displayed.
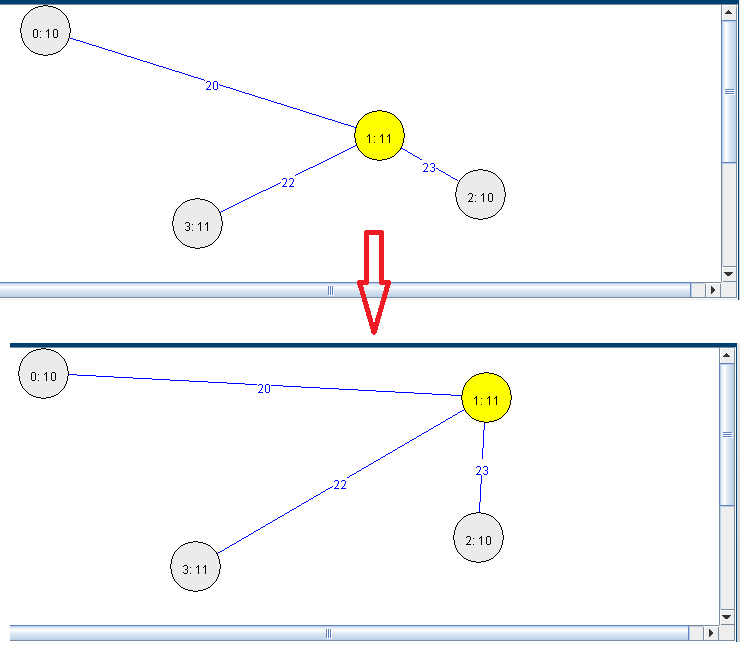
Moving the graph nodes with the mouse
Another feature of the Graph Viewer is that we can move the nodes with the mouse by dragging them over the panel:
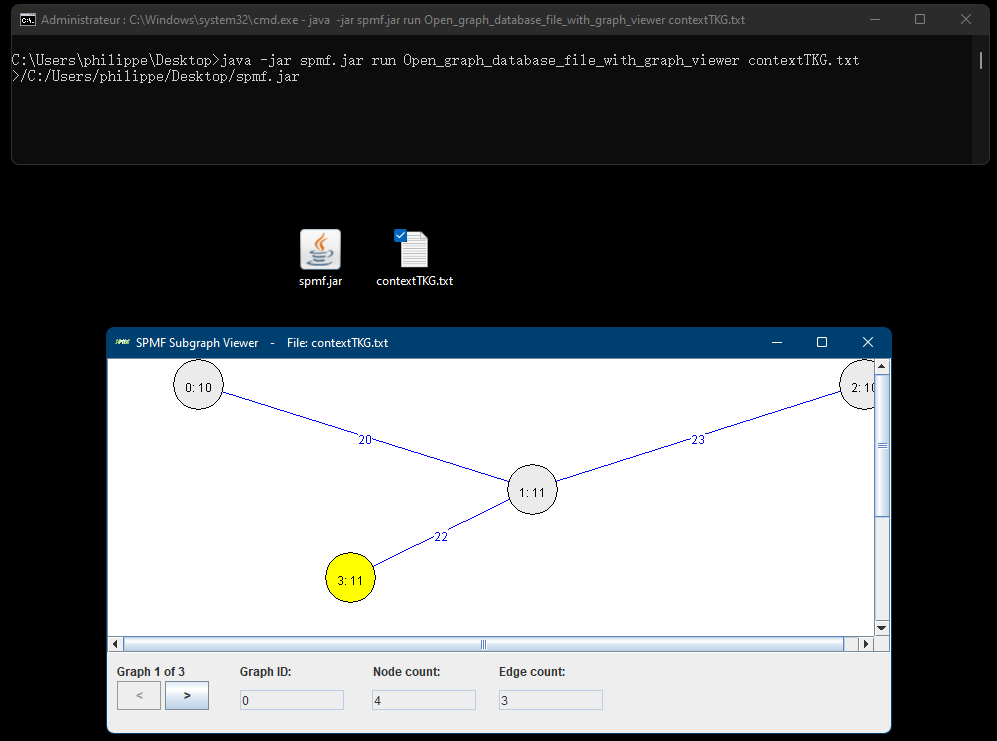
Running the graph viewer from the command line
It will be also be possible to call the Graph Viewer from the command line, just like almost all algorithms and tools from SPMF. For example, if we put the spmf.jar file in the same folder as the file contextTKG.txt, we can apply this command:
java -jar spmf.jar run Open_graph_database_file_with_graph_viewer contextTKG.txt
Then, this will start the Graph Viewer to display the file:
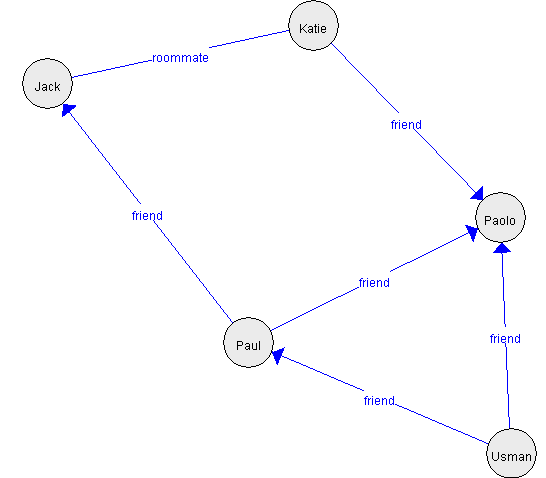
Displaying other types of graphs
The Graph Viewer is designed in a quite general way so that it could also display other types of graphs and be used for other functions in SPMF in the future. For example, below, I show an example graph that is created programmatically rather than by reading a file.

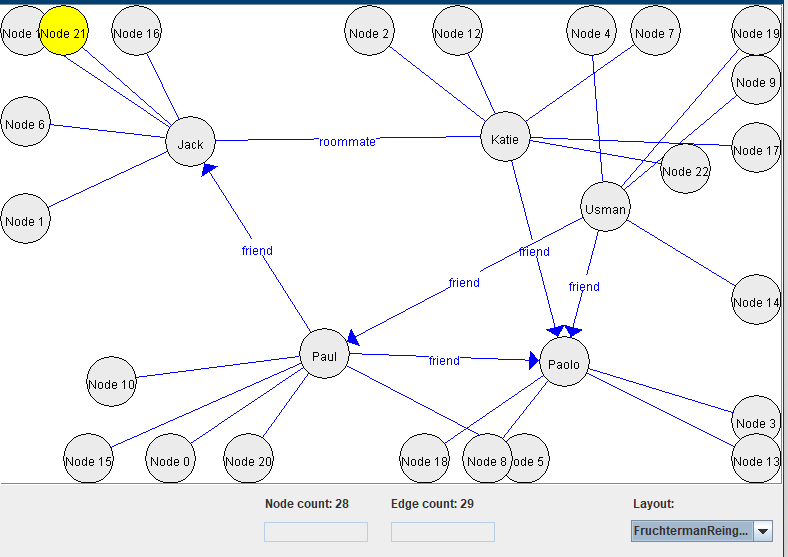
I use this example to show the display of directed and undirected edges. Also, we can also see that the automatic layout algorithm works quite well and display the graph in a proper way. Here is another example:
In the Java code, we can also change how the nodes are displayed. I did not offer this option in the user interface as I think it is less important though. What do you think?
Update: Choosing different types of graph layout
I had one hour of free time this morning, so I decided to add an option to choose different types of graph layout algorithm. For example, here we see three types of layout:
1) Using the Fruchterman/Reingold (1991) algorithm:
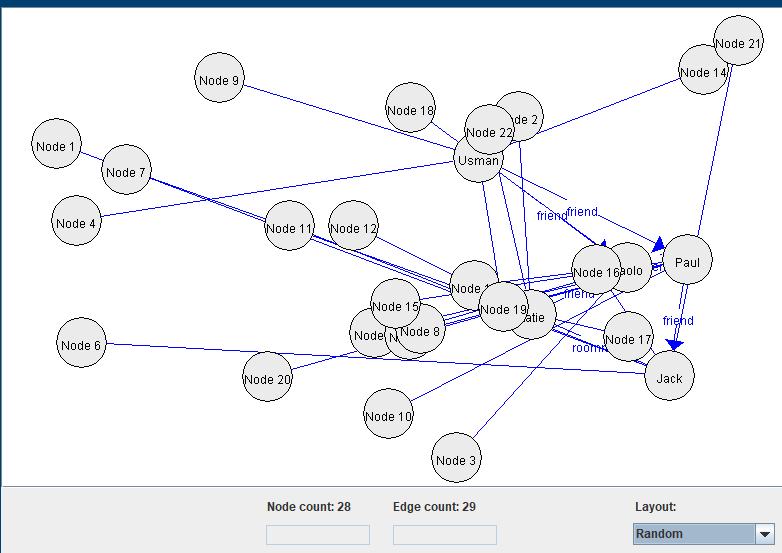
2) Using a random layout:
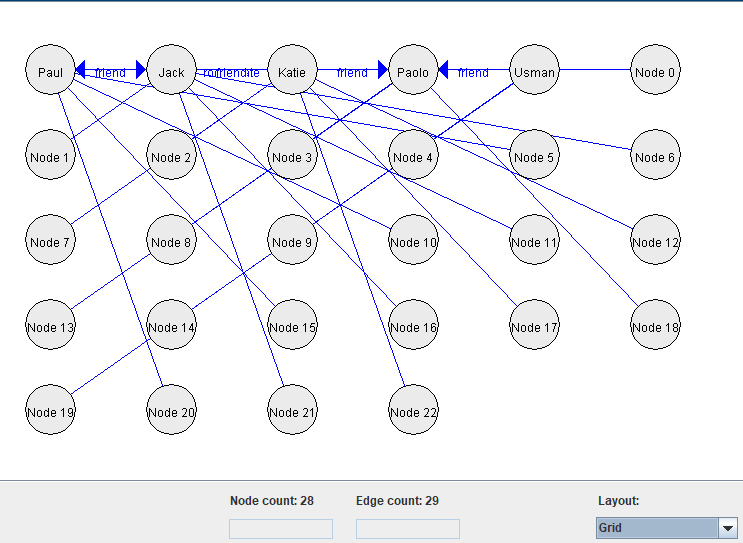
3) Using a grid layout:
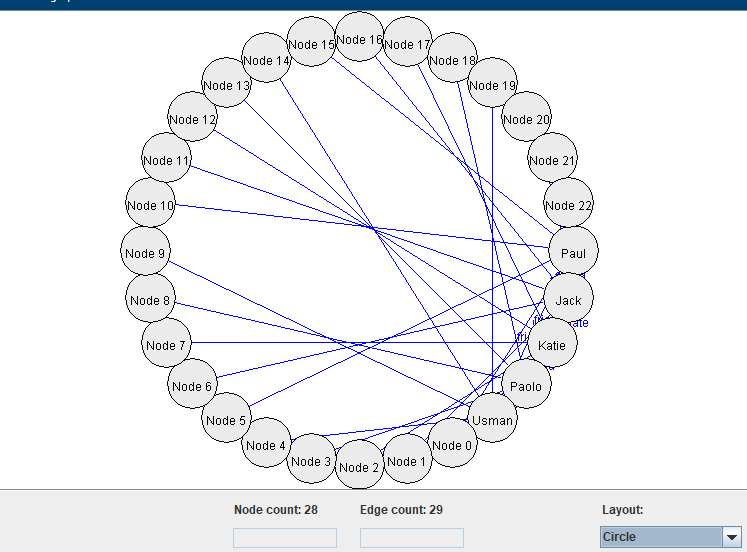
4) Using a circle layout:
I might add more graph layout algorithms later. I think that these algorithms are quite interesting.
Update 2: a few more features
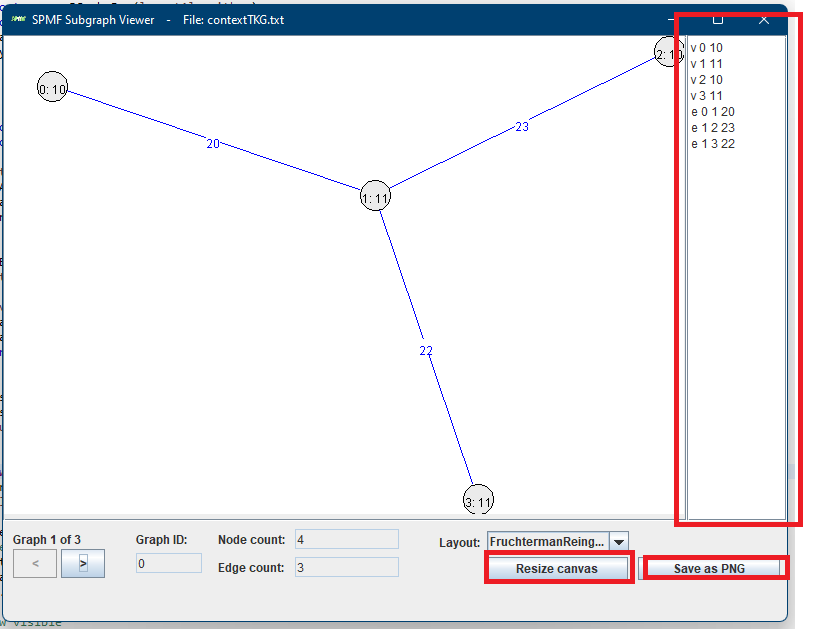
I have fixed some bugs and added a few more improvements. There is now a panel which can show the textual representations of graphs that are displayed (right side on picture below)). There is also a new button to save a graph visualization to PNG. Moreover, there is a button to resize the canvas so as to be able to show larger graphs.
Conclusion
Hope that this blog post has been interesting. My goal was to show you some upcoming feature, which I think will be useful for those working on frequent subgraph mining. If you have some suggestions to improve this tool, you may let me know in the comments below. I will consider them. Also, I might still improve this tool before it is released.
—
Philippe Fournier-Viger is a professor of Computer Science and also the founder of the open-source data mining software SPMF, offering more than 120 data mining algorithms.


