This blog post briefly explain how time series data mining can be performed with the Java open-source data mining library SPMF (v.2.06). It first explain what is a time series and then discuss how data mining can be performed on time series.
What is a time series? What is the difference with sequences?
There are two main types of sequential data considered in data mining: sequences and time series.
A time-series is an ordered list of numbers. For example, the figure below shows a time-series. This time series could represent for example, temperature readings on different days, collected with sensors. Time series are also used to represent many other types of data such as stock market data.
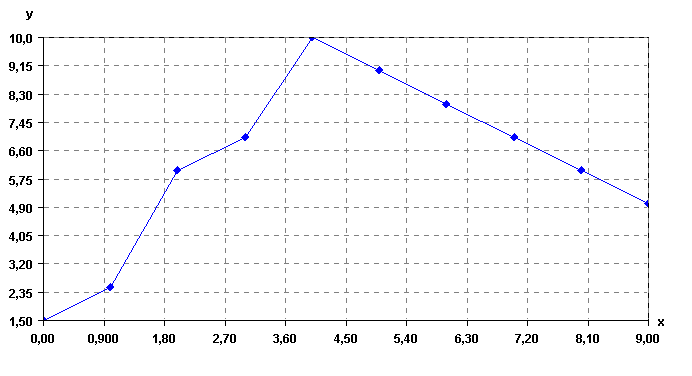
A time series
On the other hand, a sequence is an ordered list of nominal values (symbols). For example, a sequence is shown below.
a, b, c, e, g, h, a, b, c, e
This sequence indicates that an item (symbol) a, was followed by an item b, which was followed by an item c, then, e, g, h, a, b, c, and e, in that order. Sequences have also many real-life applications. They can be used for example to represent sentences in texts (sequences of words), sequences of items purchased by customers in retail stores, and sequences of webpages visited by users.
How to analyze time series?
Both time series and sequences can be analyzed using data mining techniques to discover interesting patterns for understanding the data or decision-making. Since time series are a type of numeric data, and sequences are symbolic data, the traditional techniques for analyzing time series and sequences are quite different. However, it is possible to convert time series to sequences by discretizing the time series (transforming the numbers into symbols. Then techniques for analyzing sequences can also be applied to analyze the time series.
There exists several ways of transforming time-series to sequences. One of the most popular techniques is the SAX algorithm (Lin et al., 2007). But many other techniques exist and variations. The SPMF open-source data mining library discussed in this blog post, offers a fast Java implementation of the SAX algorithm. Let’s see how it works.
Discretizing a time series
Consider the time series shown in the previous figure. It contains n=11 data points. To apply the SAX algorithm, it is necessary to specify a number of symbols w and a number of data points v. Let’s say that the number of symbols is 4 and that the number of data point is 8. The SAX algorithm will perform two steps.
First, it will convert the time series from 11 data points to 8 data points. To do this, it will split the time series into 8 segments and replace each segment by its average. This is called the piecewise aggregate approximation (PAA) of the time series. Visually, this gives the following result.
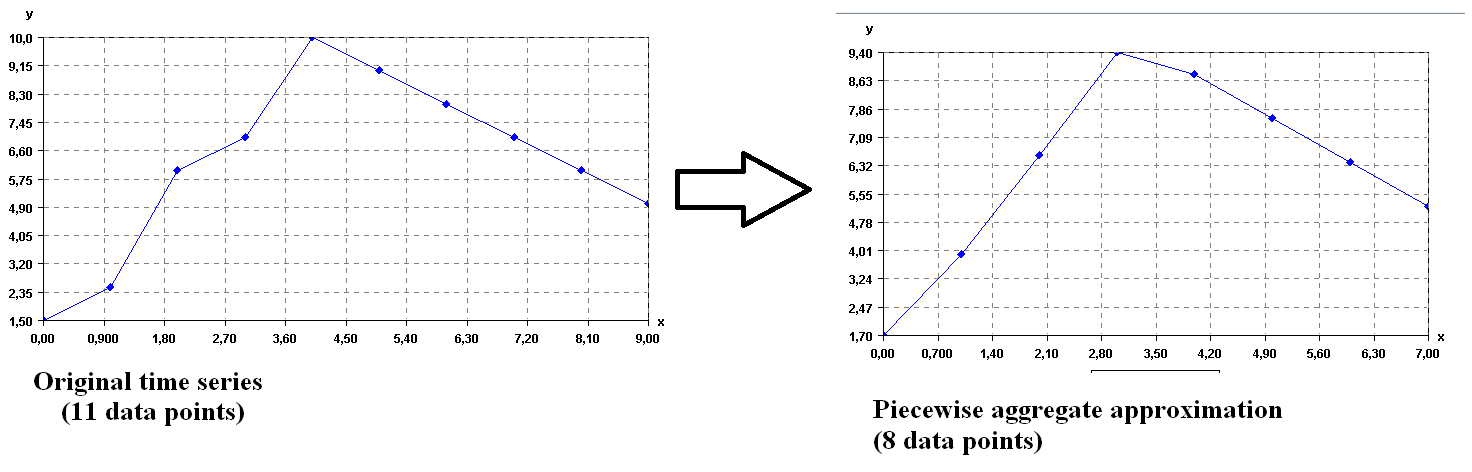
Transforming a time series to its PAA representation
As it can be seen above, transforming a time series to its PAA representation is a way of reducing the dimensionality of a time series by reducing the number of data points.
Second, the SAX algorithm transforms the PAA representation of the time series to symbols. Each data point is replaced by a symbol. The number of symbols is selected by the user (here we assume that v = 4 symbols for this example). Now, the main question is how the symbols are chosen? The main idea in SAX is to assume that values follow a normal distribution and to choose the symbol to represent various intervals of values such that each interval is equally probable under the normal distribution (for more details, see the paper of Lin et al. 2007). Applying the SAX algorithm implementation of SPMF on the time series produces the following result.
Four symbols are created:
a = [-Infinity, 4.50]
b = [4.50, 6.2]
c = [6.2, 7.90]
d = [7.90,Infinity]
Then the result is a sequence of symbols: a, a, c, d, d, c, c, b. Let’s see this more visually in the following figure.
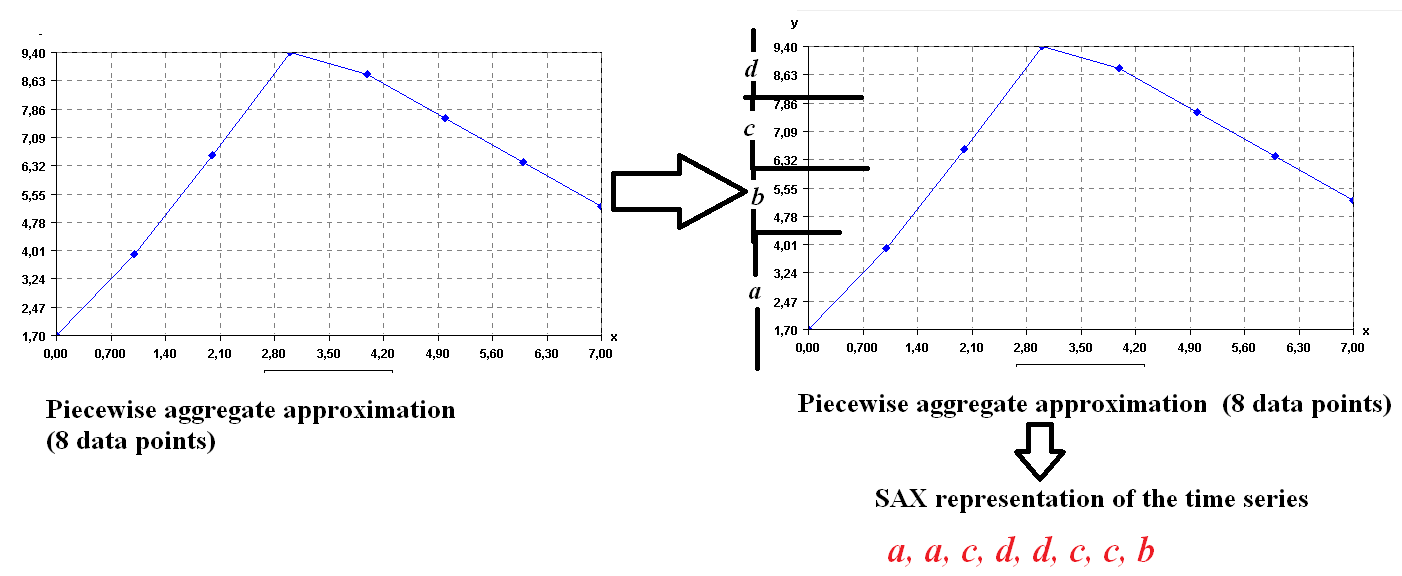
SAX representation of the time series
This sequence is the symbolic representation of the time series. Then, after a time series has been converted to a sequence, it is possible to apply traditional pattern mining algorithms on the time series.
For example, in the SPMF library, several algorithms are providing for performing data mining on sequences of symbols. However, most of them requires to have several sequences of symbols to for example find patterns common to several sequences (sequential pattern mining). If one has a single time series, this is not a problem. It is also possible to split a time series into several sequences.
Splitting a time series
In SPMF, there is currently two ways of splitting a time series: (1) splitting into segments having a given number of data points, or (2) splitting a time series into a given number of segments. For example, if we split the above time series into two segments, we would obtain:
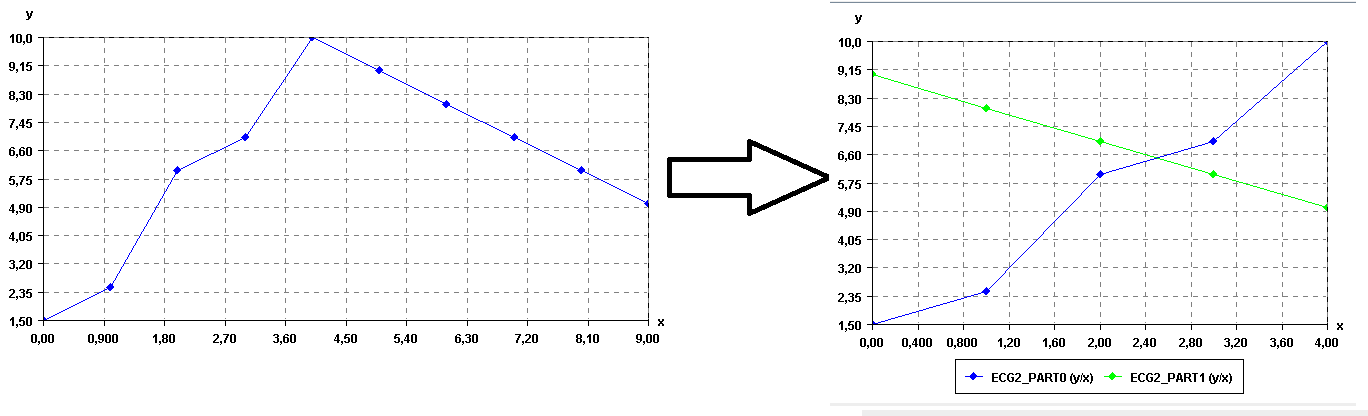
Splitting a time series
Then, these two time series could be converted to sequence of symbols using the SAX algorithm to apply traditional pattern mining algorithms such as sequential pattern mining and sequential rule mining algorithms, to find patterns that are common to these sequences. Of course, this is just a toy example, so there is no interesting patterns to be found in these time series. 😉
Removing noise in a time series using the moving average
There exists various ways of removing noise in time series. One of the simplest is to calculate the moving average of the time series. To do this, the user must specify a window size z (a number of data points). Then, each data point of the time series is replaced by the average of the previous z points. For example, if we use again the same time series, and set z to 3 points, the result is:
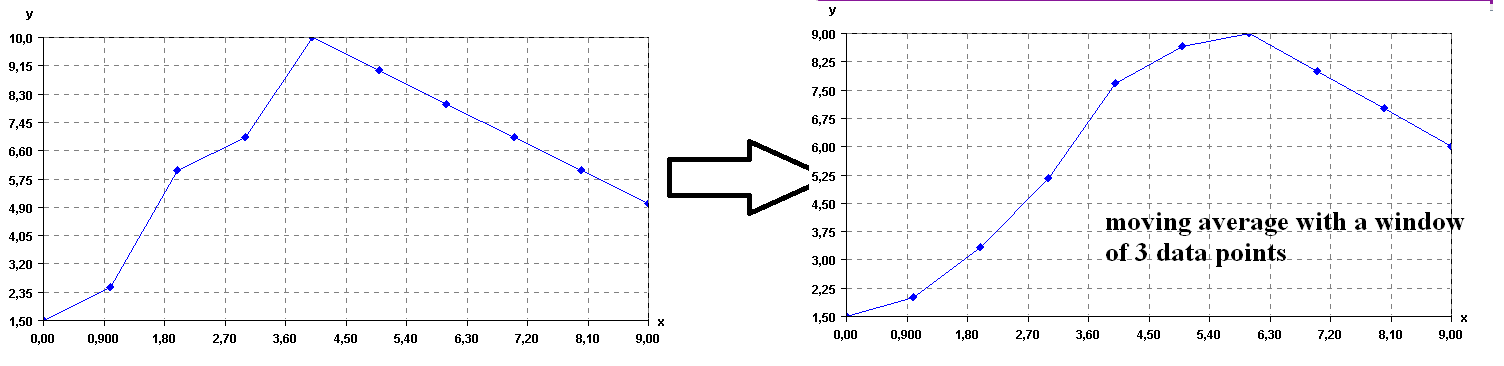
Moving average of a time series
As it can be seen in this example, applying the moving average makes the time series to become more “smooth”.
Other possibilities: time series clustering and vizualization
This blog post has given an overview of the main operations for time series mining in SPMF. More details can be found in the documentation of SPMF in the SPMF website.
Note that it is also possible to apply clustering algorithms such as K-Means, also provided in SPMF, to automatically group similar time series (time series clustering).
Besides, a time series viewer is also integrated in SPMF for visualizing time series and performing basic operation such as zooming in, zooming out, and printing.
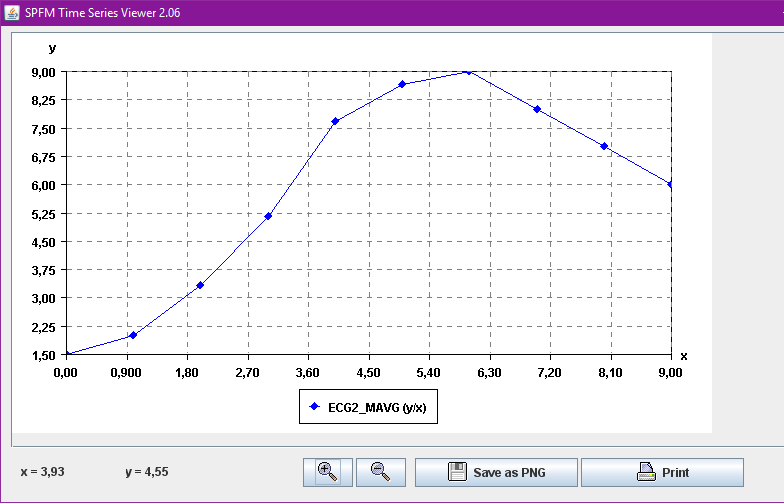
SPMF time series viewer
This time series viewer will also be improved in future versions of SPMF, with additional features for manipulating time series. Other features will also be added for time series mining. Any code submission related to time series is also welcome.
For those familiar with SPMF, all the time series operations are grouped inside a new category called “time series mining” in the user interface of SPMF:
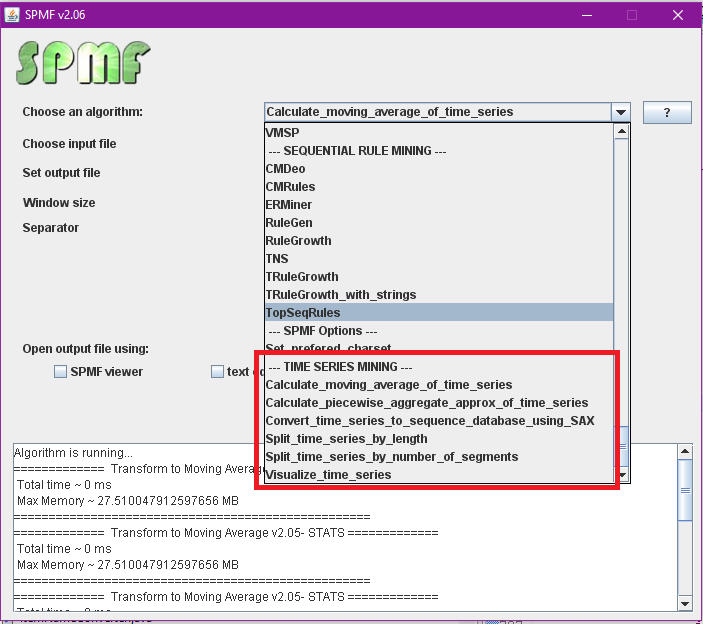
Time series operations in SPMF 2.06
Conclusion
In this blog post, we have introduced time series data mining with the SPMF Java open source data mining library. This gives a brief overview of possibilities for time series mining. Of course, there exist numerous other algorithms for time series mining. But this already provides many possibilities.
If you like this blog, you can subscribe to the RSS Feed or my Twitter account (https://twitter.com/philfv) to get notified about future blog posts. Also, if you want to support this blog, please tweet and share it!
References
Lin, J., Keogh, E., Wei, L., Lonardi, S.: Experiencing SAX: a novel symbolic representation of time series. Data Mining and Knowledge Discovery 15, 107–144 (2007)