
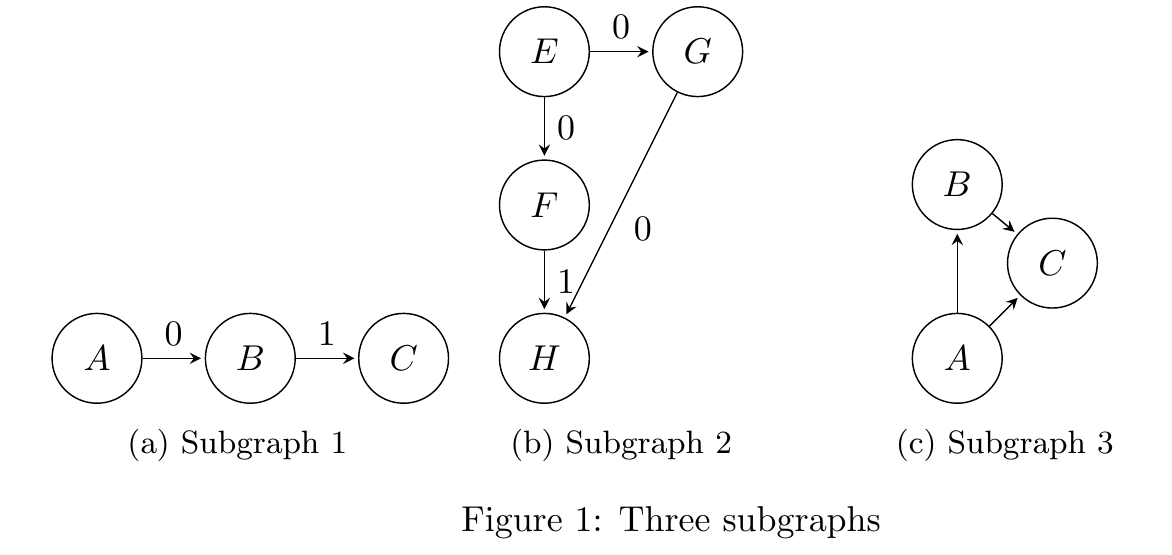
Today, I will give an example of how to draw a figure containing three subgraphs that appear side by side in Latex using the TIKZ library, and where each subgraph has a caption. This can be useful when writing research papers, where we want to discuss different types of subgraphs.
The result will be like this:
And here is the Latex code:
\documentclass{article}
\usepackage{caption}
\usepackage{subcaption}
\usepackage{tikz}
\usetikzlibrary{automata,arrows,positioning,calc}

\begin{document}


\begin{figure}
  \begin{subfigure}[b]{0.30\textwidth}
    \centering
      \begin{tikzpicture}[> = stealth,  shorten > = 1pt,   auto,   node distance = 1.5cm]
        \node[state] (v) {$A$};
        \node[state] (w) [right of=v] {$B$};
        \node[state] (t) [right of=w] {$C$};

		\path[->] (v)  edge node {0} (w);
		\path[->] (w) edge   node  {1}(t);
      \end{tikzpicture}
    \caption{Subgraph 1}
  \end{subfigure}
  \begin{subfigure}[b]{.30\textwidth}
    \centering
      \begin{tikzpicture}[> = stealth,  shorten > = 1pt,   auto,   node distance = 1.5cm]
        \node[state] (x) {$E$};
        \node[state] (y) [below of=x] {$F$};
        \node[state] (n) [right of=x] {$G$};
        \node[state] (z) [below of=y] {$H$};


		\path[->] (x)  edge node {0} (y);
		\path[->] (x)  edge node {0} (n);
		\path[->] (n)  edge node {0} (z);
		\path[->] (y) edge   node  {1}(z);
      \end{tikzpicture}
    \caption{Subgraph 2}
  \end{subfigure}
  \begin{subfigure}[b]{.30\textwidth}
    \centering
      \begin{tikzpicture}[> = stealth,  shorten > = 1pt,   auto,   node distance = 1.7cm]
        \node[state] (g) {$A$};
        \node[state] (h) [above of=g] {$B$};
        \node[state] (e) [above right= 0.3 cm and 0.3 cm of g] {$C$};
		\path[->] (g)  edge node {} (e);
		\path[->] (g)  edge node {} (h);
		\path[->] (h) edge   node  {}(e);
      \end{tikzpicture}
    \caption{Subgraph 3}
  \end{subfigure}
\caption{Three subgraphs}
\end{figure}
In this code, I use the automata package of TIKZ, which is great for drawing graphs. You could also use other packages and tweak the above example.
Hope this is useful.
—
Philippe Fournier-Viger is a distinguished professor working in China and founder of the SPMF open source data mining software.


