Today, I will continue my series of blog posts about how to write research papers. I will discuss the importance of choosing a good title for research papers, some common errors, and give some tips.
Why the title is important?
The title and abstract are some of the most important parts of a paper because this is what one will typically first look at when searching for papers. A good title will make it easy to find the paper, and increases its visibility. What is a good title? I will discuss this in details in this post. But generally speaking, it should describe the content of the paper well and make it easy for the target audience to find the paper. Moreover, a good title should not be misleading or contain errors, as it may give a bad impression to potential readers.
Some common errors
Let’s first discuss some common errors in titles of research papers:
A title containing English errors. I often see titles containing English errors. This is a very serious problem because not only it gives a bad impression to potential readers but also it gives a bad impression when applying for jobs, as the title will appear in the CVs of authors, and cannot be changed after it is published. Thus, ensuring that there is no English errors is crucial. An example is the title of a paper in the GESTS International Transactions on Computer Science and Engineering journal: “Association rules mining: A recent overview“. Here “rules” should be written as “rule”.
A title that is too short or too broad. A title should give a good overview of the content of a paper. For example, a title such as “Methods to analyze data” would be too broad, as it does not tell what kind of methods is used or what kind of data is analyzed. A better title could be “Clustering algorithms to analyze e-learning data”. This is already much better.
A title that is too long. A common mistake for young researchers is to write titles that are very long to try to make the title very specific. Just like titles that are too broad, a title that is too specific is bad. A good rule of thumb is to try to write titles containing no more than 10 words. An example of title that is too long is: “Management and analytic of biomedical big data with cloud-based in-memory database and dynamic querying: a hands-on experience with real-world data” published in the proceedings of the KDD 2014 confeence. This title contains about 24 words and in my opinion contains a lot of unnecessary information. For example, “a hands-on experience with real-world data” could be removed to make the title shorter. I would rewrite the title as: “Biomedical data analytics with distributed in-memory databases”. This is only 7 words instead of 24 and it keeps the main information.
A title that contains unnecessary information. A good title should not contain unnecessary information. An example is the word “new” in this title “New algorithms for parking demand management and a city-scale deployment.” from a KDD 2014 paper. The word “new” should be removed since the algorithms are always new in a researchpaper. Another example is this title “Applying data mining techniques to address critical process optimization needs in advanced manufacturing.” from KDD 2014. In that title, the words “applying”, “needs” and “advanced” are unnecessary. The title could be rewritten as : “Data mining techniques for critical process optimization in manufacturing”.
A few more tips
Here are a few additional tips about writing a title:
As shown in the above example, a title can often be made shorter. Thus, after writing a title, one should spend some time to think about how to make it shorter.
A good idea is to write several potential titles and then choose the best one. One may also ask a colleague to help select the best title.
When choosing the title, one should think about the target audience of the paper. In particular, one should think about which keywords may be used to search for the paper, to ensure that other researchers will find it. Sometimes a paper may have more than one target audience. Thus, one may have to take a decision.
Avoid using abbreviations in titles as the reader may not be familiar with them. If the abbreviations are well-known such as H2O, it is no problem. But if the abbreviations are not well-known for the target audience, it will reduce the visibility of the paper.
A title does not need to be a complete sentence. A good title is short and descriptive.
A good way to learn how to write titles is to look at the titles of other papers in the same field.
Conclusion
I hope that you have enjoyed this blog post. If you have other suggestions or questions, please share them in the comment section below. If there is interest, I will continue writing more blog posts on paperwriting in the future.
—- Philippe Fournier-Viger is a professor of Computer Science and also the founder of the open-source data mining software SPMF, offering more than 145 data mining algorithms.
Today, I will give some advice about how to write research papers. This will be the first post of a series of posts on this topic. In this post, I will focus on one aspect, which is to use simple structures and expressions to present the content of a paper. This is a very simple idea. But it very important.
Generally, the goal of writing a paper is to communicate some idea (the research contributions) to the reader. To do that, it is important to write in a clear way by using simple structures. Otherwise, the reader may not understand well your paper. This is different from other types of texts such as poetry or novels, where writing using complex structures, rare words and expressions can be considered better.
Let me give you some examples. Below is a table with some unnecessarily complex structures (left) which can be replaced by more simple structures (right) to express the same idea:
Complex structure
Simple structure
the great majority
most
an example of this is the fact that
for example
based on the fact that
because
for the purpose of
for
in a number of cases
sometimes
in order to
to
with the exception of
except
As shown above, it is often possible to replace four or five words by fewer words to express the same idea.
Why is it important to do that?
It saves space.
Readers better understand the content of the paper. In particular, the paper is easier to read for non native English speakers.
If you want to know more about this, there is a good list of complex structures that can be replaced by more simple structures in the book “How to write an publish a Scientific paper” by R. A. Day et al.) . You can click here for the list (PDF). I have used this list to prepare the above examples.
Besides, what I discussed today, I also recommend to avoid writing very long sentences. A sentence should not contain more than a single idea. Also, the structure of a paper is very important. I will discuss this in another blog post.
—- Philippe Fournier-Viger is a professor of Computer Science and also the founder of the open-source data mining software SPMF, offering more than 145 data mining algorithms.
In this blog post, I will talk about the importance of attendingacademicconferences for researchers. I will answer two important questions: Why it is important to attend conference? and What one should do at an academic conference to get the most benefits?
Academic conferences
Academicconferences are meetings attended by researchers mostly from academia,. Typically attendees are professors, students, researchers, and researchers from the government or industry. Academicconferences are different in various fields. But generally, a person who wishes to attend a conference will submit a paper or an abstract to the conference. Then, the paper or abstract is evaluated by some researchers, and if the paper is accepted, the person can attend the conference and present his research work at the conference. Generally, one presents his work as a short talk (10 to 30 min) or as a poster during a poster session.
Why is it important to attend a conference?
First, it is important to understand that different people will attend a conference and their goals are not the same. For the student, attending a conference has several benefits:
Getting feedback on hisresearch project,
Discussing ideas with other researchers,
Learning about other projects in his field,
Practicing giving a talk in front of an audience (this is not an easy task… it requires to explain your work in a simple way in a fixed amount of time) and answering questions about your work sometimes in a foreign language.
Connecting with other people in your field that you may work with in the future.
Travelling (this is not the main goal of attending a conference but it is always nice to see other places),
For the professors, the benefits are similar. But after a few years of working in the same research community, the focus starts to change from attending paper presentations to connecting with people. Actually, a researcher should not work alone if he wants to be successful. Thus, to create opportunities, it is important to connect with other researchers. In my case, the best part of the conference is thus to meet and talk with other researchers, rather than attending the paper sessions. This year, for example, I have attended the PAKDD 2018 conference and it has been great. I have attended some good talks. But most importantly I had discussions with many researchers, including some that I often see on some papers but had never met. This can create some new opportunities.
For researchers from the industry or government,academicconferences are useful to get familiar with the new methods developed in academia, and sometimes to try to recruit people from academia, and also meet researchers.
What one should do at an academic conference?
Now, I will give some advices about what one should do when attending a conference. The first thing is to prepare your presentation before attending the conference (if you have to give a talk). By doing this, you will not be worried about giving a talk and can then focus on listening to other talks and meeting people.
The second advice is to carefully look at the program (schedule) of the conference to select the events and talks that are the most interesting for you to attend.
The third advice is to check the list of people who will attend the conference to see which people from your field will attend the conference. This can give you some idea about who you may want to try to talk with.
The fourth advice is to try to attend all the social activities and try to talk with as many people as possible. If you have name cards, bring some with you, and exchange it with other people, or ask for their name cards.
The fifth advice is to focus on attendingconferences that are good and relevant to your field. If one attends conference that are irrelevant, of low quality or cover a too broad field of research, then he is unlikely to meet people that will be interesting for his research work, and he may not get interesting feedback on his work. Thus, it is always important to send papers to relevant conferences and journals.
Conclusion
In this blog post, I discussed the importance of attendingacademicconferences and what one should do at academicconferences to get the most benefits out of it. Academicconferences are a very important activity to be a successful researcher, as sooner or later in the career of a researcher, it is necessary to collaborate with others on projects, apply for grants, organize events, and other things.
— Philippe Fournier-Viger is a professor of Computer Science and also the founder of the open-source data mining software SPMF, offering more than 145 data mining algorithms.
In this blog post, I will discuss the PAKDD 2018 conference (Pacific Asia Conference on Knowledge Discovery and Data Mining), in Melbourne Australia, from the 3rd June to the 6th June 2018.
About the PAKDD conference
PAKDDis an important conference in the data science / data mining research community, mainly attended by researchers from academia. This year was the 22nd edition of the conference, which is always organized in the pacific asia region. In the last few years, I have attended this conference almost every year, and I always enjoy this conference as the quality of research papers is good. If you are curious about previous conferences, I have previously written reports about the PAKDD 2014 and PAKDD 2017 conferences.
The conference was held in the Grand Hyatt Hotel, in Melbourne, Australia, a modern city.
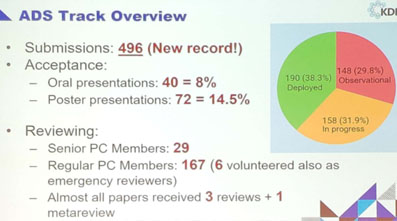
During the opening ceremony, several statistics were presented about the conference. I will share some pictures of some slides below that give an overview of the conference.
A picture of the opening ceremony
This year, more than 600 papers were submitted, which is higher than last year, and the acceptance rate was around 27%.
The papers were published in three books published by Springer in the LNAI (Lecture Notes in Artificial Intelligence) series.
Below is some information about the top 10 topics of the papers that were submittedBelow is some information about the top 10 accepted areas, where more papers have been accepted. For each topic, two values are indicated. The first one indicates the percentage of papers on this topic, while the second one indicates the acceptance rate of the topic.
Below, there is a chart showing the acceptance rates and attendance by countries. The top two countries are the United States and China. Five workshops have been organized at PAKDD2018, as well as a data competition., and three keynote speakers gave talks.
And here is the list of previous PAKDDconference locations:
It was also announced that PAKDD 2019 will be held in Macau (http://pakdd2019.medmeeting.org/Content/91968 ), China. Moreover, I also learnt that PAKDD 2020 should be in Qingdao, China, and PAKDD 2021 should be in New Dehli, India.
Keynote speech by Kate Smith Miles
A very interesting Keynote speech was given by Kate Smith-Miles with the title “Instance Spaces for Objective Assesment of Algorithms and Benchmark Test Suites“. I think that this presentation was very interesting and can be useful to many, so I will give a brief summary of the key points and provides a few pictures of the slides with comments. What is the topic of this talk? It is about the evaluation of data mining algorithms to determine which algorithm is the best and in which situation(s).
In data mining, usually, when a new algorithm is proposed, it is compared with some state-of-the-art algorithms or baseline algorithm to show that the new algorithm is better. According to the No Free Lunch Theorem, it is quite difficult to design an algorithm that is always better than all other algorithms. Thus, an algorithm is typically better than other algorithms only in some specific situations. For example, an algorithm may perform better on datasets (instances) that have some specific properties such as being dense or sparse. Thus, the choice of datasets used to evaluate an algorithm is important as results will then provides insights on the behavior of the algorithm on datasets having similar features. Thus, to properly evaluate an algorithm, it is important to choose a set of databases (instances) that are diverse, challenging and real-world like.
For example, consider the Travelling Salesman Problem (TSP), a classic optimization problem. On the slide below, two instances are illustrated, corresponding to Australia and United States. The database instance on the left is clearly much easier to solve for the TSP problem than the one on the right.
Thus, an important question is how the features of database instances help to understand the behavior of algorithms in terms of weaknesses and instances. Some other relevant questions are how easy or hard are some classic benchmark instances? how diverse are they (do they really allow to evaluate how an algorithm behave in most cases, or does these instances do not cover some important types of databases)? do the benchmark instances are representative of real-world data?
To address this problem, the speaker has developed a new methodology. The main idea is that database instances are described in terms of features. Then, a set of instances can be visualized to see how well they cover the space of all database instances. Moreover, by visualizing the space of instances, it is easier to understand when an algorithm works well and when it doesn’t. Besides, in the proposed methodology, it is suggested to generate synthetic instances using for example a genetic algorithm to have instances with specific features. By doing that, we can ensure to have a set of instances that provide a better coverage of the instance space (that is more diverse) for evaluating algorithms, and thus provide a more objective assessment of the strengths and weaknesses of algorithms.
Below, I show a few more slides that provides more details about the proposed methodology. This is the overall view. The first step is to think about why a problem is hard and what are the important features that makes an instance (database) a difficult one. Moreover, what are the metrics that should be used to evaluate algorithms (e.g. accuracy, error rate).
The second step is about creating the instance spaces based on the selected features from the previous step, and determine which ones are more useful to understand algorithm performance. The term step is to collect data about algorithm performance and analyze in which parts of the space and algorithm performs well or poorly. This is interesting because some algorithm may perform very well in some cases but not in others. For example, if an algorithm is the best even in just some specific cases, it may be worthy research.In step 4, new instances are generate to test other cases that have not been tested by the current set of instances. Then, the step 1 can be repeated again based on results to gain more information about the behavior of algorithms.
So this is my brief summary of they key ideas in that presentation. Now, I will give you my opinion. This presentation highlights an important problem in data mining, which is that authors of new algorithms often choose just a few datasets where their algorithm perform well to write a paper but ignore other datasets where their datasets do not perform well. Thus, it sometimes become hard for readers to see the weaknesses of algorithms, although there is always some. This is also related to the problem where authors often do not compare their algorithm with the state-of-the-art algorithms and do not use appropriate measure to compare with other algorithms. For example, in my field of pattern mining, many papers do not report the memory consumption or compare new algorithms with outdated algorithms.
Organization of the conference
The conference is quite well-organized. The location at the Grand Hyatt Hotel is fine, and the city of Melbourne is also a great city with many stores and restaurants, which is interesting and convenient. By registering to the conference, one has access to the workshops, paper presentations, banquet and a welcome reception. Here is a picture of the registration desk, and conference badge:
Keynote by Rajeev Rastogi (director of machine learning at Amazon)
The speaker first gave an overview machine learning applications at Amazon. Then, he discussed question answering and product recommendation. Here is a slide showing the ecosystem of Amazon.
They use machine learning, to increase product selection, lower prices, reduce delivery times to improve customer experience, and maintaining customer trust. Here is an overview:
There is a lot of applications of Machine Learning at Amazon. A first application is product demand forecasting, which consists of predicting the demand of a product up to one year in the future.
For this problem, there is several problems to solve such as the cold start problem (having no data about new products), some products having seasonal patterns, and some products having demand spikes. Demand prediction is used by management to make orders of products, to make sure that products are in stock at least 90% of the time when a user wants to buy it.
Another key application is product search. Given a query made by a user, the goal is to show relevant products to the user. Some of the challenges are shown below:
Another application is product classification, which given a product description provided by a seller, map it to the appropriate node in a taxonomy of products. Some of the challenges are as follows:
Another application is product matching, which consists of identifying duplicate products. The reason is that if the user sees several times the same products in the search results, it gives a bad user experience. Some of the challenges are:
Another application is information extractionfrom review. Many products receive thousands of reviews, which a user typically cannot read. Thus, Amazon is working on summarizing reviews, and generating product attribute ratings (ratings of specific features of products such as battery life and camera). Some of the challenges are to identify which attributes of products are relevant, identifying synonyms (sound vs audio), coping with reviews written in an informal way and linguistic style.
Another application is product recommendation, which consists of “recommending the right product to the right customer in the right place at the right time”.
Another application is the use of drones to deliver packages safely to homes in 30 minutes. This requires for example to avoid landing on a dog or child.
Another application is robotics to pick and transport products from shelves to packaging areas in Amazon warehouse, called “fullfillment centers”.
Another application is a visual search app, which let users take a picture of a product to find similar products on Amazon.
Another application is Alexa, which requires voice recognition.
Another application is product question answering. On the Amazon website, users can ask question about products. A first type of questions is about product features such as: what is the weight of a phone? Some of these questions can be answered automatically by extracting the information from the product description or user reviews. Another type of question is about product comparison and compatibility with other products. Some of the challenges related to question answering are:
Here is a very high level overview of the question answering system architecture at Amazon. It relies on neural networks to match snippets of product description or reviews to user questions.
Another problem is product size recommendation to user. This is an important problem because if users make incorrect purchases, they will return the products, which is costly to handle. Some of the challenges are:
The conference banquet
The banquet was organized also at the Grand Hyatt hotel. It was a nice dinner with a performance done by some Australian aboriginal people. Then, it was followed by a brief talk by Christos Faloutsos, and the announcement of several awards. Here is a few pictures.
The performance:
The best paper awards:
Last day
On the last day, there was another keynote, and also results from the PAKDD data competition, as well as more paper presentation
The lack of proceedings
A problem was that the proceedings of PAKDD2018 were not offered to the attendees, neither as a book or a USB drive.During the opening ceremony, it was said that it was a decision of the organizers to only put the PDF of camera-ready articles on the PAKDD2018 website. Moreover, they announced that they ordered 30 copies of the proceedings (books) that would be available for free before the end of the conference. Thus, I talked with the registration desk to make sure that I would get my copy of the proceedings before the end of the conference. They told me to send an e-mail to the publication chairs, which I did. But at the end of the conference, the registration desk told me that the books would just not arrive.
So I left Australia. Then, on the 14th June, about 8 days after the conference, the publication chairs sent me an e-mail to tell me that they would receive the books in about two more weeks, thus almost one month after the conference. Moreover, they would not ship the books. Thus, if we want to have the book, we would have to go back to Melbourne to pick it up.
Conclusion
This year, PAKDD was quite interesting. Generally, the conference was well-organized and I was able to talk with many other researchers from various universities and also the industry. The only issue was that the proceedings were not available at the conference. But overall, this is still a small issue. Looking forward to PAKDD 2019in Macau next year!
— Philippe Fournier-Viger is a professor of Computer Science and also the founder of the open-source data mining software SPMF, offering more than 145 data mining algorithms.
This week I have attended the ChinaInternational Big Data IndustryExpo 2018 in Guiyang, China. I will describe this event and some of the key things that I have observed so far.
What is the China International Big Data Industry Expo?
It is an international event targeted toward the industry and focused on big data, which is aimed at an international audience and held every year in Guiyang, China (capital of Guizhou province, in the south of China). This conference is a major conference in China. It is in fact supported at the national level event by the Chinese government. Hence, it is a very large scale event. It was in fact, announced everywhere in the city from the airport to public park signs and banners on buildings.
The conference has many activities organized from the 24th May to 29th May, such as more than 50 forums on various topics related to big data, competitions, and also a large exhibition consisting of many booths that can be visited by the public. At the exhibition both national and international companies were present. Moreover, more than 350 executives from companies were said to have attended the conference, including some very famous people such as Jack Ma, the leader of Alibaba, and several government officials.
The theme of the conference this year was: big data makes a smarter world, or in other words, how big data can improve the life of people.
The opening ceremony
The opening ceremony was on the 26th. First, the Vice Chairman of the National People’s Congress of China (Wang Chen) talked for several minutes. From my notes, he mentioned that big data is an historic opportunity for China. He also mentioned the importance of protecting personal data in the era of big data, and that in the next years, the biggest amount of data in the world will be in China due to its large population.
It was also mentioned that the leader of China (Xi Jinping) sent a letter to congratulate the conference. The letter mentioned the importance of encouraging the big data industry and development to improve people’s lives, and create a leadership in China for internet technologies.
Then, the Chairman of the Standing Committee of Guizhou (Sun Zhigang) also talked. He mentioned that more than 350 executives attended the conference, and 546 guests, including people from many countries. He also suggested that convergence and integration are key for the development of technology, and mentioned topics such as using big data for poverty alleviation, integration in healthcare, and e-governance (how to handle government affairs on the internet and make government services more accessible to people). It was also mentioned that it is important to crack down on illicit, unfair competition and fraud to ensure the good development of cyberspace, and that favorable policies and platform must be provided to support the digital economy.
The Vice Minister of Industry and Information Technology of China (Chen Zhaoxiong) then also addressed the audience. He mentioned that many fields are revolutionized by big data technology, the importance of data interconnectivity, new applications and models, data governance and security, enhancing the laws related to big data, ensuring that personal privacy is respected, allowing smaller players to access data from larger players, and encouraging international collaboration.
Then, the Vice Minister of the Cyberspace Administration of China (Yang Xiaowei) explained that we must seize the opportunity of big data, and that big data is a driver of economic development. Besides, e-governance is important in China to enhance people access to government services and further increase living standards. Also, it was mentioned that big data can play an important role in healthcare, education and social insurance, and that data security is important.
Then, a few more guests also talked, including Prince Andrew, the Duke of York.
The forums
A number of forums are also held during the conference on various topics such as blockchain, sino-UK collaborations, and how big data can revolutionize the manufacturing industry. Some of them were in Chinese. Some of them had simultaneous translation in English, and some were conducted in English. At some times, there was up to 10 events in parallel. Thus, there was something for everyone.
The big data exhibition
The exhibition consisted of about 400 booths and visiting it is a great opportunity to see what is happening in the big data industry and discuss with companies. I have visited it for two days to take the time to discuss with many companies, and it was worth it. Below I show some pictures with some further comments.
There was a lot of people after the opening ceremony
The Apache booth
A prototype self-service supermarket using various technology such as face recognition and mobile payment.
A bike simulator, among various other games such as virtual reality.
Various robotic toys and robots were also on display, as well as self-driving cars.
Some systems were presented to integrate and visualize data coming from multiple sources
Several innovative products such as an interactive table
A drone for spatial mapping
Several machines were also presented for offering services to customers such as buying products or obtaining services.
Facial recognition was also a popular topic, used in many demos, due to the recent innovations in that area.
Data visualization from multiple sources
A machine dedicated for checking the health of eyes
More robots!
The booth of Jing Dong, one of the largest online retailer in China
Jing Dong is also researching the use of drones for delivery, and how to manage wharehouse more efficiently using robots (not shown).
The booth of Alibaba, another major company in China and abroad
The booth of Facebook
The booth of Foxconn, a big Chinese company The booth of Tencent, another major Chinese company
Some of the many other companies who participated to the event
Social activities
Several social activities were also organized for the guests of the conference. In particular, there was a symphony concert on 26th May, held in a park that was very beautiful. As a special guest, I was seated in the second row.
I also attended a cocktail for guests before the show.About the organization
The conference was very well organized. As a national level conference, it was clear that major resources were put to support this conference from all levels of the government. Many streets had been closed, and from what I have heard, even several days of holidays were given to workers to reduce the number of people in the city so that less cars would be on the roads, to ease transportation for people attending the conference. There was also a lot of security guards deployed in the streets around the conference to ensure high standards of security and safety for the event.
It was thus clear that the Government of China is putting major investments to support the development of the big data industry, which is very nice to see and exciting.
Why was the conference held in Guiyang? Although this city is not big in terms of population by Chinese standards (about 4 million people), in recent years, a major effort has been done to transform this city into a big data leader. In particular, it is a very popular city for data centers. Several major companies like Apple have data centers in that city.
Conclusion
As a conclusion, it is the first time that I have attended this conference, and I am glad to have accepted the invitation. The organization was well-done and there was a lot of opportunities to connect with people from the industry and see the most recent applications of big data. If I have time, I would definitely consider attending this conference again in the future. Hope you have enjoyed reading😉 If you want to read more, there are many other articles on this blog. and you can also follow this blog on Twitter @philfv .
— Philippe Fournier-Viger is a professor of Computer Science and also the founder of the open-source data mining software SPMF, offering more than 145 data mining algorithms.
In this blog post, I will talk about the vision of the Semantic Web that was proposed in the years 2000s, and why it failed. Then, I will talk about how it has been replaced today by the use of data mining and machine learning techniques.
What is the Semantic Web?
The concept of Semantic Web was proposed as an improved version of the World Wide Web. The goal was to create a Web where intelligent agents would be able to understand the content of webpages to provides useful services to humans or interact with other intelligent agents.
To achieve this goal, there was however a big challenge. It is that most of the data on the Web is unstructured, as text. Thus, it was considered difficult to design software that can understand and process this data to do some meaningful tasks.
Hence, a vision of the Semantic Web that was proposed in the years 2000s was to use various languages to add metadata to webpages that would then allow machines to understand the content of webpages and do reasoning on this content.
Several languages were designed such as RDF, OWL-Lite,OWL-DL, OWL-FULL and also some query languages like SparQL. The knowledge described using these languages is called ontologies. The idea of an ontology is to describe various concepts occurring in a document at a very high level such as car, truck, and computer, and then to link these concepts to various webpages or resources. Then, based on these ontologies, a software program could use reasoning engines to reason about the knowledge in webpage and perform various tasks based on this knowledge such as finding all car dealers in a city that sell second-hand blue cars.
The fundamental problems of the Semantic Web
So what was wrong with this vision of the Semantic Web? Many things:
The languages for encoding metadata were too complex. Moreover, encoding metadata was time-consuming and prone to errors. The proposed languages for adding metadata to webpages and resources were difficult to use. Despite the availability of some authoring tools, describing knowledge was not easy. I have learned to use OWL and RDF during my studies, and it was complicated as OWL is based on formal logics. Thus, learning OWL required a training and it is very easy to use the language in a wrong way if we don’t understand the semantics of the provided operators. It was thus wrong to think that such a complicated language could be used at a large scale on the Web. Also because such languages are complicated, they are prone to errors.
The reasoning engines based on logics were slow and could not scale to the size of the Web. Languages like OWL are based on logic, and in particular description logics. Why? The idea was that it would allow to use inference engines to do logical reasoning on the knowledge found in the webpages. However, most of these inference engines are very slow. In my master thesis in the years 2000s, reasoning on an OWL file with a few hundred concepts using the state-of-the-art inference engines was already slow. It could clearly not scale to the size of the Web with billions of webpages.
Languages were very restrictive. Another problems is that since some of these languages were based on logics, they were very restrictive. To describe some very simple knowledge it would work fine. But to describe something complicated, it was actually very hard to model something properly. And many times the language would not just not allow to describe something.
Metadata are not neutral, and can be easily tweaked to “game” the system. The concept of adding metadata to describe objects can work in a controlled environment such as to describing books in a library. However, on the Web, bad people can try to game the system by writing incorrect metadata. For example, a website could write incorrect metadata to achieve a higher ranking in search engines. Based on this, it is clear that adding metadata to webpages cannot work. This is actually the reason why most search engines today do not rely much on metadata to index documents.
Metadata is quickly obsolete and need to be always updated.
Metadata intereporability betwen many websites or institutions is hard. The whole idea of describing webpages using some common concepts to allow reasoning may sound great. But a major problem is that various websites would then have to agree to use the same concepts to describe their webpage, which is very hard to achieve. In real-life, what would instead happen is that a lot of people would describe their webpages in inconsistent way, and the intelligent agents would not be able to reason with these webpages as a whole
Because of these reasons, the concept of Semantic Web was never achieved as in that vision (by describing webpages with metadata and using inference engines based on logics).
What has replaced that vision of the Semantic Web?
In the last decades, we have seen the emergence of data mining (also called big data, data science) and machine learning. Using data mining techniques, it is now possible to directly extract knowledge from text. In other words, it has become largely unnecessary to write metadata and knowledge by hand using complicated authoring tools and languages.
Moreover, using predictive data mining and machine learningtechniques, it has become possible to automatically do complex tasks with text documents without having to even extract knowledge from these documents. For example, there is no need to specify an ontology or metadata about a document to be able to translate it from one language to another (although it requires some training data about other documents). Thus, the focus as shifted from reasoning with logics to use machine learning and data mining techniques.
It has to be said though that the languages and tools that were developed for the SemanticWeb have some success but a much smaller scale than the Web. For example, it has been used internally by some companies. Research about logics, ontologies and related concepts is also active, and there are various applications of those concepts, and challenges that remains to be studied. But the main point of this post is that the vision that this would be used at the scale of the Web to create the Semantic Web did not happen. However, some of these technologies can be useful at a smaller scale (e.g. reasoning about books at the library).
So this is all I wanted to discuss for today. Hope this has been interesting 😉 If you want to read more, there are many other articles on this blog. and you can also follow this blog on Twitter @philfv .
— Philippe Fournier-Viger is a professor of Computer Science and also the founder of the open-source data mining software SPMF, offering more than 145 data mining algorithms.
The SPMF data mining software is a popular open-source software for discovering patterns in data and for performing other data mining tasks. Typically, to runSPMF, Java must have been installed on a computer. However, it is possible to runSPMF on a computer that does not have Java installed. For example, this can be useful to runSPMF on a Windows computer where the security policy does not allow to install Java. I will explain how to achieve this, and discuss alternative ways of running a Java program without requiring to install Java or by installing it automatically.
Method 1: Packaging the application in a .exe file with the Java Runtime Environment
This is one of of the most convenient approach. To do this, one may use a commercial software like Excelsior JET ( https://www.excelsiorjet.com/) . This software is not free but provides a 90 day full featured evaluation period. Using this software, we can choose a jar file such as spmf.jar. Then, Excelsior JET packages the Java Runtime Environment with that application in a single .exe file. Thus, a user can click on the .exe file to run the program just like any other .exe program.
To try a 32 bit version of SPMF 2.30 that has been packaged in an .exe file using JET Excelsior, you can download this file: spmf_jet.exe (2018-04-02) However, note that I have generated this file for testing purpose and will not update this file for each future release of SPMF.
While trying JET Excelsior, I made a few observations:
If we want to generate a .exe file that can be used on 32 bit computers, we should make sure to package a 32 bit version of the Java Runtime Environment in the .exe file (instead of the 64 bit JRE). This means that the 32 bit version of the Java Runtime Environment should have been installed on your computer.
Although the software does what it should do, it sometimes results in some slow down of the application. I assume that it must be because files are uncompressed from the .exe file.
Packaging the runtime environment increases the size of your application. For example, the SPMF.jar file is about 6 megabytes, while the resulting .exe file is about 15 megabytes.
Although a Java application is transformed into an .exe file, it stills uses the Java memory management model of using a Garbage Collector. Thus, the performance of the .exe should not be compared with a nativeapplication developed in language such as C/C++.
Method 2: Using a Java compiler such as GCJ
There is exists some Java compiler such as GNU GCJ (http://gcc.gnu.org/) that can compile a Java program to a native .exe file. I have previously tried to compile SPMF using GCJ. However, it failed since GCJ does not completely support SWING and AWT user interfaces, and some advanced features of Java. Thus, the graphical user interface of SPMF could not be compiled using GCJ and some other classes. In general, GCJ can be applied for compiling simple command-line Java programs.
Method 3: Using JSmooth to automatically detect the Java Runtime Environment or installl it on the host computer
An alternative called JSmooth (http://jsmooth.sourceforge.net/ ) allows to create an .exe file from a Java program. Different from Excelsior Jet, JSmooth does not package the Java Runtime Environment in a .exe file. The .exe file is instead designed to search for a Java Runtime Environment on the computer where it is run or to download it for the user. I did not try it but it seems like an interesting solution. However, if it is run on a public computer, this approach may fail as it requires to install Java on the computer, and local security policies may prevent the installation of Java.
Method 4: Installing a portable version of the Java Runtime Environment on a USB stick to run a .jar file
There exists some portable software called jPortable and jPortable Launcher (download here: https://portableapps.com/apps ) to easily install a Java Runtime Environment on a USB stick. Then the jPortable Launcher software can be used to launch a .jar file containing a Java application.
Although this option seems very convenient as it is free and does not require to install Java on a host computer, the installation of jPortable failed on my computer as it was unable to download the Java Runtime Environment. It appears that the reason is that the download URL is hard-coded in the application and that jPortable has not been updated for several months.
Conclusion
There might be other ways of running Java software on a host computer withoutinstallingJava. I have only described the ones that I have tested or considered. If you have other suggestions, please share your ideas in the comments section, below.
— Philippe Fournier-Viger is a professor of Computer Science and also the founder of the open-source data mining software SPMF, offering more than 145 data mining algorithms.
Many researchers are using Latex to write research papers instead of using Microsoft Word. I previously wrote a blog post about the reasons for using Latex to write research papers. Today, I will go in more details about Latex and talk about a nice tool for comparing two Latexfiles to see the differences. The goal is to see the changes made between two files as it would appear when comparingtwo revisions of a document using Microsoft Word. Comparingtwodocuments is very useful for researchers, for example, to highlight the changes that have been made to improve a journal paper when it is revised.
We will use the latexdiff tool. This tool can be used both on Windows and Linux/Unix. It is a Perl script. I will first explain how to use it on Windows with MikTek.
Using Latexdiff on windows with the MikTek Latex distribution
Consider that you want to compare two files called v1.tex and v2.tex.
Step 1. Open the Miktek Package Manager and install the package “latexdiff“.
As a result, latexdiff.exe will be installed in the directory \miktex\bin\ of your Miktek installation.
Step 2. From the \miktex\bin\ directory, you can now run the command using the command line interface:
latexdiff v1.tex v2.tex > out.tex
This will create a new Latex file called out.tex that highlight the differences between your twoLatex files. You can then compile out.tex using Latex. The results is illustrated below:
Note 1: If you want to use latexdiff in any directories (not just in \miktek\bin\, you should add the path to the directory \miktek\bin\ to the PATH environment variable of Windows.
Note 2 : There are a lot of things can go wrong when installing latexdiff on Windows. First, the encoding of your Latex files may cause some problems. It took me several tries before I could make it work on some Latex files because the encoding was not in UTF-8. I first had to convert my file to UTF-8. Also, for some Latex files, the output of latexdiff may not compile. Thus, I had to fix the output by hand. But there are a lot of command line parameters for latexdiff that can be used perhaps to fix these problems if you encounter them.
I will not provide further details about this because I did not install it that way.
Conclusion
In this blog post, I shown how to use a very useful tool called latexdiff for researchers who are writing their papers using Latex.
— Philippe Fournier-Viger is a professor of Computer Science and also the founder of the open-source data mining software SPMF, offering more than 145 data mining algorithms.
In this post, I will provide links to standard benchmark datasets that can be used for frequent subgraph mining. Moreover, I will provide a set of small graph datasets that can be used for debugging subgraph mining algorithms.
The format of graph datasets
A graph dataset is a text file which contains one or more graphs. A graph is defined by a few lines of text that follow the following format (used by the GSpan algorithm)
t # N This is the first line of a graph. It indicates that this is the N-th graph in the file
v M L This line defines the M-th vertex of the current graph, which has a label L
e P Q L This line defines an edge, which connects the P-th vertex with the Q-th vertex. This edge has the label L
Small datasets for debugging
Here are some small datasets that can be used for debugging frequent subgraph mining algorithms. Each dataset contains one or two graphs, which is enough for some small debugging tasks.
In this blog post, I have share some helpful datasets. If you want to know more about subgraph mining you may read my short introduction to subgraph mining.
— Philippe Fournier-Viger is a professor of Computer Science and also the founder of the open-source data mining software SPMF, offering more than 145 data mining algorithms.
In this blog post, I will briefly discuss the fact that the popular CloSpan algorithm for frequent sequential pattern mining is an incomplete algorithm. This means that in some special situations, CloSpan does not produce the expected results that it has been designed for, and in particular some patterns are missing from the final result. I will try to give a brief explanation of that problem but I will refer to another paper for the actual proof that the algorithm is incomplete. Moreover, I will briefly talk about a similar problem in the IncSpan algorithm.
What is CloSpan?
CloSpan is one of the most famous algorithm for sequential pattern mining. It is designed for discovering subsequences that appear frequently in a set of sequence. CloSpan was published in 2003 in the famous SIAM Data Mining conference:
[1] Yan, X., Han, J., & Afshar, R. (2003, May). CloSpan: Mining: Closed sequential patterns in large datasets. In Proceedings of the 2003 SIAM international conference on data mining (pp. 166-177). Society for Industrial and Applied Mathematics.
The SIAM DM conference is a top conference. And the CloSpan paper has been cited in more than 940 papers, and used by many researchers.
What is CloSpan used for?
The CloSpan algorithm takes as input a parameter called minsup and a sequence database (a set of sequences). A sequence is an ordered list of itemsets. An itemset is a set of symbols. For example, consider the following sequence database, which contains three sequences:
Here the first sequence (Sequence 1) means that a customer has bought the items bread and apple together, has then bought milk and apple together, and then has bought bread. Thus, this sequence contains three itemsets. The first itemset is bread with apple. The second itemset is milk with apple. The third itemset is bread.
In sequential pattern mining the goal is to find all subsequences that appears in at least minsup sequences of a database (all the sequential patterns). For example, consider the above database and that minsup = 2 sequences. Then, subsequence <(bread, apple),(apple)(bread)> is a sequential pattern since it appears in two sequences of the above database, which is no less than minsup. A sequential pattern mining algorithm should be able to find all subsequences that meet this criterion, that is to find all sequential patterns. Above I have given a quite informal definition with an example. If you want more details about this problem, you could read my survey paper about sequential pattern mining, which gives a more detailed overview of this problem.
The CloSpan algorithm is an algorithm to find a special type of sequential patterns called the closed sequential patterns (see the above survey for more details).
What is the problem?
In algorithmic two important aspects are often discussed when talking about some algorithms. They are whether an algorithm is correct or incorrect, and whether it is complete or incomplete. For the problem of sequential pattern mining, a complete algorithm is an algorithm that can find all the required sequential patterns, and a correct algorithm is one that will correctly calculate the number of occurrences of each pattern found (correctly calculate the support).
Now the problem with CloSpan is that it an incomplete algorithm. It applies some theoretical results (Theorem 1, Lemma 3 and Corollary 1-2 in [1]) to reduce the search space, which work well for some databases containing only sequences of itemsets containing a single item each. But in some cases where a database contains sequences of itemsets containing more than one item per itemset, the algorithm can miss some sequential patterns. In other words, the CloSpan algorithm is incomplete. In particular, in the following paper [2], it was shown that the Theorem 1, Lemma 3 and Corollary 1-2 of the original CloSpan paper are incorrect.
[2] Le, B., Duong, H., Truong, T., & Fournier-Viger, P. (2017). FCloSM, FGenSM: two efficient algorithms for mining frequent closed and generator sequences using the local pruning strategy. Knowledge and Information Systems, 53(1), 71-107.
In [2], this was shown with an example (Example 2) and it was also shown experimentally that if the original Corollary 1 of CloSpan is used, patterns can be missed. For example, on a dataset called D0.1C8.9T4.1N0.007S6I4, CloSpan can find 145,319 patterns, while other algorithms for closed sequential pattern mining can find 145,325 patterns. Thus, patterns can be missed, although not necessarily many.
I will not discussed the details about why the results are incomplete as it would requires too much explanations for a blog post. But for those interested, you can check the above paper [2] which has clearly explained the problem.
And what about other algorithms?
In this blog post, I have discussed a theoretical problem in the CloSpan algorithm such that CloSpan is incomplete in some cases. This result was presented in the paper [2]. But to ensure more visibility for this result, as CloSpan is a popular algorithm, I thought that it would be a good idea to write a blog post about this result.
By the way, this is not the only sequential pattern mining algorithm that is incorrect or incomplete. Another famous sequential pattern mining that is incorrect is IncSpan for incremental sequential pattern mining, published in the KDD 2004 conference, and cited in more than 240 papers:
[3] Cheng, H., Yan, X., & Han, J. (2004, August). IncSpan: incremental mining of sequential patterns in large database. In Proceedings of the tenth ACM SIGKDD international conference on Knowledge discovery and data mining (pp. 527-532). ACM.
After the paper about IncSpan was published, the following year, it was shown in a PAKDD paper[4] that IncSpan is incomplete (it can miss some patterns). In that same paper, a complete algorithm called IncSpan+ was proposed. This is the paper [4] that has demonstrated that IncSpan is incomplete:
Nguyen, S. N., Sun, X., & Orlowska, M. E. (2005, May). Improvements of IncSpan: Incremental mining of sequential patterns in large database. In Pacific-Asia Conference on Knowledge Discovery and Data Mining (pp. 442-451). Springer, Berlin, Heidelberg.
Conclusion
The lesson to learn from this is that it is important to check the correctness and completeness of algorithms carefully before publishing a paper. And it also highlights that errors can also be found even in papers published in the very top conferences of the field, as reviewers often do not have time to check all the details of a paper, and papers sometimes do not include a detailed proof that algorithms are correct and complete. But although I have highlighted two cases with CloSpan and IncSpan, there are not the only papers to have theoretical problems. It happens quite often, actually.
== Philippe Fournier-Viger is a full professor and the founder of the open-source data mining software SPMF, offering more than 110 data mining algorithms. If you like this blog, you can tweet about it and/or subscribe to my twitter account @philfv to get notified about new posts.