
In this blog post, I will explain a quick and easy way of visualizing the frequency distribution of items in a dataset in SPMF format for pattern mining.
To do this, we will use a new online tool that I have put on my website for visualizing the frequency distribution of words in a text file. This tool can be used for any text files. But here, I will demonstrate how it can be used for analyzing a pattern mining dataset.
Step 1: First, we will download the retail.txt dataset, which is a popular dataset used in frequent itemset mining. This dataset is available on the SPMF dataset webpage. But here is the direct link for downloading this dataset:
https://www.philippe-fournier-viger.com/spmf/datasets/retail.txt
Step 2: Then, we will open the online tool for analyzing the frequency distribution of items in a text file : https://www.philippe-fournier-viger.com/tools/draw_frequency_distribution.php
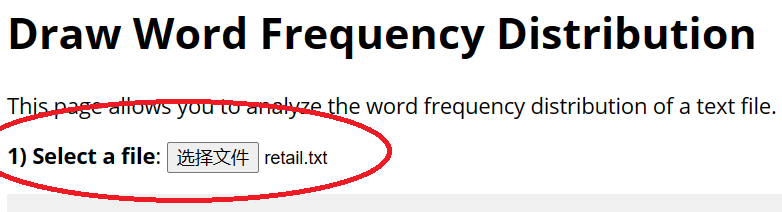
Step 3: Then, we will click here on the following button and select the retail.txt file as input:
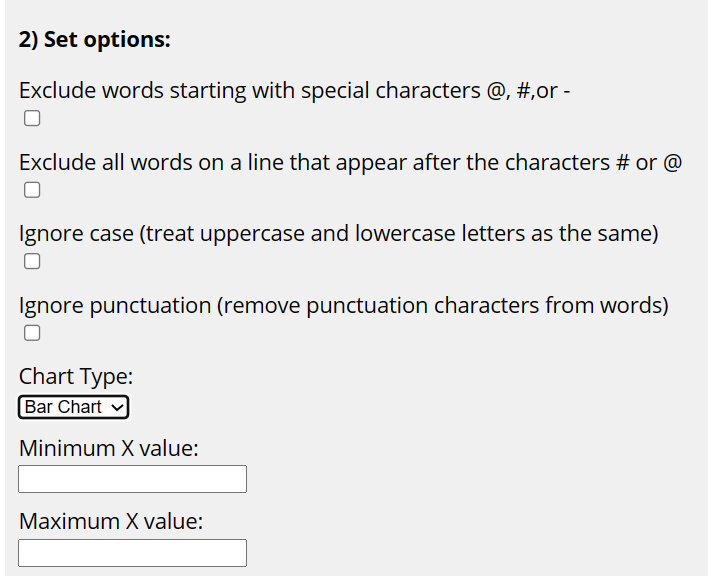
Step 4: Then, we could set various options but we will just keep the default options for now:
Step 5: Then, we will click the Draw button:
Step 6: This will display a chart showing the frequency distribution of items in this dataset. The X axis indicates different frequency (support) values, while the Y axis indicate the corresponding number of different items that have a given frequency value. The result is like this:

As we can see from this picture, many items have a low frequency (support) and very few items have a high frequency. We can also see some statistics:
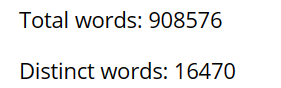
There are a total of 908576 item occurrences in the datasets (when counting duplicates), and only 16470 distinct items. And we can also see the top 20 most frequent items:

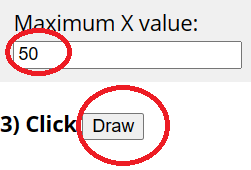
Step 7: Now, if we want to better view the results displayed in the chart, we can change the maximum value for the X axis to 50, and then click Draw again:
The results now look like this:

Step 8: After we have done this, we can also use the following buttons to export this chart as a PNG image file, or to export the data used for this chart as a CSV file, or as a Latex PGFPlots file.

For example, if I export the data from the chart to Latex, the result is this:
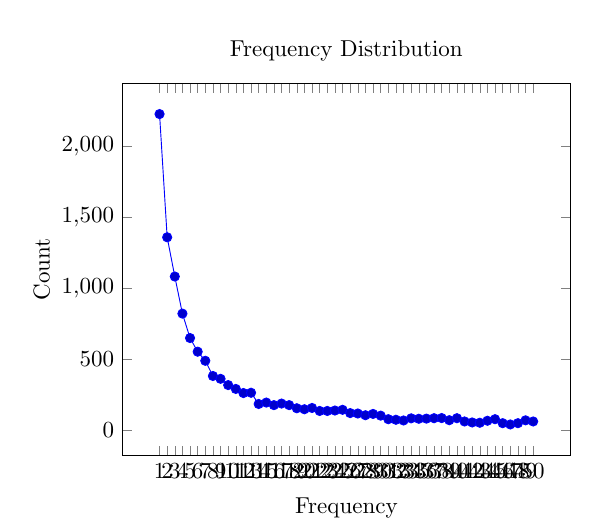
Here it does not looks so good as there is too many labels on the X axis. It would then require further tuning of the Latex code to better display the labels on the X axis, which I will not do now.
Conclusion
This was just a short blog post to show an interesting new tool for analyzing the frequency distribution of items in a dataset in SPMF format, and also more generally for words in any text files. This can be used for various types of datasets.
—
Philippe Fournier-Viger is a professor of Computer Science and also the founder of the open-source data mining software SPMF, offering more than 250 data mining algorithms.


