
Today, I will do a quick post on how to automatically adjust the minimum support threshold of frequent pattern mining algorithms such as Apriori, FPGrowth and PrefixSpan according to the size of the data.
The problem is simple. Let’s consider the Apriori algorithm. The input of this algorithm is a transaction database and a parameter called minsup that is a value in [0,1]. The output of Apriori is a set of frequent patterns. A frequent pattern is a pattern such that its support is higher or equal to minsup. The support of a pattern (also called “frequency”) is the number of transactions that contains the pattern divided by the total number of transactions in the database. A key problem for algorithms like Apriori is how to choose a minsup value to find interesting patterns. There is no really easy way to determine the best minsup threshold. Usually, it is done by trial and error. Now let’s say that you have determined that for your application the best minsup.
Now, consider that the size of your data can change over time. In this case how can you dynamically adjust the minimum support so that when you don’t have a lot of data the threshold is higher? and that when you have more data, the threshold becomes lower ?
A simple solution that I have found is to use a mathematical function for adjusting the minsup threshold automatically according to the database size (the numer of transactions for Apriori). This solution is shown below.
I choose to use the formula minsup(x) = (e^(-ax-b))+c where x is the number of transactions in the database and a,b,c are constants because it sets minsup to a high value when there is not a lot of data and then decrease minsup when there is more data. For example, on the first chart below, minsup value is set to 0.7 if there is 1 transaction, it becomes 0.4 when there is 3 transactions and then decrease to 0.2 when there is around 9 transactions. This allow the minsup threshold to become more strict when there is less data. Note that the constantsa,b and c are can be adjusted to make the curve behave differently.
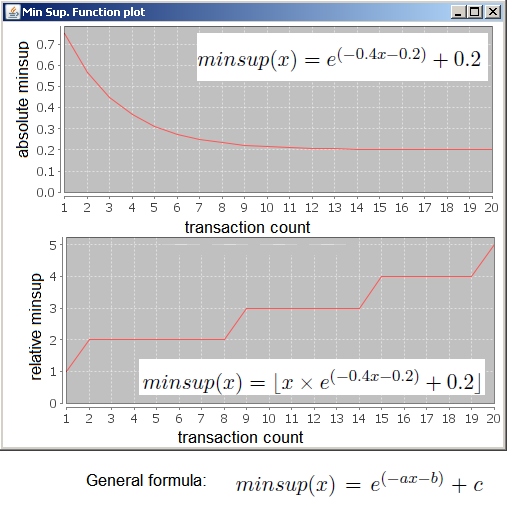
On the second chart above, I show the relative minsup threshold. It is simply the minsup threshold multiplied by the database size. It shows the number of transactions in which a pattern need to appear to become frequent according to the database size.
Hope this little trick is helpful!
Next time, I will try to talk about some more general data mining topic. I promised that I would do that last time. But today I wanted to talk about this topic, so I will rather do that next time!
Philippe
Founder of the SPMF data mining software


Hi Philippe,
I am engineering student from India. I read your blog titled “How to auto-adjust the minimum support threshold according to the data size” and had a clarification. I am new to Data mining and learning a lot about it. My question is : When the database size is more setting support threshold higher would result in less number of frequent itemsets and when the database size is less, lesser support threshold would provide more more frequent items. In this case, why minsup has to be set higher when there is less data and minsup is set to lower when data is high. Setting minsup high when data is low will result is fewer frequent items and minsup lower when data is high would provide more frequent items. why we are setting minsup lower and higher in the above scenario, actually what we are trying to reach here? I think i am not getting the whole picture here. So would you kindly help me.
Thanks,
Regards,
Surendar Natarajan
Hi,
Welcome to this blog. The reason why it may be interesting to put the support higher when the database size is very small, it is that if you don’t do that you may find frequent itemsets that may not be representative of the database. For example, if you only have two transactions, and you use minsup =50%, you will find itemsets appearing in 1 transaction, which may not be significant. An itemset that appear in only one itemset is not very interesting in my opinion. But if you have 1000 transactions and minsup = 50 %, then itemsets have to appear in 500 transactions. In this case, maaybe this is a too high requirement. If an itemset appear in maybe at least 20 transactions, it may be something interesting already. So that is what I mean by setting minsup higher for very small database and lower for very large databases. If you set minsup higher for small database, it is to ensure that itemsets are significant. If you set minsup lower for large databases, it is to ensure that enough itemsets are found.
By the way, there also exists an alternative to using minsup. It is to mine the top-k itemsets or top-k association rules. In this case you set k=1000 for example, and the algorithm will exactly generate the top 1000 itemsets or association rules. For top-k association rule mining, you can see the TopKRules algorithm
Hope this helps,
Philippe
Dear Philippe,
I read this blog and I’am sure it is useful for me to solve the problem of setting minsup dynamically. I still have one question: Is the formula minsup(x) = (e^(-ax-b))+c written in your blog refer to any publication? I tried to search it through the web site, but unfortunately i didn’t found a related papers. would you tell me where the firmula is proposed?
Thank you for your attention!
Regards,
Xiuming Yu
Dear Xiuming,
Glad to know that it is useful. This formula was first proposed in my Ph.D thesis (written in French):
Fournier-Viger, P. (2010), Un modèle hybride pour le support à l’apprentissage dans les domaines procéduraux et mal-définis. Ph.D. Thesis, University of Quebec in Montreal, Montreal, Canada, 184 pages.
In my thesis, it was applied to e-learning. Because we had relatively small datasets, we used this formula to make sure than minsup becomes higher when there is not enough data.
Best regards,
Philippe
Hi,
According to your formula, if the amount of transactions is greater than 10, it equal to 20%?
Yes, it will converge to 20 %.
By the way, to choose the three numbers in this formula, I have used a graph plotter.
how does graph plotter works?
Dear Philippe,
I read the blog, according to your equation minsup(x) = (e^(-ax-b))+c , how can we set a,b,c constant value to find minsup?
Hi sir,
how to find support value of a,b,c in graph plotter tools?
Hi,
A graph plotter is a software or website that can draw a function.
For example, you can use fooplot : fooplot.com/
Then, in the field “function”, replace
x^2
by this:
e^(-0.4x-0.2) + 0.2
Then click “Add”.
This will draw you the function mentioned in the blog post, where a = 0.4, b = 0.2 and c =0. 2.
If you want to try different values, then you can change them and draw the equations again.
How to choose the values? You can do it by trial and error. Moreover, you can observe that when x increase, the function will converge to the value “c”. So you should choose “c” as the minsup value that you want when the number of transactions is very high. The parameter “a” and “b” will determine the slope of the curve (how long it will take before it converge to the value “c”).
Hope this helps,
Philippe
Hello Sir,
I want to ask 2 questions.1.How we choose a,b,c values,why min supp is high for small databas.
Hi,
(1) I have answered above in the comment section.
(2) Because when you have less data, you may want to be more restrictive.
For example, if you have 5 sequences and minsup = 20 %, then any pattern that appears in 1 sequence is frequent, which mean that everything is frequent.
Now consider 100 sequences, if you set minsup = 20 %, a pattern needs to appear in 20 sequences to be frequent.
To avoid the problem that anything is frequent for lower minsup is the reason why I used the formula.
Philippe
how to choose different min support at different levels for fp tree
You may be interested in reading the CFPGrowth paper which describes how to mine frequent itemsets using multiple minimum supports. Perhaps that it would answer your question.
sir ,I have implemented a algorithm for frequent pattern.But My question is
what i use ,absolute support or relative support.
if i m using absolute support formula generate 0.2 for 1000 records ,2000 records min support is constant=0.2
if i use relative support ….Example for 1000 records it is 200.But support is the probability its range is[0..1].
So what i will do
I am confused.
Sir , absolute support formula generate 0.2 for 1000 records ,2000 records and more .
If you want to convert minsup from a percentage to a number of records, you can multiply the percentage by the number of records in the dataset.
For example, if you have 1000 records and minsup = 0.2. You can do 1000 x 0.2 = 200 transactions.
Similarly, if you want to convert minsup from a number of records to a percentage you can divide the number of records by the number of records in the dataset.
For example, if minsup = 200 records, 200 / 1000 = 0.2.
It is just a matter of multiplying/dividing.
sir if the number of transaction in odd number that time we get some fraction number that time how decide the minimum support because the number transaction can not be fractional in number
If a number of transactions is fractional, then the solution is to round the number up (it makes more sense to round up than round down because the minimum support is a minimum requirement).
So, if you have something like minsup = 1.3 transactions, then I would round it up to 2 transactions. Or if you have 2.7 transactions, I would round it up to 3 transactions.
You can do that using the “ceiling” (ceil) function in most programming languages.
sir i have a question please answer me
what is threshold?what are the different factors to be considered while setting threshold in finding relevance between the features or attributes in irrelavant feature removal
sir i have a question please answer me
what is threshold?what are the different factors to be considered while setting threshold in finding relevance between the features or attributes in irrelavant feature removal
explain me with an example
In this blog post, I was discussing the “minsup” threshold in frequent pattern mining. It is a parameter for the problem of mining frequent patterns.
The best value for the “minsup” threshold depends on the dataset.
The minsup threshold is independent of the features. But some researchers have redefined the problem of mining patterns with multiple minsup thresholds, thus you can set a different threshold for each feature (item).
How to set minsup for a dataset having 958 instances? how we can set a,b and c for this particular dataset?
You can use a graph plotter to see how the equation looks like and change a,b,c.
For example, you can use fooplot : fooplot.com/
Then, in the field “function”, replace
x^2
by this:
e^(-0.4x-0.2) + 0.2
Then click “Add”.
This will draw you the function mentioned in the blog post, where a = 0.4, b = 0.2 and c =0. 2.
If you want to try different values, then you can change them and draw the equations again.
How to choose the values? You can do it by trial and error. Moreover, you can observe that when x increase, the function will converge to the value “c”. So you should choose “c” as the minsup value that you want when the number of transactions is very high. The parameter “a” and “b” will determine the slope of the curve (how long it will take before it converge to the value “c”).
Sir,
I have done the equation e^(-0.4*958-0.2) + 0.2 but the result is a straight line.sir can you suggest values for a,b,c to get the correct min support for 958 instances
Hi,
You got a straight line because you have deleted the “x” variable from the equation.
You can try this: e^(-0.05x+4) + 958
It looks a little bit better. And you can adjust it for your needs
sir,
Using this equation we created a graph. Does the x value represent the min support value? It shows as 7.27 to 7.28. If it is the minsup threshold as you stated before it can not be a huge value?
Hi,
As explained in the blog post, the goal of this formula is to calculate the minimum support based on the number of transactions that you have in your database.
The parameter X is the number of transaction in your database.
The formula is a general formula minsup(x) = (e^(-ax-b))+c where a,b,c, are constants and x is the parameter.
You can adjust a,b and c to change the shape of the curve as you like. You can have huge or small value. It just depends how you set the parameters a,b,c. You need to try various values and find what you like. The best way is to use a graph plotter because it helps to visualize the math function.
I suggested e^(-0.05x+4) + 958 as an example but you can modify it the way you want.
Actually
I very much enjoyed your blog
I chose my PhD in the title is to determine the minimum optimization to improve the patterns discovered
But I am very encouraged after identifying your blog
I would be grateful to you for your cooperation with me
Best regards,
Yemen – Taiz
Hi,
Thank you. Yes it may be possible to collaborate. If you have some ideas about a possible collaboration you can always send me an e-mail and we will see from there.
Best,
hello sir,
i’m IT student from indonsia
i have read this article and i have a question :
where did you find the formula to find min sup ?
i have the same idea to set min sup according to data size,
but i must have a theory for my essay
i hope i get the answer from you, sir
thank you
regards,
Dennis Prasetia
Hi,
I wanted an exponentially decreasing function, and I tried a few different functions using a graph plotter to find this one.
If you want to cite me for using this function, you can cite my Ph.D thesis where that function for adjusting the minsup threshold was first proposed:
Fournier-Viger, P. (2010), Un modèle hybride pour le support à l’apprentissage dans les domaines procéduraux et mal-définis. Ph.D. Thesis, University of Quebec in Montreal, Montreal, Canada, 184 pages.
Best regards,
Hello sir, your threshold related information is very valuable but sir i have one problem that i am working on frequent pattern mining over data stream and i refer one accident data set which has 340,183 transaction and 572 items i have refer paper in which they given there threshold value is 20% so which value i have to select to draw a graph. please reply.
Finding the correct values for the minsup threshold really depends on your data. On some dataset, you may set minsup = 90 % of your dataset size and you will get millions of patterns, while on some other datasets, you may set minsup = 1 % of your dataset size and you will get no patterns. It depends on whether all your transactions are very similar or not. If they are similar, there will be lot of itemsets that will be frequent. If the transactions are rarely similar, then there will be few itemsets that will be frequent. So, generally, when testing an algorithm, what I will do is to start with a very high minsup values and gradually lower it down until I will get enough patterns (or the execution time is interesting for generating some charts). From an application perspective, it is not likely desirable to get millions of patterns. Probably that you may want a few hundreds or thousands depending on what you want to do. But if you are doing an experiment for a paper on proposing an algorithms, you can generate more patterns
Hi sir, thanks for this formula. I would want to ask the suggested parameters a,b,c for a database containing 21 sequences and just 4 items. I ask this because I get 3000 frecuent patterns in 5 min using PrefixSpan with support threshold 0.75, and then 15000 frecuent patterns in 40 min with support threshold 0.71, so if I decrease the support threshold (suppose 0.20) it will last hours and get maybe millions of patterns. Would it be logical that result? Would it be right if I choose 0.75? Please reply.
Setting the parameters greatly depends on your needs for your application. If you have enough patterns and you have found interesting patterns at 0.75, it could make sense to use 0.75.
When you lower the threshold, more patterns will be found. If you still want to lower the minsup threshold but think that the number of patterns is too large, a solution is to add constraints to the algorithm to reduce the number of patterns. For example, if you discover only patterns that have a length < 3 items, then there should be much less patterns found. Different types of constraints could be added to reduce the number of patterns. In my software SPMF, if you use some algorithm such as CM-SPAM, several constraints are provided such as the maximum length, the maximum gap between two items in a pattern, etc. You may try these constraints if this make sense for your application. For choosing the parameter a,b,c in that formula, you should use an equation plotter that let you draw a math formula visually. There are many websites that offer this features. Then, you may change the parameters a,b,c by yourself and see what you like. If you have decided that 0.75 is the minimum that you want, then you could set a,b,c so that the threshold is never less than 0.75. Actually, what is a good threshold value depends on your application. For some domains, 0.75 is good, and you may find thousands of patterns, while for other domains, you may set minsup = 0.1 and still get zero patterns. Setting minsup to an appropriate value is highly domain-dependent. Hope this answers your questions.
hi sir
I am an engineering student from India, your blog is really helpful to me, My Question is:
How to decide threshold value for any algorithm, More specifically how you consider a threshold value in your FHM algorithm , is it randomly taken or you consider any mathematical calculation for transactional database?
And as you say a good threshold value is depends on your application, so if I want to take this for supermarket transactional database what should be its value?
i want to take kosarak dataset for finding frequent pattern then how to get correct threshold value for that?
Please solve my confusion on how to set threshold value.
Hi,
Glad that the blog is useful. And thanks for commenting on the blog.
Generally, a good value for the threshold for a given dataset is found by trial and error. In general, the lower you set a threshold, the more patterns you will get. In the extreme case, if you set minutil = 0 for the FHM algorithm, you may get millions of patterns and the algorithm may even fail to terminate or run out of disk space if there are too many patterns. Moreover, for a user, I don’t think that it is really interesting to find hundrer of m millions of patterns. Thus, in general, you may want to set minutil to a value that is high enough to get some patterns but not too high otherwise too few patterns will be found, or even no pattern may be found at all. There is no specific mathematical formula for finding the best value for a given database. It really depends on what is the utility of items in the database. For example, if no itemset has a utility higher than 100, then setting minutil higher than 100 will return zero pattern. But for another database, it is possible that many itemsets have a utility over 10,000. Thus it depends on the data.
A possibility could be to use some heuristics for setting the minutil threshold. For example, you could calculate the average utility of single items and use this as minutil. I’m not sure if it would work well or not. It would be a heuristic that someone would have to try to see if it works.
Besides, another possibility is to use a top-k high utility itemset mining algorithm if you don’t want to set the minutil threshold. A top-k high utility itemset mining algorithm takes only one parameter named k and will return the k itemsets having the highest utility in the database. Thus, the algorithm will automatically adjust the minutil threshold for the user to get exactly k patterns. Top-k pattern mining algorithm are slower but provide the benefit of letting the user set the number of patterns to be found, which may be more intuitive. The most recent algorithm for that is TKO. The code is not in SPMF but I could provide you the code perhaps if you need it, since i’m a co-author of that paper.
Best,
Philippe
thanks, for reply…..
yes, i m glad if you provide the source code of TKO.
I also want to ask u that, can we set the relative threshold value, rather than absolute threshold,
so if we take 30% threshold value, then if db has 100 transaction or 100000 transaction it will work fine with both of this.
thanks…
Hi,
For the source code of TKO, you should contact the main author of that paper which is Cheng-Wei Wu, and ask him about it.
Yes, in general it is easy to convert from relative to absolute value or relative to absolute value. So if an algorithm uses an absolute threshold, it should be easy to convert it for using a relative threshold.
Best regards,
Hi professor,
Thanks for your blog, and it is very helpful. Would you please recommend some papers which can support the trial and error strategy? The reviewer of my paper asks me to propose a method to optimize minimum support. However, like what you have said, it is depends on different data and different demands of users, so I want to find some paper to support this trial and error way.
Best regards
Hi,
You are welcome. Thanks for reading the blog!
You could say that as many pattern mining algorithms, you assume that the optimal parameters are found empirically by the user, and that designing some approach to automatically select the parameters could be done in future work, as it has been done with other algorithms.
For example, if you want some article that mention the trial and error approach but also propose a solution to this problem, you could mention a top-k pattern mining algorithm paper such as :
http://www.philippe-fournier-viger.com/spmf/TopSeqRules_sequential_rules_2.pdf
“In practice, to find appropriate values for these parameters, people generally successively try different values by guessing and
executing the algorithms over and over until being satisfied by the results, which can be very time-consuming. However, in data mining, users are often only interested in
discovering the “top” patterns in a database because they have limited resources for
analyzing patterns that are found [13-16]. In this paper, we address this issue for the
task of mining sequential rules in sequence databases. We propose TopSeqRules, an
algorithm for mining only the top-k sequential rules, where k is a parameter set by the
user..”
In that paper, I criticize the trial and error approach and propose a top-k algorithm to avoid setting some parameters manually.
If you don’t want to cite a paper that criticize the trial and error approach, you may be able to find some other papers that just mention the trial and error approach without criticizing it. But I currently don’t remember any (it would require to search a little bit).
Best,
Philippe
Hi Professor,
Thank you for your suggestion, and I think it is a good way to reply the reviewer. Furthermore, according to my experiences, the top-k way also needs trail and error, because in most time, the user actually don’t know how many FPs is actually enough for him/her, and sometimes many itemsets in the most k frequent itemsets are useless such as {banana yellow}, which is a common sense, so it is actually a difficult task in FP mining. Hope it will be solved in the future.
Best regards,
Zhongjie Zhang
Hi,
I am unable to determine the process of finding the values of a,b and c? I used Fooplotter but failed to find the same values. If there are 500 transactions, how it will execute and what are the possible values of a,b and c and what is minimum support threshold for 500 transactions? Can you explain by using above mentioned example. Eagerly waiting for your response….
hello sir its such nice blog you have created learn a lot after reading it and check comments. can you please tell me
1)how to differentiate between absolute and relative support with example .?
2) what is upper bound and lower bound as you mentioned in your paper but i did not understand it in better way?
3) how you calculate external utility as you called it profit of item how to give its value is there any proper method for it ?
thank you
Hi Professor,
Thanks for your blog, and it is very helpful, I wanted to know how to look for the values a,b,c values. I have done a trial and error to get a,b and c values for minsup. How can we adjust the a,b,c value when data is small or high. I tried to plot using fooplot.com and the graph never changes. Can you please answer.
Dear Dr. Philippe Fournier-Viger:
Thank you for all your great and important contributions to the research community.
I wonder if you have pythan implementation of the AR mining of the FPGrowth algorithm? We would like to extend it to take into account the Temporal aspect of our data (see, for example: Nguyen D, Luo W, Phung D, Venkatesh S. LTARM: A novel temporal association rule mining method to understand toxicities in a routine cancer treatment. Knowledge-Based Systems. 2018 Dec 1;161:313-28.
Looking forward to hearing from you.
With best regards,
N. Adam
Good afternoon,
Thanks for your nice comments. 🙂
I only have Java code, which is made available in my SPMF software.
Best regards,
Pingback: What is a maximal itemset? | The Data Mining Blog