
In this blog post, I will discuss my current trip to the ADMA 2014 conference (10th Intern. Conf. on Advanced Data Mining and Applications in China (December 19-21 2014 in Guilin, China). Note that the views expressed in this post are my personal opinion/interpretation about what I have attended at this conference.

Overal impression
There was many interesting paper presentations this year. The conference had a day of workshop and two days of regular conference papers. Overall, the conference was very enjoyable since it is focused on data mining. The location of the conference was also very good in Guilin, reportedly one of the most beautiful place in China.
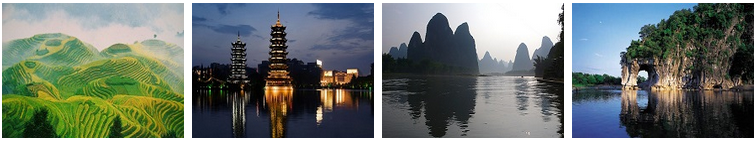
Guilin, China (pictures obtained on ADMA website)
Impact of the ADMA conference
ADMA is one of the top data mining conferences in Asia. It is certainly not as popular as PAKDD. But it was said at the opening ceremony that in terms of impact (measured by average citations / paper), ADMA had more impact than PAKDD during the last maybe 5 or 10 years, which is surprising but also great for this conference. It was suggested that one of the reason for this high impact may be that ADMA also accepts applied data mining papers (hence the name ADMA: Advanced Data Mining and Applications), while these papers may be less welcome in some other data mining conferences.
Keynote speech by Osmar Zaiane about Big Data (slides)
There was a very interesting keynote speech given by O. Z. at the conference about big data. I will try to report here the main ideas.
First, O.Z. said that he don’t really like the word “big data” (he prefers Rich Data). By looking at Google Trends, he has shown that the term “big data” may just be a convenient replacement term for “data mining“. In Google Trends, we can see that as the interest in “data mining” decreases, the interest in “big data” increases. It is suggested that one of the reason why the term “data mining” has lost some interest is that it is because of the bad reputation of data mining in the media following the events of 9/11. OZ also compared big data with other terms such as “business intelligence”, saying that unlike “big data”, the term of “business intelligence never really took off but it could have.
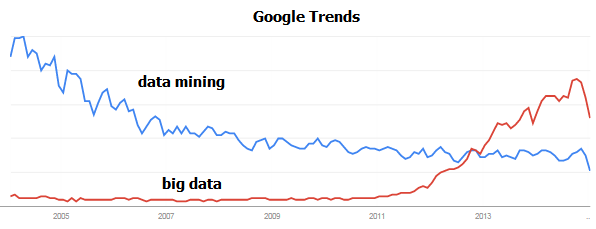
Google trends: big data vs data mining
Several statistics were shown that indicates that there is currently a huge hype around big data. The market was evaluated at more than 14 billion $ USD in 2014 and most of the top companies in US are convinced now that they MUST use big data to stay competitive according to some surveys. There is therefore a very huge HYPE around big data. It seems that everybody wants to do big data but maybe it is not always for a good reason or not everybody know why it is appropriate or not.
This hype can be compared with the huge hype that occurred around artificial intelligence in the 1970 and end of 1980. Following this hype, there was the AI WINTERS during which people lost interest in AI because there were just too many expectations built on the hype and these expectations could not be met. It was said that a kind of AI winter could happen in the near future for big data because of this huge hype currently happening. And I have to say that I agree about this.
The hype cycle of research and technology is known as the Gartner Hype Cycle. During the AI winters, although a lot of people lost interest in AI, there was always a core group of believer who continued to work on AI despite having less funding. These people have kept AI research alive during this winter. About this observation, my opinion is that it is important to not just jump on the big data trend and forget other important topics of data mining just because of the hype on big data. We certainly have not solved all the problems about “small data” yet.
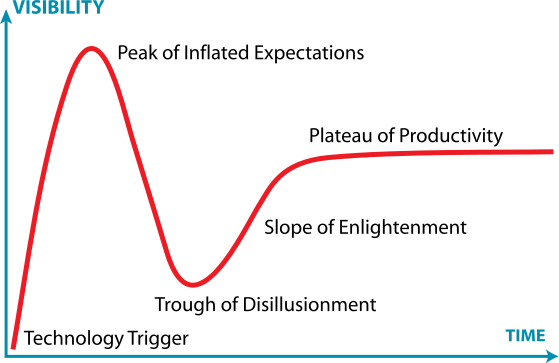
Gartner Hype Cycle
Another interesting point in this talk is a metaphore about an Elephant and blind peoples based on an old story from China/India. Imagine that several blind peoples are in a room and touching an elephant. Different people may touch different parts of the elephant and have different conclusions about what it is. But none of them can see the global picture. Companies may currently not see the big picture about big data and just jump on the hype because other companies say that it is important. For example, too many people focus on the size of data to define what is big data, while there is many other important characteristics of big data that should not be overlooked
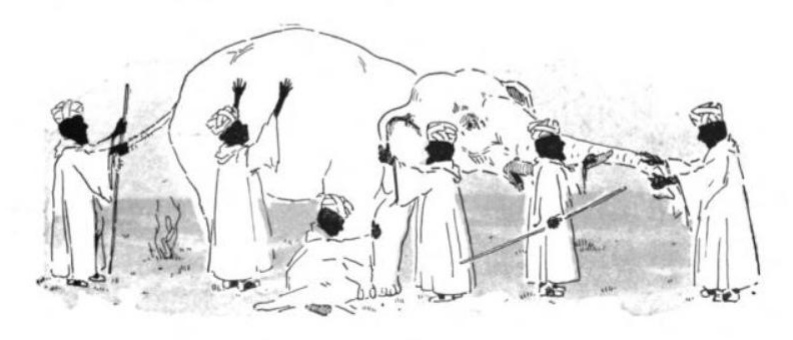
Elephant and blind men (wikipedia)
Some important characteristics of big data are that (1) the data is complex, that (2) we need to solve complex problems requiring machine learning, (3) that we need to integrate various data sources of data that may be heterogeneous and conflictual, (4) that the data may have high velocity, that is coming at high speed (e.g. stream) and that we may need to react very quickly to this data to take decisions, (5) that we may need to assess the reliability of the data, etc.
A challenge is also that data does not provide meaning. Even if we have huge amount of data, it does not mean that we can understand the meaning behind it. So we should always consider the context of the data (metadata) to interpret it properly. An interesting story to illustrate this point is the following. Consider an alien that is coming to earth and that observe humans. The alien may conclude that humans have on average one breast and one testicle. However, this is completely missing the point that there are two genders (male/female). Thus, data as said above does not provide meaning. It is necessary to use critical thinking and context to understand data and perform data analytics.
Another very interesting example to illustrate this point is the “Francis Anscombe Quartet“. It is a set of four datasets proposed by Francis Anscombe. These datasets have exactly the same main statistical properties (mean of x = 9, variance = 11, mean of y = 7.5, correlation = 0.816 and same linear regression line. However, these datasets are VERY different if we visualize them in a two dimensional space because of outliers (see picture below). Thus, this example shows that we also need to work on visualization techniques to better understand the data and not just focus on statistical properties that may be misleading.
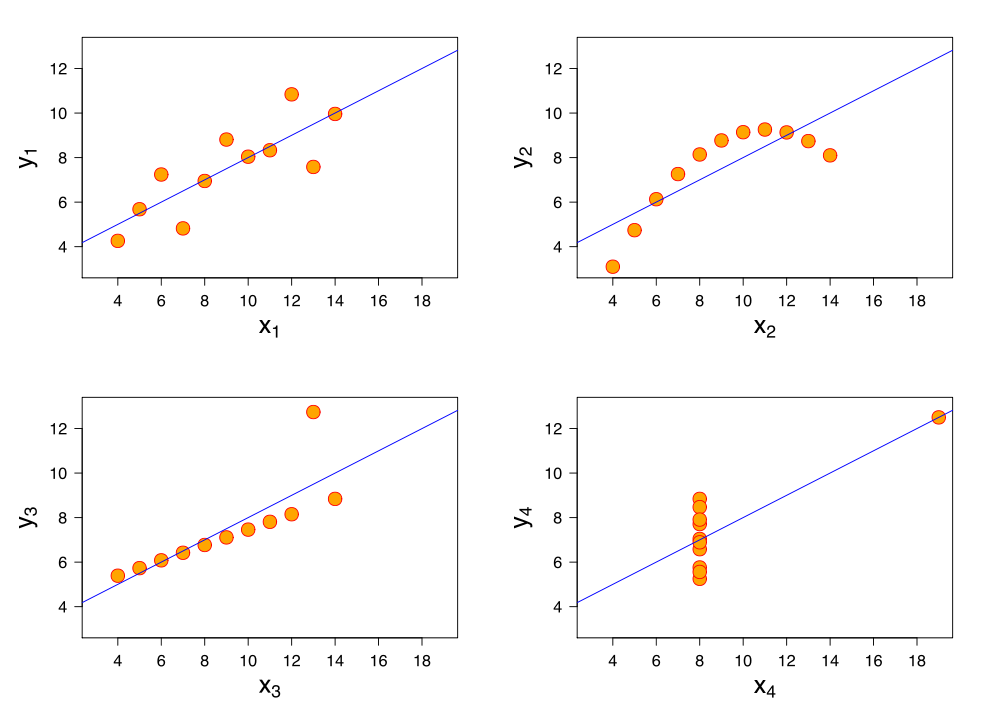
Francis Anscombe quartet
Another important challenge about big data is “data integration“. An interesting story about this is the story of NetFlix. As most of you probably know, there is a big company for movies renting in the USA that is named NetFlix. This company uses a recommender system to recommend movies to users. A few years ago, NetFlix launched a contest for researchers. The goal was to beat their recommender system by 10 % more accuracy to win 1 million $. However, there was a constraint that participants had to use the provided dataset but could not use any external source of data. The result is that solutions where very complex and have never been used into practice by Netflix, although some of them achieved the 10% improvement. The lesson from this story is that it would have been probably much easier to solve this problem by using external sources of information such as the IMDB movies database and this could have provided more simple solutions. We should thus not be afraid to use different source of data and perform data integration. Moreover there are several research challenges with respect to data integration such as how to deal with conflictual information from various sources of data, etc.
Another challenge related to big data is uncertainty. Consider a person that has an online profile that gives away his age and gender. This kind of information are facts. There is no uncertainty. However, consider that this same person buy some swimming watches. A data mining system could infer that this person is most likely a swimmer. However, it is possible that the person bought the swimming watch as a gift. Thus, in this kind of situations, we should also consider the uncertainty in data to perform data analysis.
There was also a discussion about some pitfalls of big data. It is said that we should train more and more data scientists and also that we should train carefully the manager about what to expect from big data so that appropriate tasks are given to data scientists and that expectations are reasonable.
Another pitfall is that it is tempting to try to find a single solution that could be applied to everything. Currently, in big data, many people think that we need to use Map Reduce to do big data or some very trendy technologies such as deep learning. However, it is very difficult to apply Map Reduce to some particular tasks. Thus, we should not just focus on one technology as a solution to every problems. An interesting analogy is that someone tries to use a screwdriver to fix everything, and even use a screwdriver as a key to start his car. It may works but it is not the most appropriate tool. Actually, we should build some more simple tools that could guide the user to do data analytics without having to learn a lot of complex technologies. It should be as simple as pushing a button. Currently, we can drive a car without understanding everything about how the car works. So why it should not be the same about data analytics? This will certainly require a lot of work, especially on data vizualization.
In conclusion, yes there is a lot of hype about big data. But there is also a real need because currently there is more and more data, and we need to use this data to make decisions.
Keynote speech by Hui Xiong about Big Data and Mobile Recommender System (slides)
A great keynote speak was also given by Hui Xiong. I will try to report some ideas that I have found interesting in this keynote.
It was emphasized that key aspects of Big Data is timely observation, timely analysis and timely solution. What this means is that sometimes we have huge amount of data but we need to make some observation quickly and analyze it very quickly because of time constraints (for example, the user does not want to wait a month to get the result!).
An interesting story about big data is that we can compare it to fishing in a big river. When a human is fishing in a very small river, it is relatively easy to see the fishes since the water is clear, and it is also easy to catch the fishes. However, if we consider a larger river such as the Yangtze river in China, we cannot see the fish anymore and we don’t know what fish to catch. This is the situation of big data.
How to handle big data? It was said that some key points about handling big data are the following. First, we should understand the data characteristics. Second, we should carefully select the features and attributes that are relevant for the analysis that we want to perform. We may have a PB of data. But maybe that just a small part of it is relevant. Third, we should also carefully select the instances in the data to be used for performing the analysis.
Also, it is important to understand business goals to find good research problems. It was reported that H.X. only works with real data for research such as Taxi data or travel data.
Now, for mobile recommender system, there are several challenges. First, the time and cost constraints are important. For example, for a travel recommender system, how much time the user has for travelling? how much can he pay for a travel package? Another challenge is that unlike typical recommender systems such as Collaborative Filtering, in mobile environments, we often need to consider the time dimension or sequence of events. An example that was given to illustrate this point is the work of H.X. about taxi path recommendation (KDD 2009). The goal of this paper was to recommend sequences of locations to the user rather than performing a single recommendation. Other challenges are that data is not uniformly distributed and that data may be heterogeneous.
There was many other points in this talk. But those are the key points that I have noted.
Next year conference
In the opening ceremony of the conference, it was announced that the ADMA 2015 conference will be held in Shanghai, and ADMA 2016 will be held in Macau the year after (2016)
Best paper awards
Three best paper awards were given at this conference. Two of them are:
- Fournier-Viger, P., Wu, C.W., Tseng, V.S. (2014). Novel Concise Representations of High Utility Itemsets using Generator Patterns. Proc. 10th International Conference on Advanced Data Mining and Applications (ADMA 2014), Springer LNCS 8933, pp. 30-43.
(this is my paper! – I’m very happy about that)
- Strecht, P., Mendes-Moreira, J., Soares, C. (2014). Merging Decision Trees: A Case Study in Predicting Student Performance. Proc. 10th International Conference on Advanced Data Mining and Applications (ADMA 2014), Springer LNCS 8933, pp. 30-43.
And I don’t remember the third one. Besides, a 10th year most influential paper should be announced soon on the website of the conference because the winner was unable to attend the conference.
==
Philippe Fournier-Viger is an assistant professor in Computer Science and also the founder of the open-source data mining software SPMF, offering more than 80 data mining algorithms.
If you like this blog, you can tweet about it and/or subscribe to my twitter account@philfv to get notified about new posts.


Dear Prof. Philippe,
Glad to see you continue writing blog; reading your posts becomes one of my hobbies. Thank you very much for your report; it is very interesting and informative. It can be seen that big data is really a hot topic recently; there are, however, many other interesting and challenging research directions. I am now working on graph mining and hope to learn from you on this problem.
A big congratulation to your best paper award and wish you and your beloved ones a happy and successful New Year.
Best,
Dang Nguyen
Hi,
Thanks for keep reading and commenting the blog. I have been a little bit inactive on the blog lately because I had too many things to do but I think I will update it a little bit more often in the next months.
Graph mining looks great. I’m also doing a little bit research on this topic with one of my student. We are working on some topic related to “relational classifiers” (how to classify a node in a graph based on its relationship to other nodes, applied to social networks).
I also wish you a happy new year. May it bring hapiness, health, and success in your research!
Best,
Philippe
Dear Prof. Philippe,
I am really enjoy reading your blog where I can learn a lot of valuable experiences from an expert like you. I am looking forward to your next post.
Currently, I am working on the topic of applying parallel computing to frequent subgraph mining. I surveyed several recent papers and found that some authors focus on GPU and Map/Reduce. I think there is still room for the improvement.
I also wish you be more successful with your research.
With all best regards,
Dang Nguyen
Hi,
Thanks.
Subgraph mining seems like a great topic. In my opinion, there are certainly many things to be done on this topic! I’m sure that you will find some nice things to do on that topic.
Best,
Philippe
Pingback: Report about the 13th ADMA conference (ADMA 2018) | The Data Mining Blog
Pingback: Brief report about ADMA 2021 | The Data Mining Blog