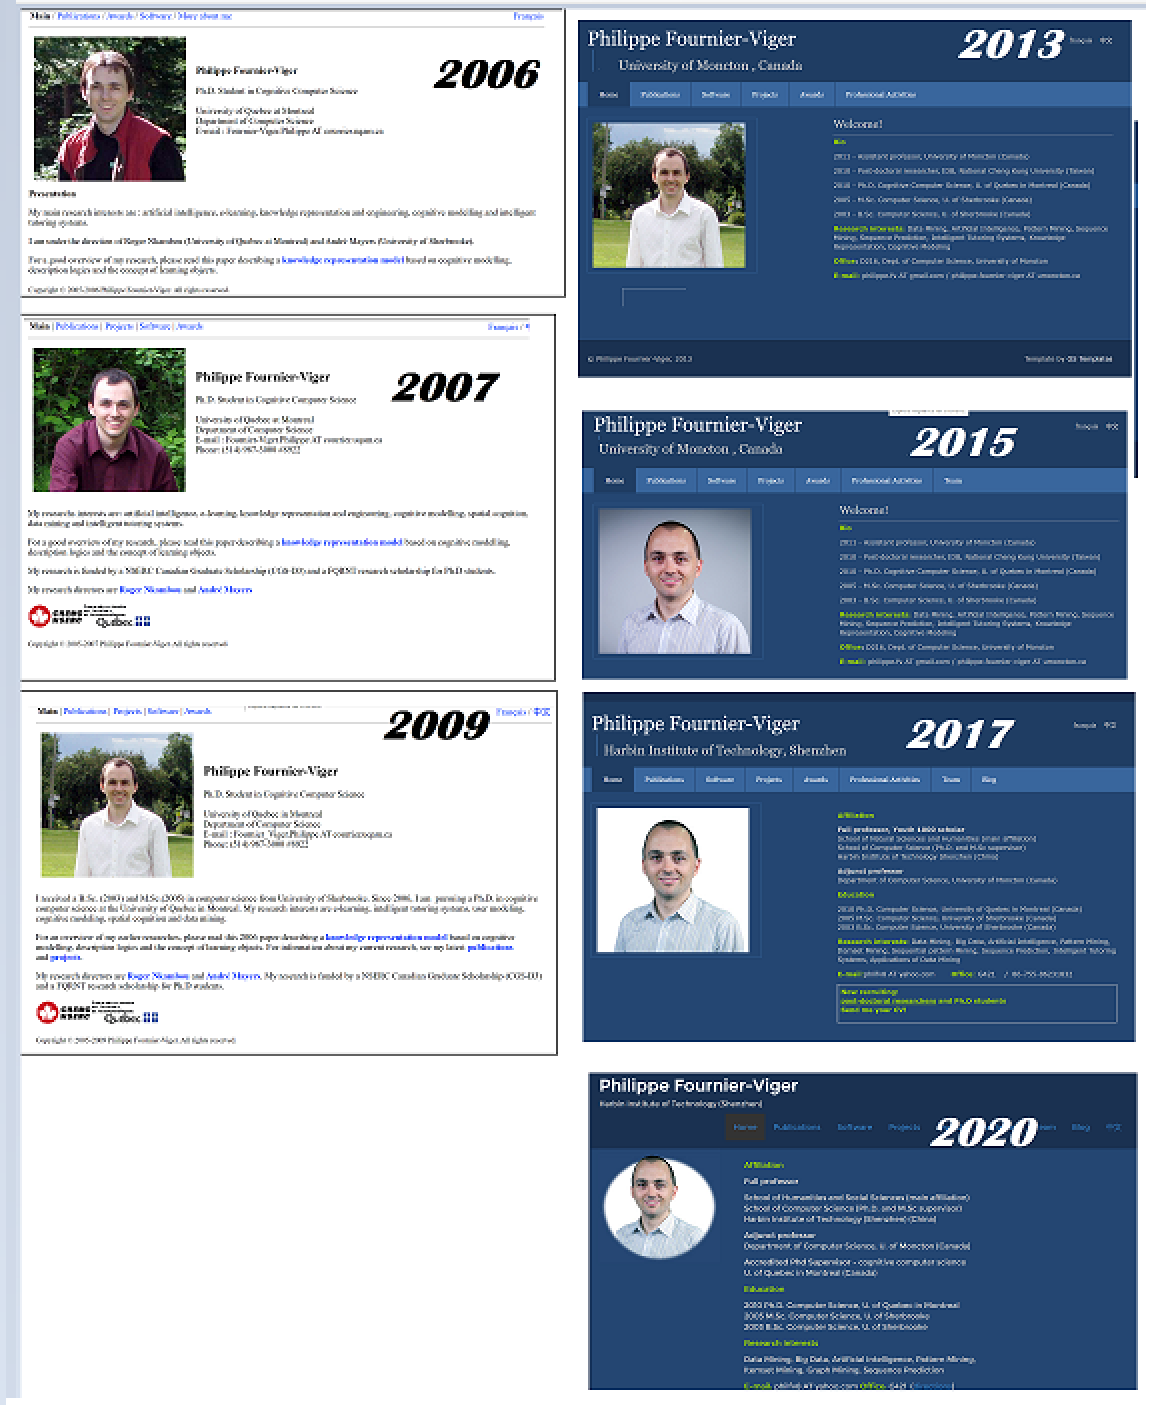
Today, I will talk about the design of my personal research webpage, which has evolved over the years from 2006 (the first year of my PhD) til today (2021). It is around 2006 that I decided to buy a .com domain name to make a webpage. My goal at that time was to have a Web presence so that people could easily find the PDFs of my research papers and also read about my research. The design of my webpage did not change so much over the years, as you can see below:
On the top left, it is the first version of my webpage, with a white background. That webpage was HTML 4 compliant and had a few subsections like “Main”, “Publications”, “Software” and “About me”. From 2006 to 2009, I made minor changes to the website, mainly to update my list of papers, change my picture (a few times) and add some other information. Then, around 2012, a student from Algeria, Hanane Amirat, gently offered to redesign my website, with a colored background as can be seen on the top right, which made it look better. At that time, I was also starting to work as professor and added more sections to my website, including a link to this blog. Then, around 2020, I redesigned the website again to make the site suitable for mobile devices, as search engines started to take this into account. This version can be seen at the bottom left. That version from 2020 looks almost the same as the 2017 version but under the hood, I have modified the website to use a responsive design template so that the menu can be dynamically resized on mobile devices.
Do you like the latest version of the website? If not, or if you have some suggestions to improve it, please leave a comment below 🙂 Maybe it is time to change the design again 🙂 In fact, I feel that the website colors are a little bit dark. Maybe it would be time to change to another design…
That is all I wanted to share today. If you are a researcher and do not have a website yet, I recommend to make one , or at least to have a page on websites such as ResearchGate and LinkedIn. This will bring more visibility to your research work!
— Philippe Fournier-Viger is a distinguished professor working in China and founder of the SPMFopen source data mining software.
There are two post-doc positions that are now OPEN in my research team in Shenzhen, China.
=== Topic ===
data mining or ML algorithms for processing graphs, sequences, streams or other complex data, pattern mining
=== Benefits =====
Very good salary
work in an excellent research team and top university
2 years contract
=== Requirements ===
have published papers in good journals or conferences during your Ph.D. as main author (papers in unknown journals from unknown or predatory publishers does not count)
be less than 35 years old (requirement of the university – I have no control over this)
be very motivated, and able to produce high quality papers
if you are not in China already, you must be in a country where a visa can be obtained for China === How to apply? ===
Send me an e-mail with your CV to philfv AT szu.edu.cn. Make sure that your CV includes your age and the list of your publications.
Tell me when you would be ready to start, and other relevant information
If you know someone who might be interested, please share! Thanks!
In this blog post, I will talk briefly about the ECML PKDD 2021 conference that I have attended virtually this week, from the 13th to the 17th of September 2021..
What is ECML PKDD?
ECML PKDD is an european conference about machine learning and data mining. This is year is the 24th edition of that conference. PKDD is viewed as a quite good conference in the field of data mining.
It is not the first time that I attend PKDD. I previously wrote some report about ECML PKDD2020 .
The PKDD 2021 program
Researchers could submit their research papers to two main tracks : the research track and the applied data science track. For these two tracks, 685 and 220 submissions were received, and 146 (21%) and 64 (29%) of the papers were accepted, respectively. Thus, it is slightly easier to get accepted in the applied data science track.
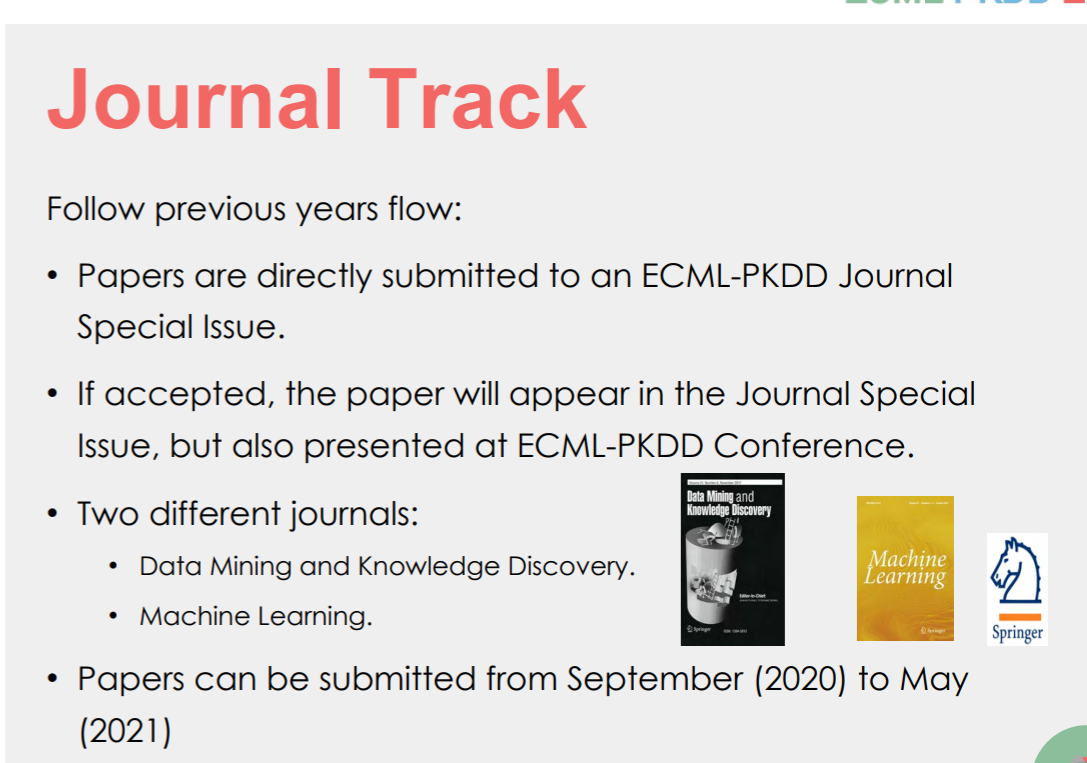
Besides these two tracks, 40 papers were accepted as part of a journal track. The journal track is something special that not all conferences have. How it works? Someone can submit a paper to either the Machine Learning journal or the Data Mining and Knowledge Discovery journal and be accepted at the same time for presenting the work at the PKDD conference.
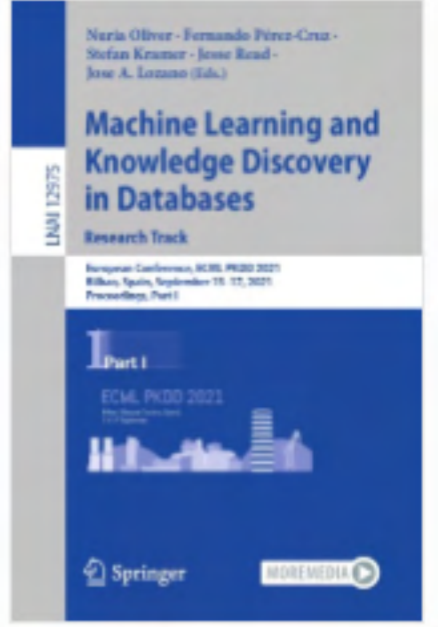
The PKDD proceedings of regular papers is published by Springer in the LNCS series:
For the workshops, there was no official proceedings. Thus, several workshop organizers (including the MLiSE workshop that I co-organize), have teamed-up to organize a separate workshop proceedings that will appear after the conference, and will be published by Springer. Other workshops may have chosen to publish their proceedings in other ways.
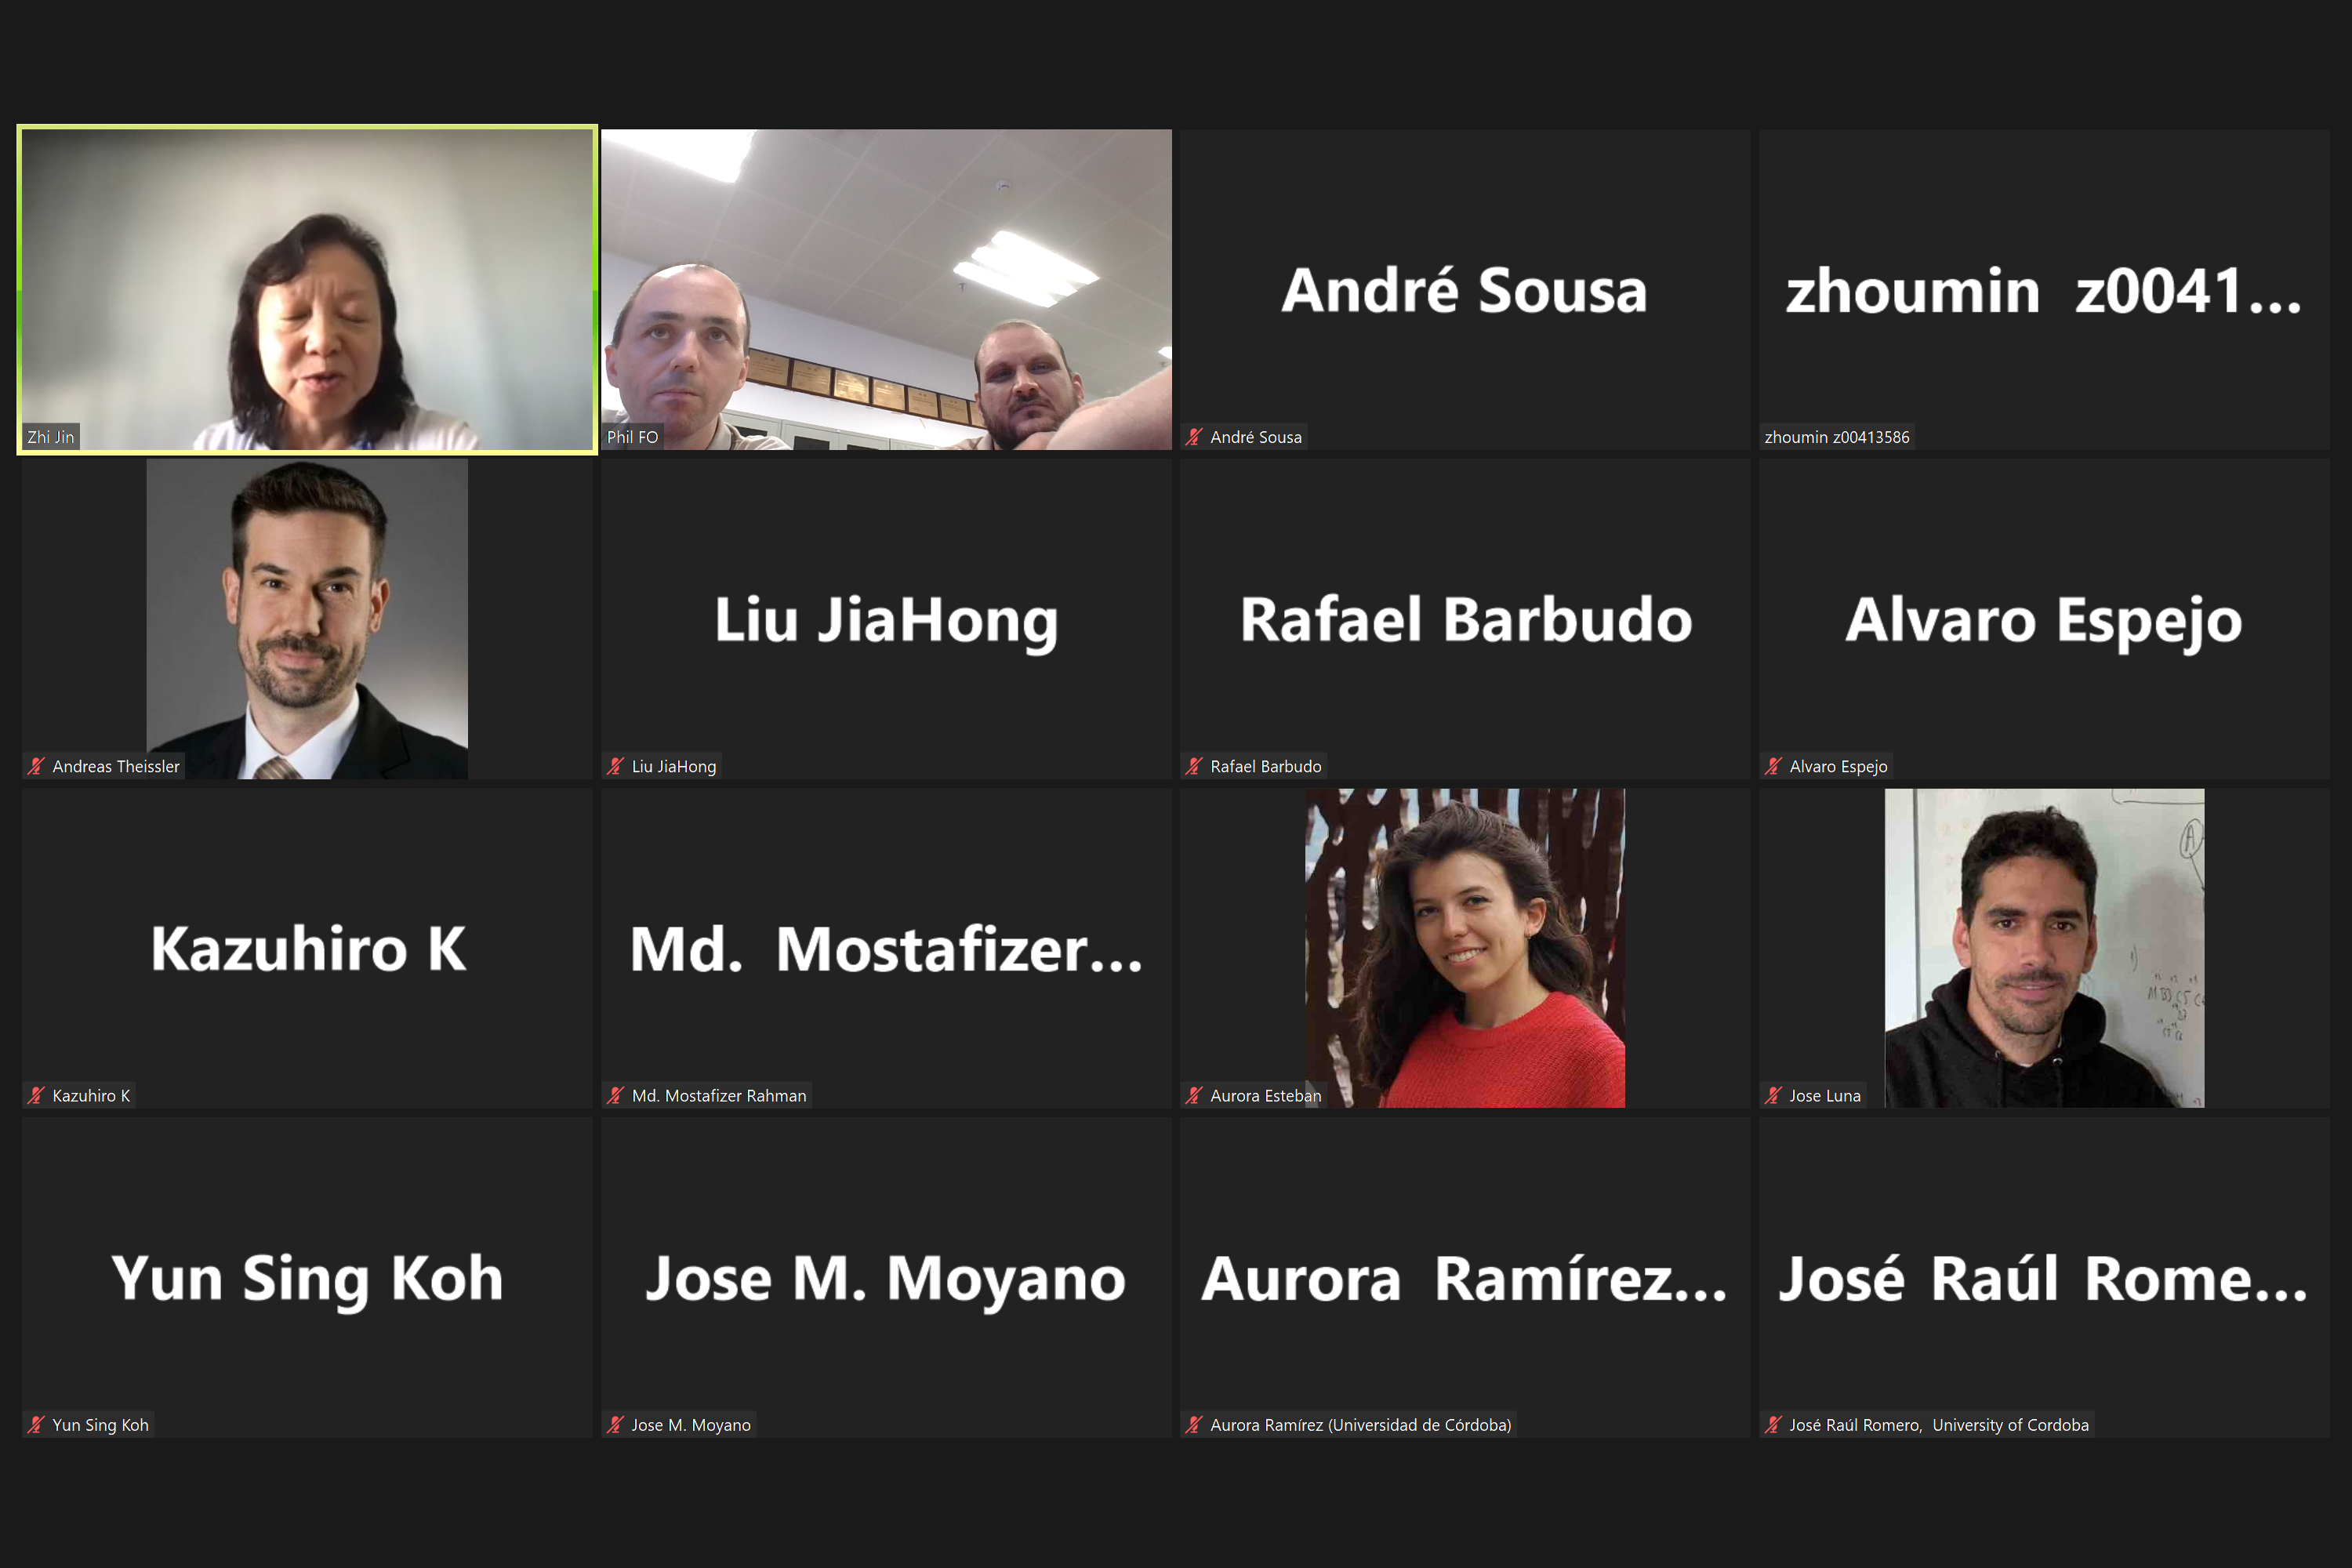
An online conference
Due to the coronavirus pandemic, the conference was held online using a conference system called Whova. The website/app is quite convenient to use. It allows to see the schedule of the conference and recorded videos of the talk could be watched at a later moment. There is also some function to search for attendees based on location and similar interests, which is interesting. It allowed me to find some other researchers in my city.
Opening ceremony
The opening ceremony gave more details about the conference.
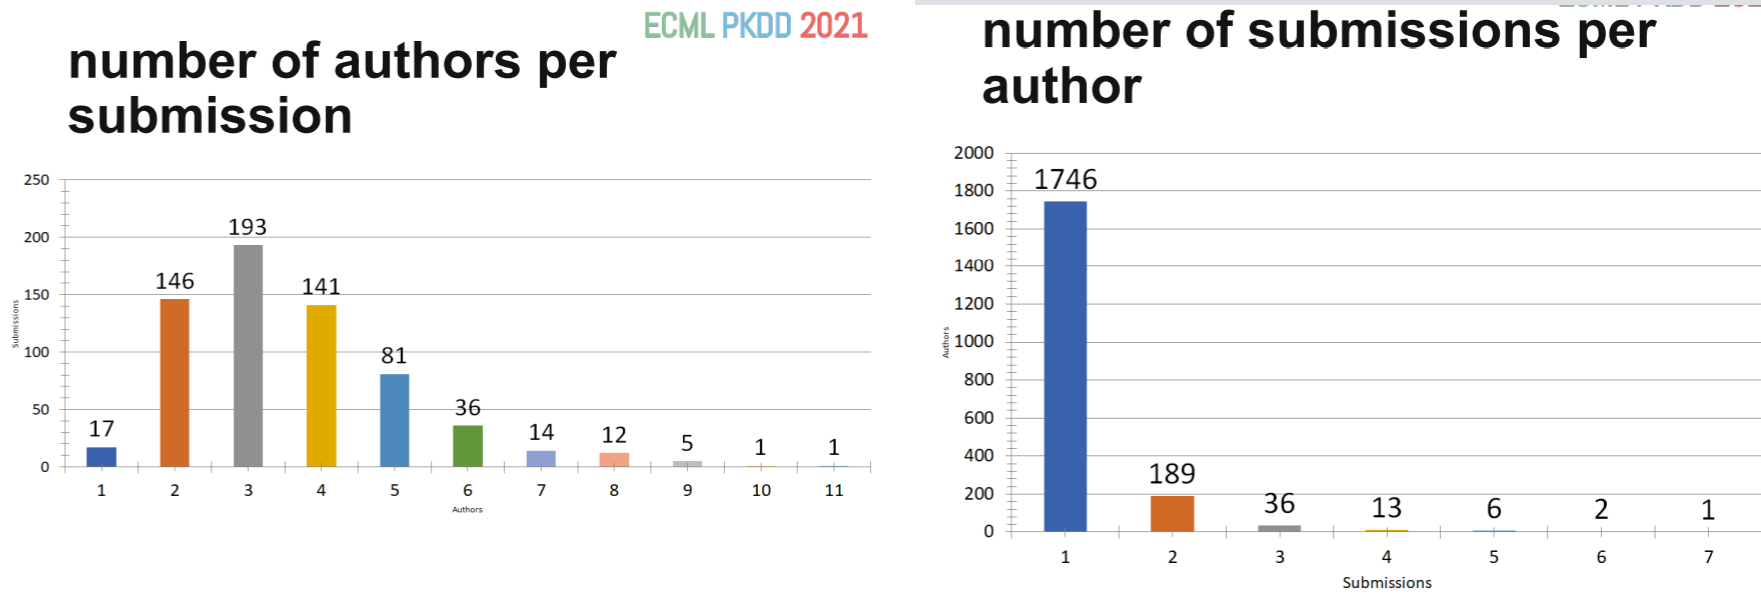
For the research track, it was said that this year, there was 384 program committee members to select papers, and 68 area chairs. On average, most papers had 3 reviews or more, with some having up to 5 reviews.
Some stats about the Research track:
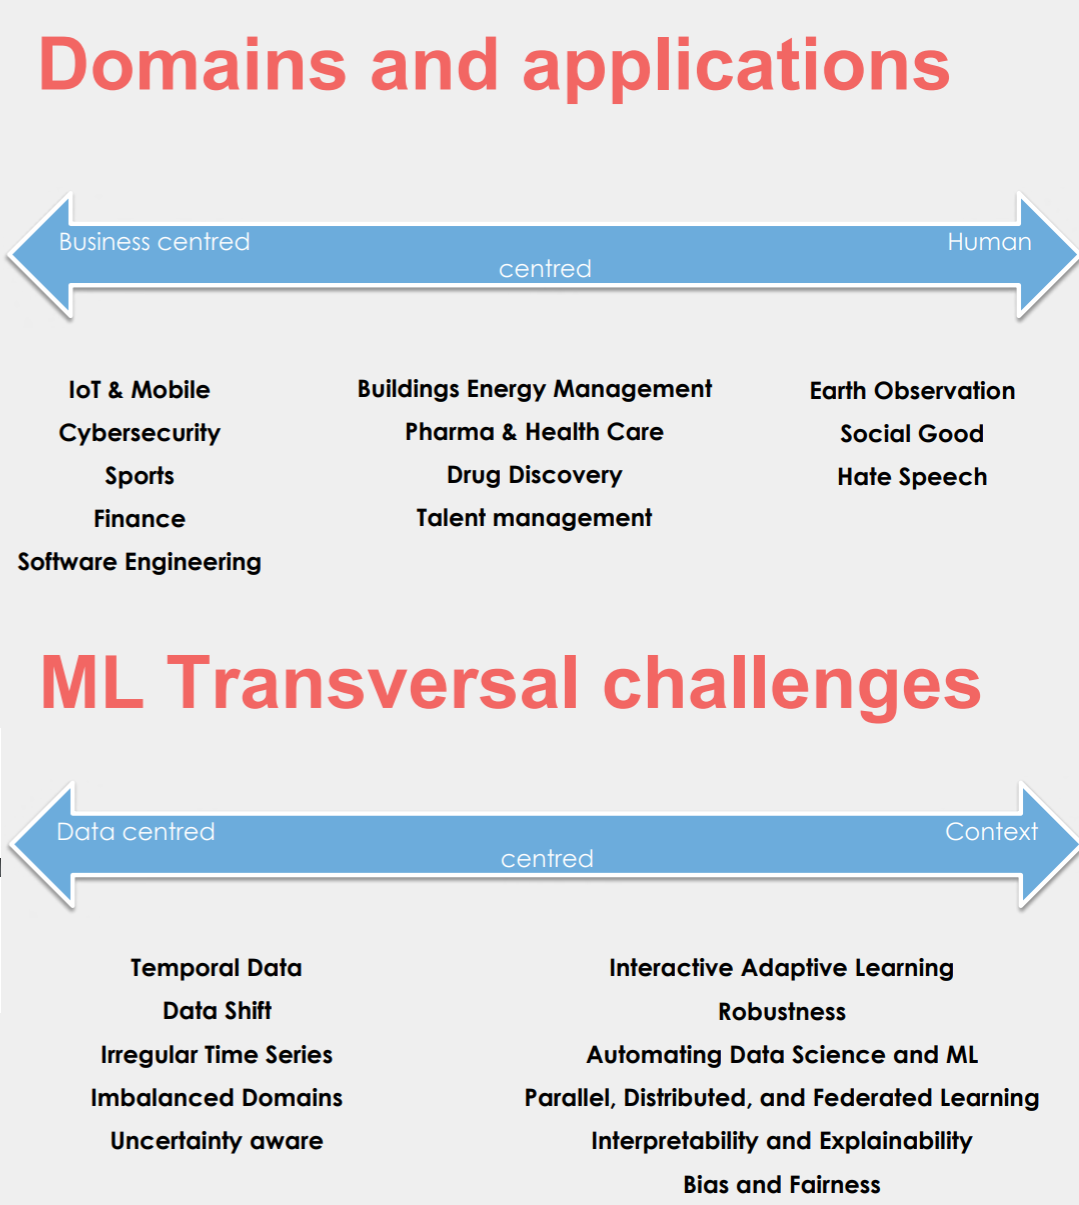
The most popular keywords of the research track:
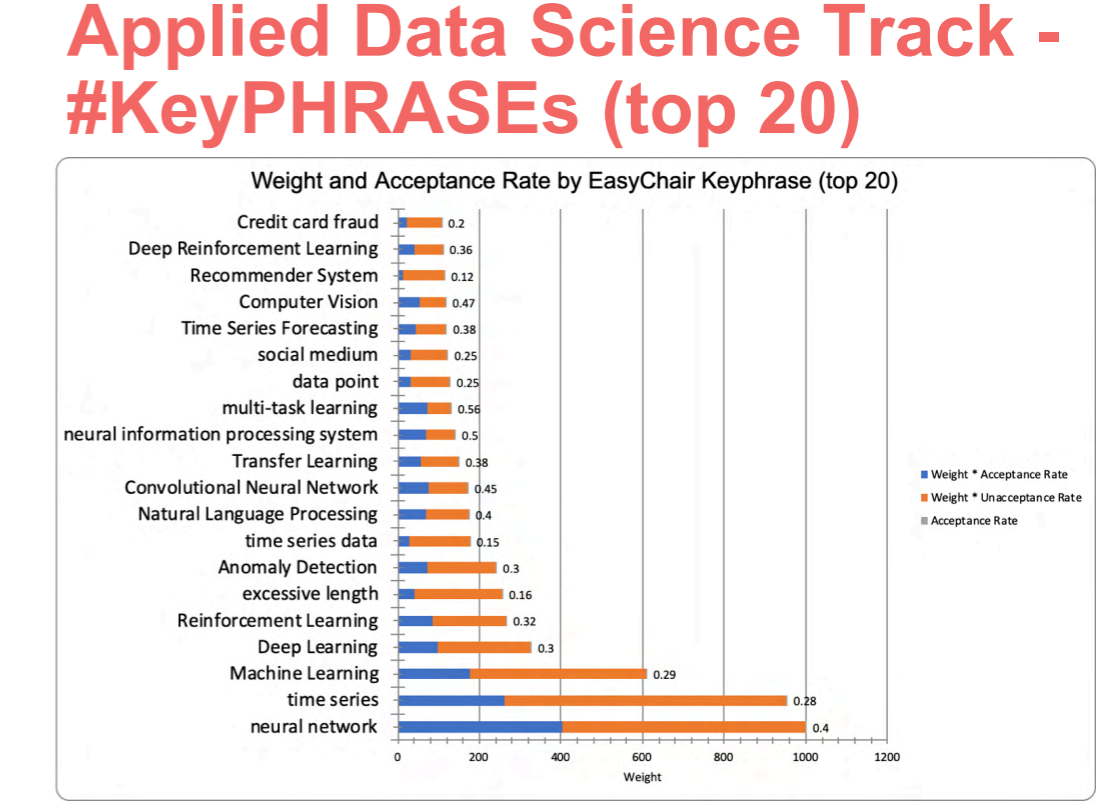
For the Applied data science track, there was 233 program committee members and each paper was reviewed by 3 to 5 reviewers. The key phrases from the applied data science track are:
Some other stats from the applied data science track:
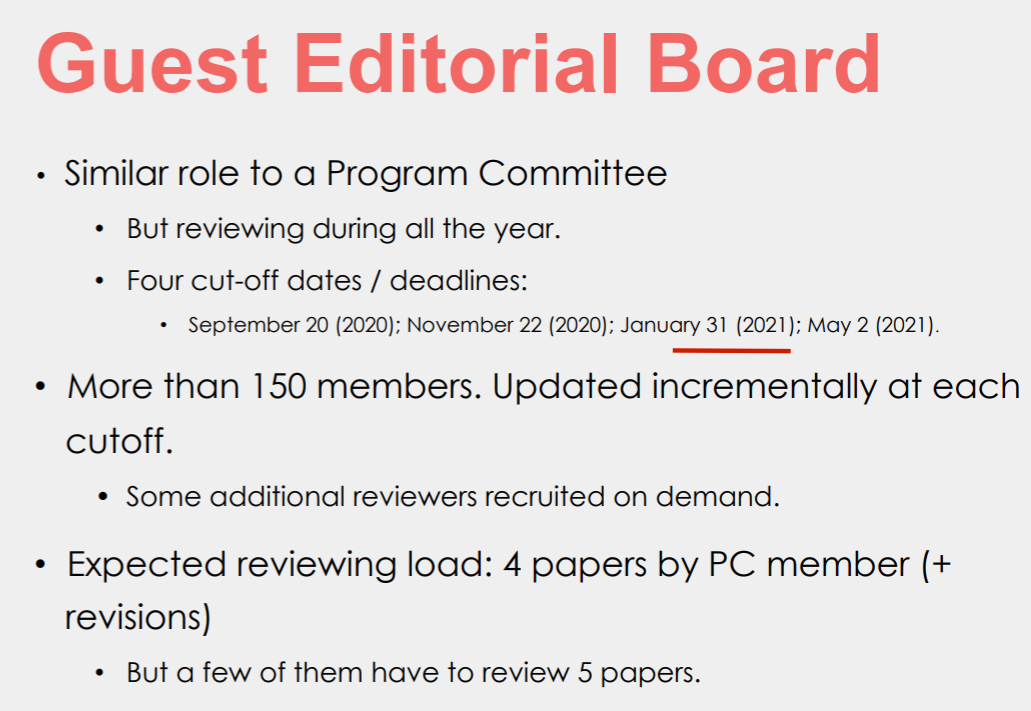
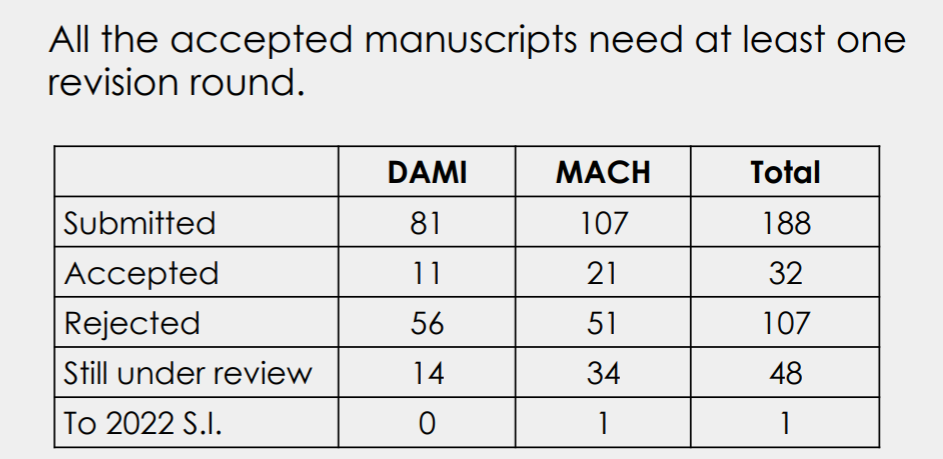
Some slides about the journal track, including the number of accepted papers and submitted papers:
Some slides about the workshop topics:
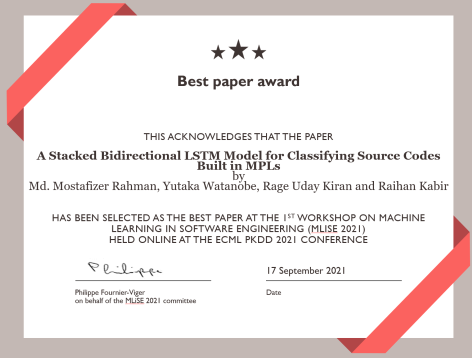
Best paper award
Several awards were announced. Mainly, the best paper award went to:
Reparameterized Sampling for Generative Adversarial Networks, by Yifei Wang, Yisen Wang, Jiansheng Yang and Zhouchen Lin
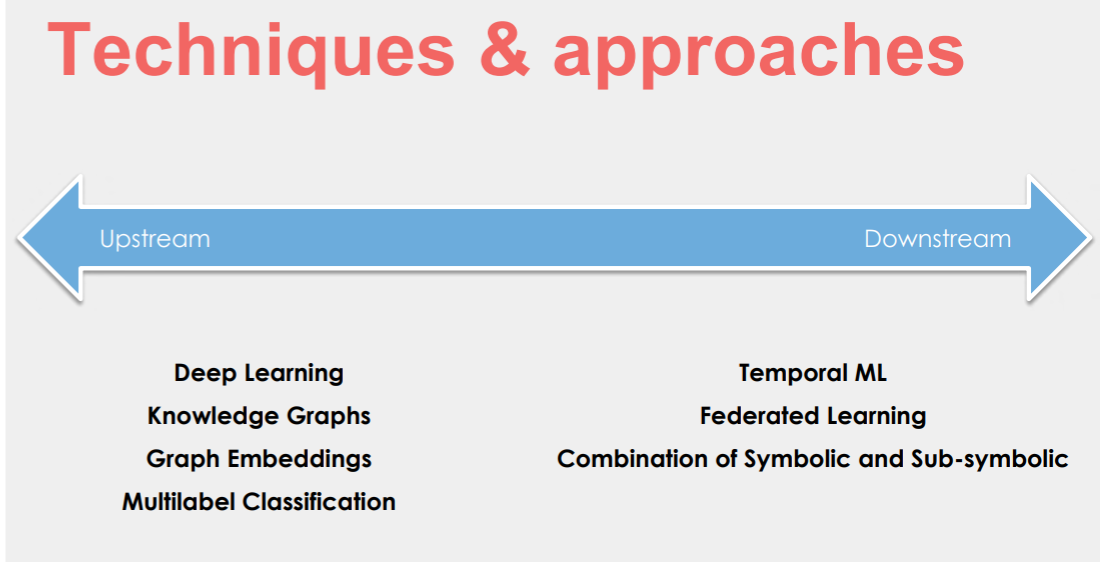
Workshop on Machine Learning on Software Engineering (MLiSE 2021)
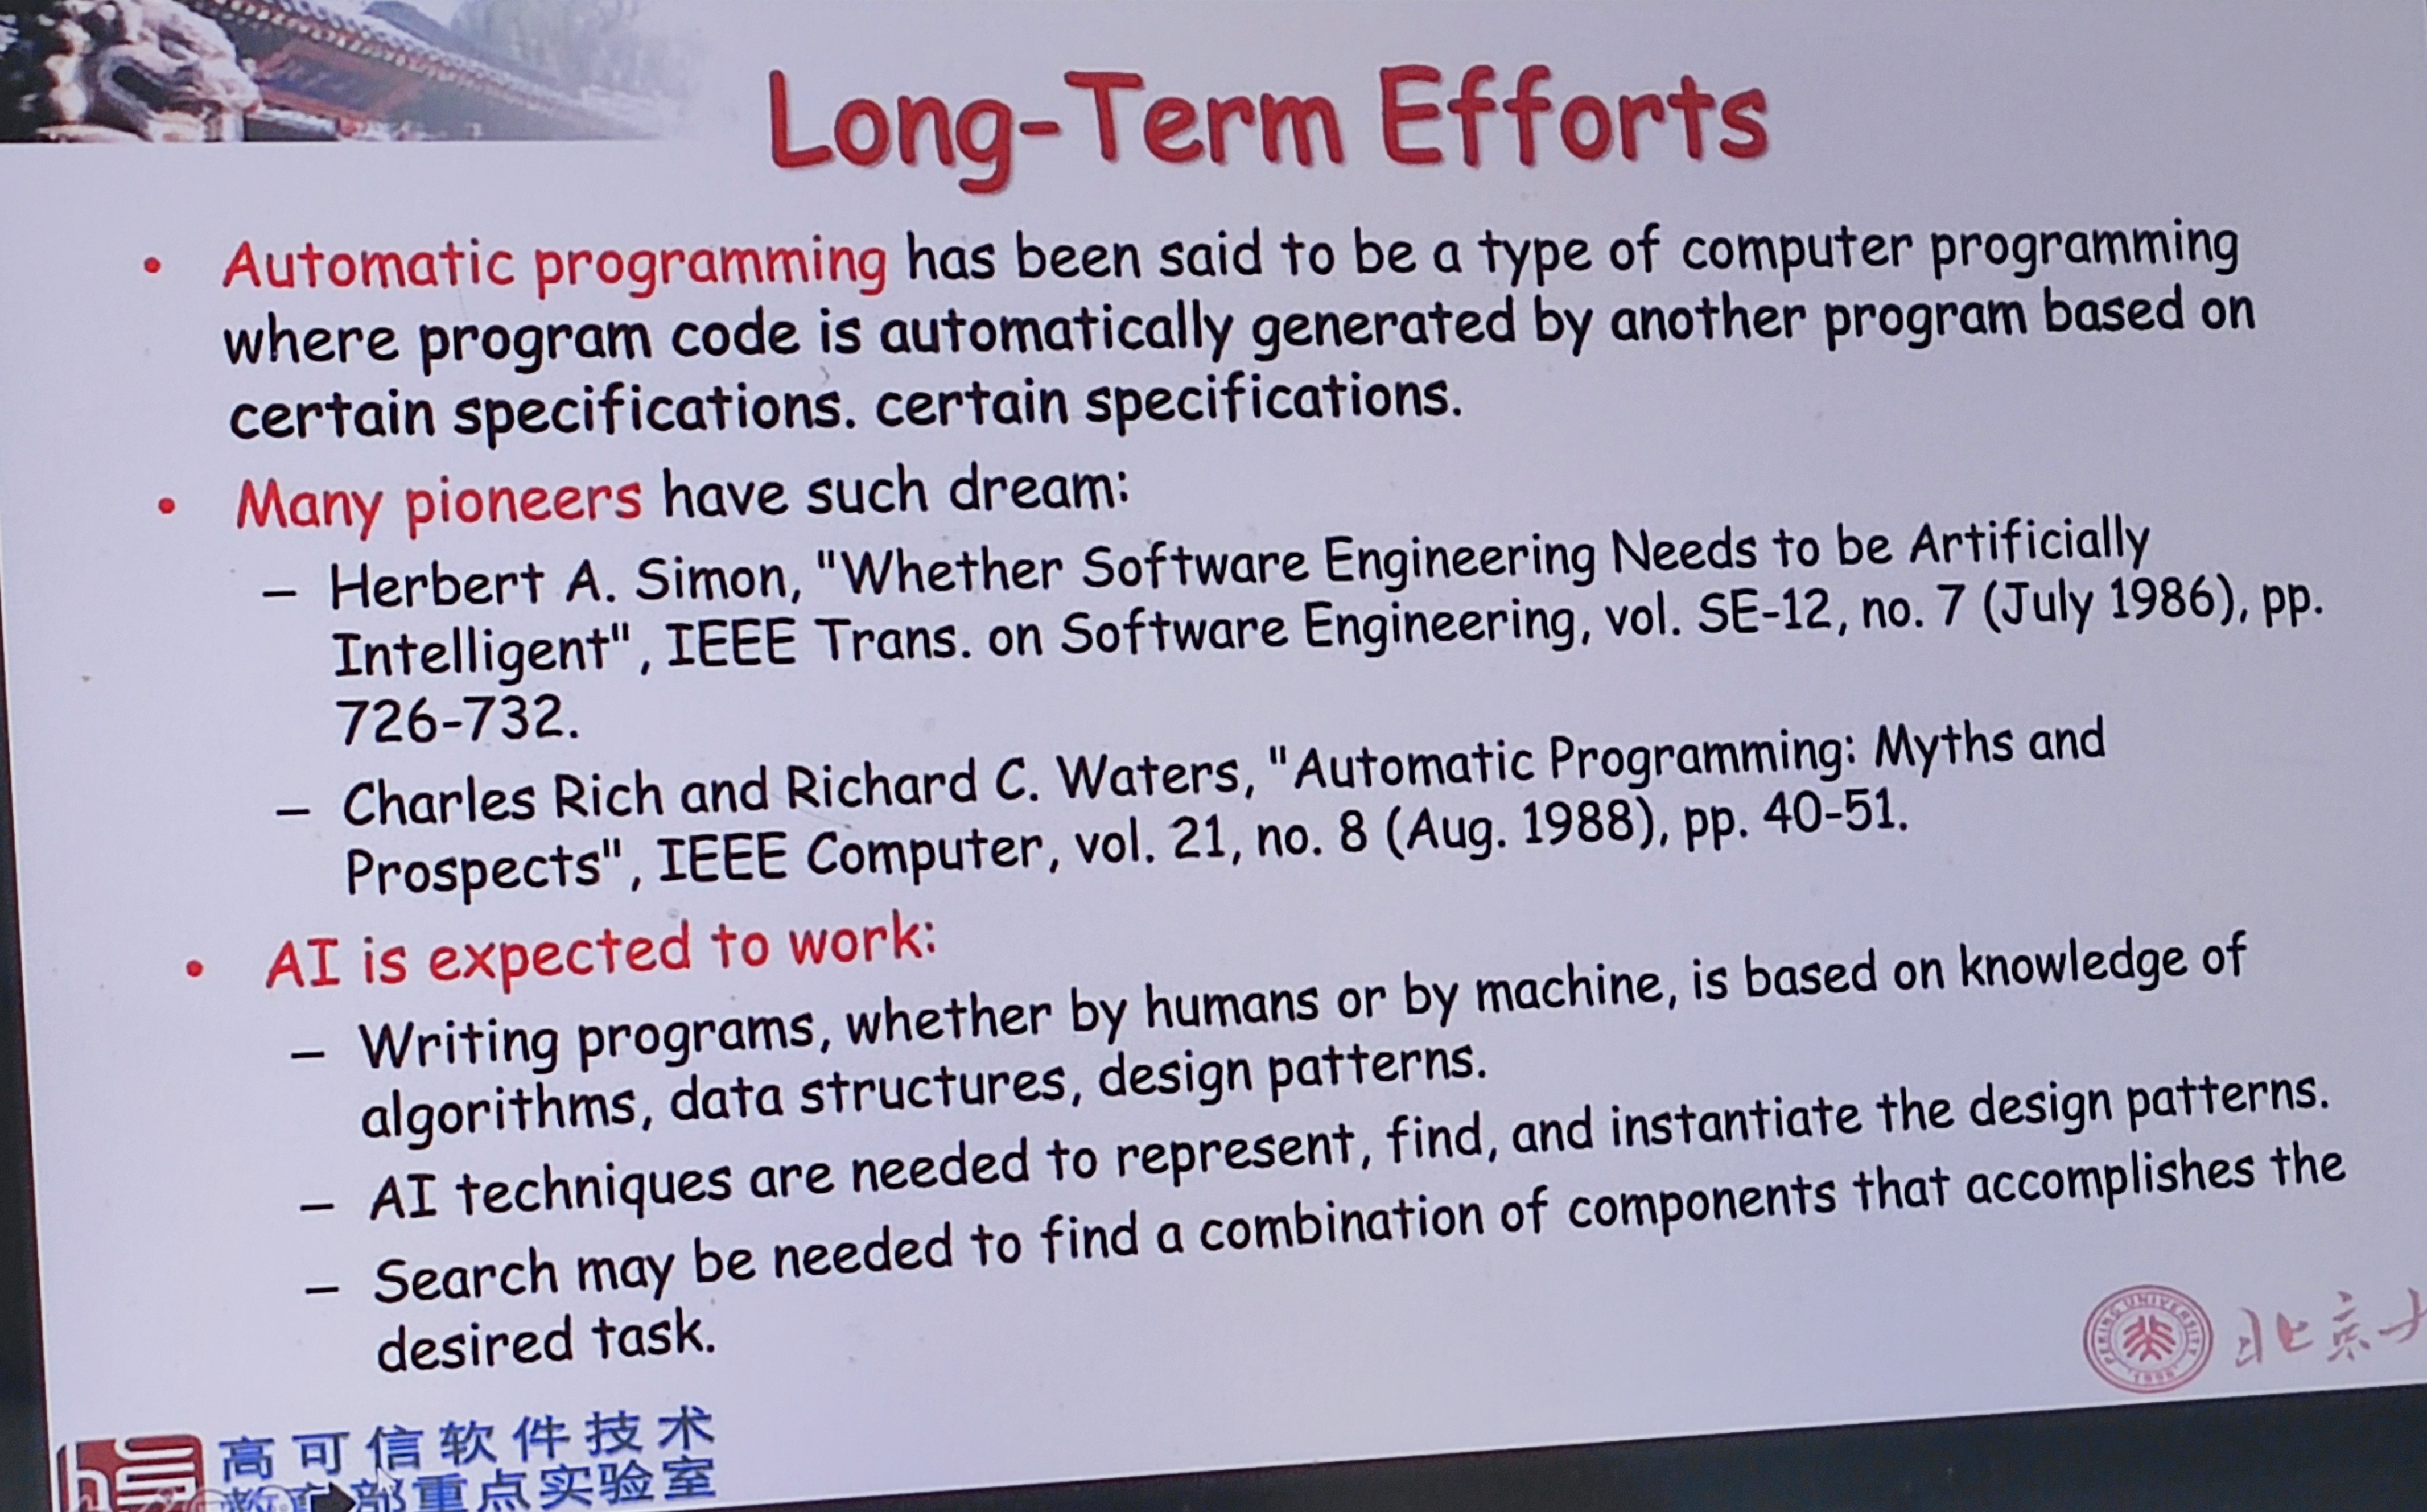
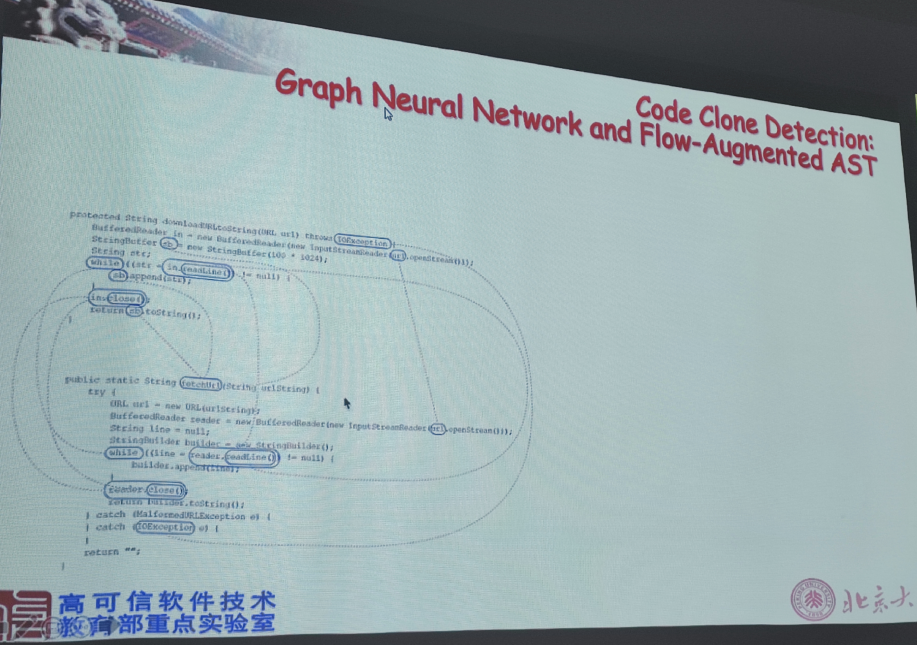
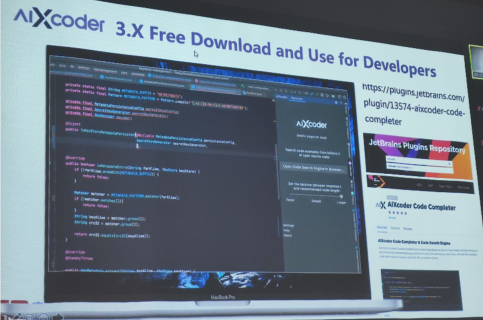
We had an excellent keynote talk by Prof. Zhi Jin from Peking University, who talked about using deep learning for software engineering. Some models were discussed for tasks such as code completion and code clone detection. A free tool called AIXCoder was also presented to support software developpers using AI.
There was also a second excellent keynote by Prof. Atif Mashkoor from Johannes Kepler University Austria
With two keynotes, seven papers, and many attendees, the MLiSE workshop was a success. We will thus try to organize it again at ECML PKDD next year!
Conclusion
That is all about the conference. I could have written more but this week was very busy. I could not attend all the events.
— Philippe Fournier-Viger is a full professor working in China and founder of the SPMFopen source data mining software.
Today, I will talk about pattern mining, a subfield of data science that aims at finding interesting patterns in data. More precisely, I will briefly describe a popular data mining task named high utility itemset mining. Then, I will describe a limitation of this task, which is the lack of information about quantities in the discovered patterns, and an extension that address this issue, called high utility quantitative itemset mining.
High Utility Itemset Mining
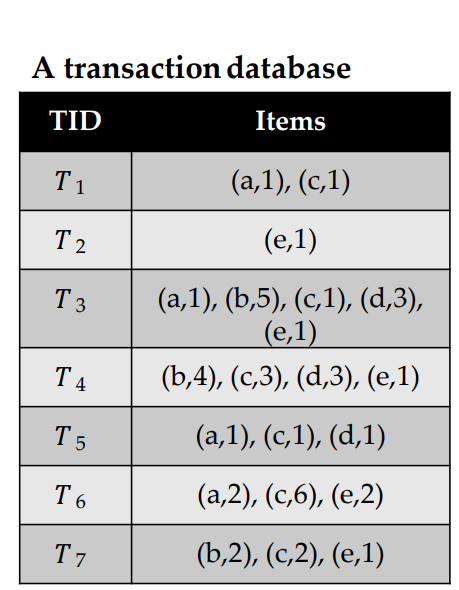
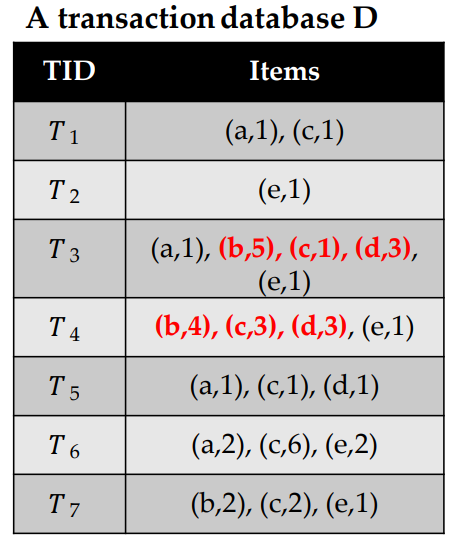
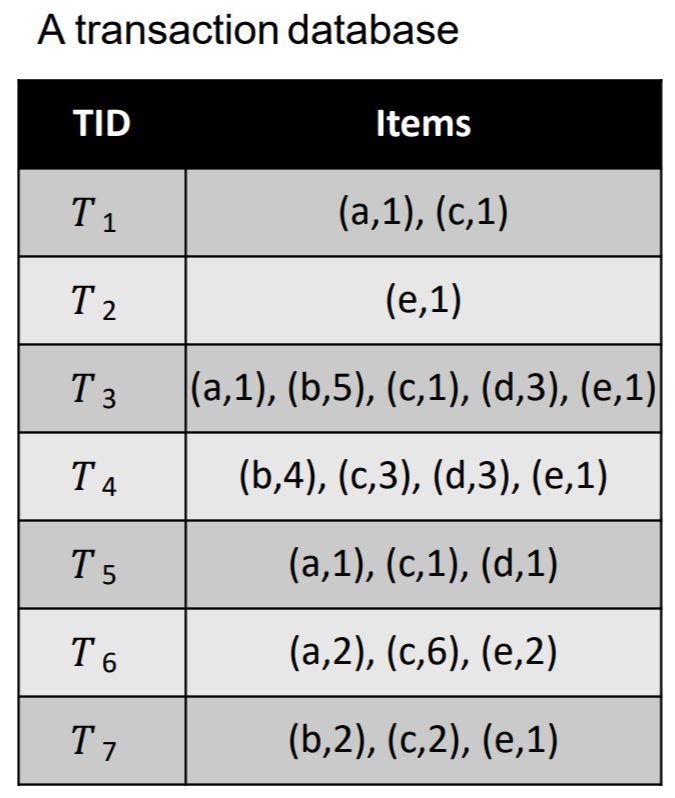
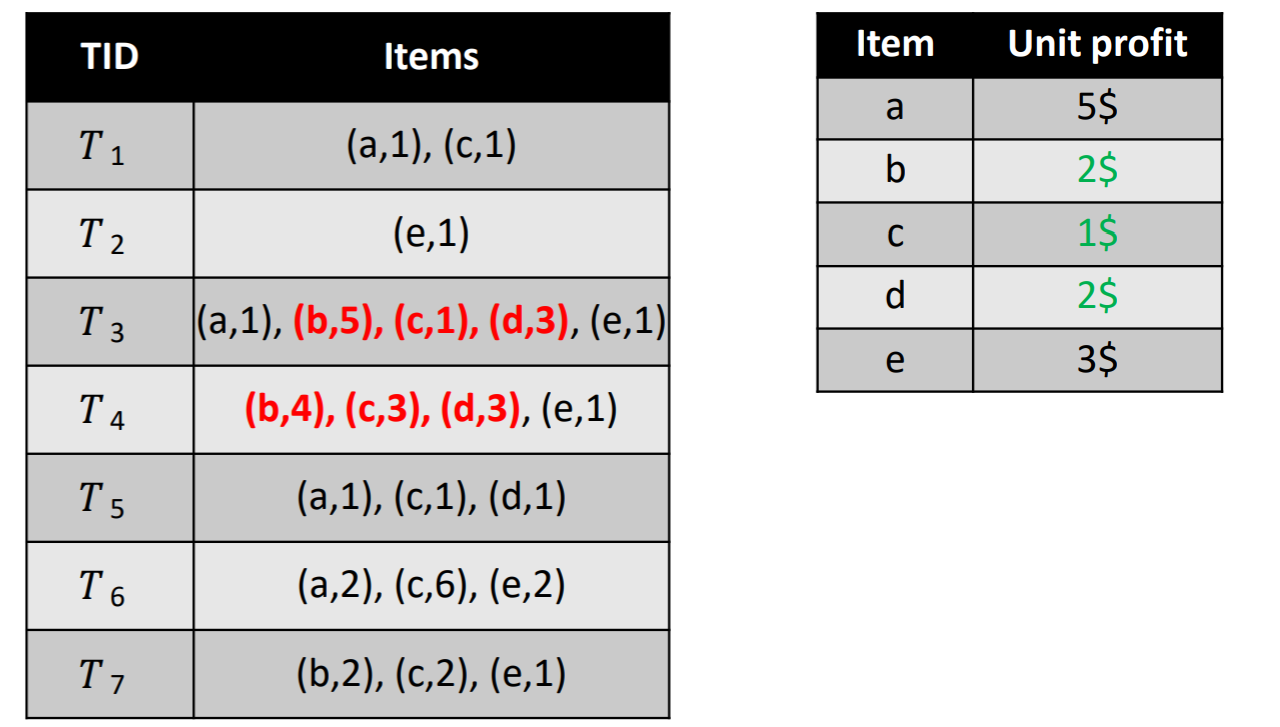
High utility itemset mining is a data mining task, which consists of finding patterns that have a high utility (importance) in a dataset, where the utility is measured using a function. There are various applications of this task, but the most representative one is to analyze customer transactions to find sets of products that people like to purchase together and yield a high profit. I will thus briefly explain what is high utility itemset mining for this application. In that context, the input is a transaction dataset, as illustrated in the table, below.
This dataset contains seven records called T1, T2, T3, T4, T5, T6, T7. Each record is a transaction, indicating what items (products) a customer has purchased in a store at a given time. In this example, the products are called “a”, “b”, “c”, “d” and “e”, which stands for apple, bread, cake, dattes and eggs. The first transaction (T1) indicates that a customer has purchased one unit of item “a” (one apple), with one unit of item “c” (one cake). The sixth transaction (T6) indicates that a customer has bought two units of “a” (two apples) with 6 units of “c” (six cakes) and 2 units of “e” (two eggs). Other transactions follow the same format.
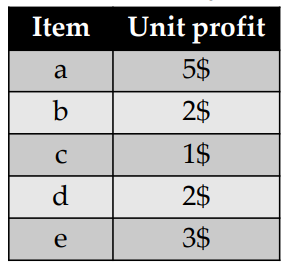
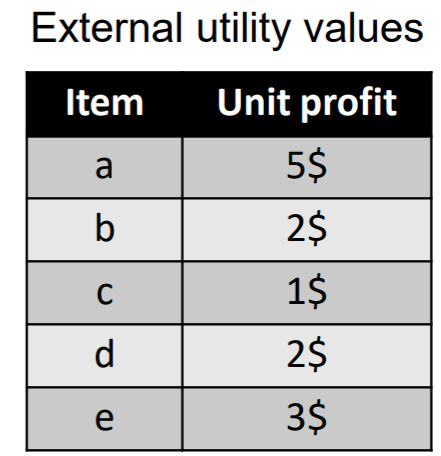
Moreover, another table is taken as input, shown below, which indicates the amount of money that is obtained by the sale of each item (the unit profit).
For instance, in that table, it is indicated that selling an apple (item “a”) yields a 5$ profit, while each bread sold (item “b”) yields a 2$ profit.
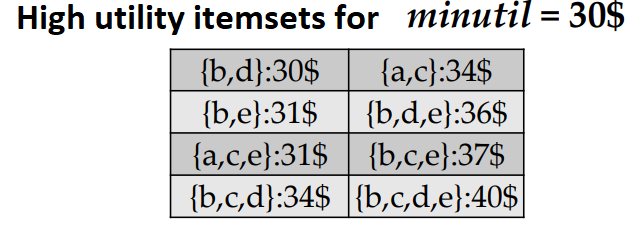
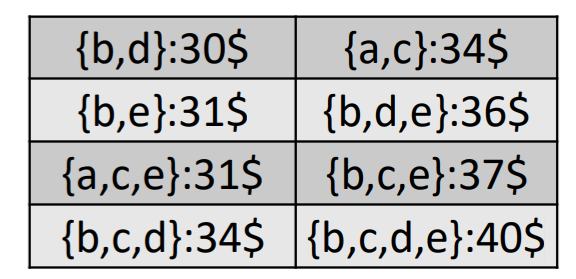
The goal of high utility itemset mining is to find the itemsets (sets of items) that yield a utility (profit) that is greater than or equal to a threshold called the minimum utility (minutil) threshold, set by the user. For instance, if the user sets minutil = 30$, the goal is to find all the sets of items (itemsets) that yield at least 30$ in the above database. Those itemsets are called the high utility itemsets. For this example, there are only 8 high utility itemsets, which are shown below with their utility (profit) in the database.
For instance, the itemset {b,c,d} has a utility of 34$, and it is a high utility itemset because 34$ > minutil = 30 $. But how do we calculate the utility (profit) of an itemset? Let me explain this more clearly.
Let’s take the itemset {b,c,d} as example. To calculate the utility (profit) of {b,c,d}, we first need to find all the transactions that contain {b,c,d} together. There are only two transactions (T3 and T4), highlighted below:
After we have found that, we need to calculate the utility of {b,c,d} in transaction T3 and in transaction T4 and do the sum.
Let’s first look at T3. Here, we have 5 units of “b” which have a unit profit of 2$ with 1 unit of item “c” that has a unit profit of 1$, and 3 units of “d” which has a unit profit of 2$. Thus, the utility of {b,c,d} in T3 is (5 x 2 ) + (1 x 1) + ( 3 x 2) = 17 $.
Now, lets look at T4. Here, we have 4 units of “b” which have a unit profit of 2$ with 3 unit of item “c” that has a unit profit of 1$, and 3 units of “d” which has a unit profit of 2$. Thus, the utility of {b,c,d} in T3 is (4 x 2 ) + (3 x 1) + ( 3 x 2) = 17 $.
Then, we do the sum of the utility of {b,c,d} in T3 and T4 to get its total utility (profit) in the whole database, which is 17$ + 17 $= 34 $.
To find the high utility itemsets in a database, many algorithms have been designed such as FHM, EFIM, HUI-Miner, ULB-Miner and UP-Growth. I have published a good survey on high utility itemset mining, which gives more details about it.
High Utility Quantitative Itemset Mining
The task of high utility itemset mining (HUIM) is useful but there is a major limitation, which is that the discovered high utility itemsets do not provide information about quantities. Thus, even though an itemset like {b,c,d} may be a high utility itemset, it does not indicate how many breads, how many cakes and how many dattes people like to buy together. But of course, buying 1 breads, 5 breads or 10 breads is not the same. Thus, it is important to have this information.
To address this limitation, the task of High Utility Quantitative Itemset Mining (HUQIM) was proposed. In this task, the discovered patterns provide information about quantities.
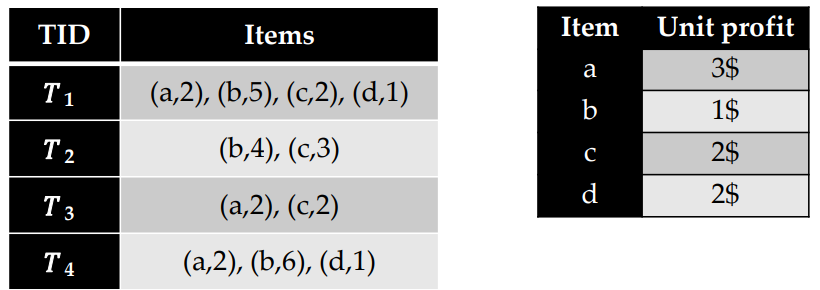
I will explain this with an example. Consider this database:
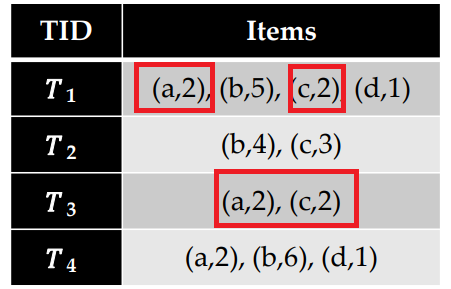
In HUQIM, we may find an itemset with quantities such as {(apple:2), (cake:2)} indicating that some people buy 2 apples with 2 cakes. But how to calculate the utility of this itemset? The utility is calculated as before but by only considering the transactions where a customer has bought 2 apples with 2cakes, that is T1 and T3:
The utility of {(apple:2), (cake:2)} in T1 is: (2 x 3) + (2 x 2), and the utility of that itemset in T3 is (2 x 3) + (2 x 2). Thus the utility of {(apple,2), (cake,2)} in the whole database is the sum of this: (2 x 3) + (2 x 2) + (2 x 3) + (2 x 2) = 20 $.
Such itemset where each item has an exact quantity is called an exact Q-itemset.
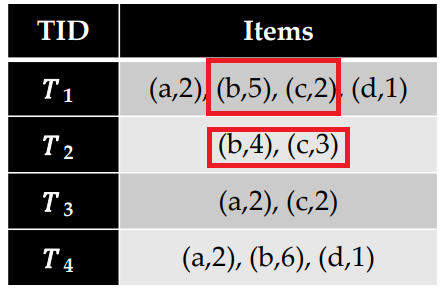
It is also possible to find another type of itemsets called the range Q-itemsets. Explained simply, a range Q-itemset is an itemset where quantities of items are expressed with some intervals. For example, the itemset {(bread,4,5),(cake,2,3)} means that some customer(s) buy 4 to 5 breads with 2 to 3 cakes. To compute the utility of this itemset is also simple. We first need to find all transactions where there are 4 to 5 breads with 2 to 3 cakes and calculate the utility (profit) and then do the sum. The two transactions meeting this criterion are T1 and T2:
Then, we multiply the quantity of bread and cake by their unit profits in these two transactions, which gives : (5 x 1) + (2 x 2) + (4 x 1) + (3 x 2) = 19 $
The problem of high utility quantitative itemset mining is interesting as it provides more information to the user than high utility itemset mining. However, the problem is also much more difficult because for each itemset like {b,c} multiple quantities may be assigned such as {(b,4),(c,3)}, {(b,5),(c,2)}, or even{(b,4,5),(c,3)}, etc. To avoid considering all possibilities, the algorithms for high utility quantitative itemset mining will use different combination methods to combine the quantities into ranges. There are a few combine methods like “combine_all”, “combine_min” and “Combine_max” that can be used. I will not explain them in this blog post to avoid going into too many details. Besides, there is also a parameter called “qrc” that is added to avoid making unecessary combinations.
In the end, the goal of high utility quantitative itemset is to find all the itemset with quantities that have a utility that is not less than the minutil threshold set by the user. I will just show a brief example of input and output:
To find high utility quantitative itemsets, the main algorithms are:
HUQA (2007), proposed in the paper “Mining high utility quantitative association rules”
VHUQI (2014), presented in the paper “Vertical mining of high utility quantitative itemsets”.
HUQI-Miner (2019), introduced in the paper “Efficient mining of high utility quantitative itemsets”
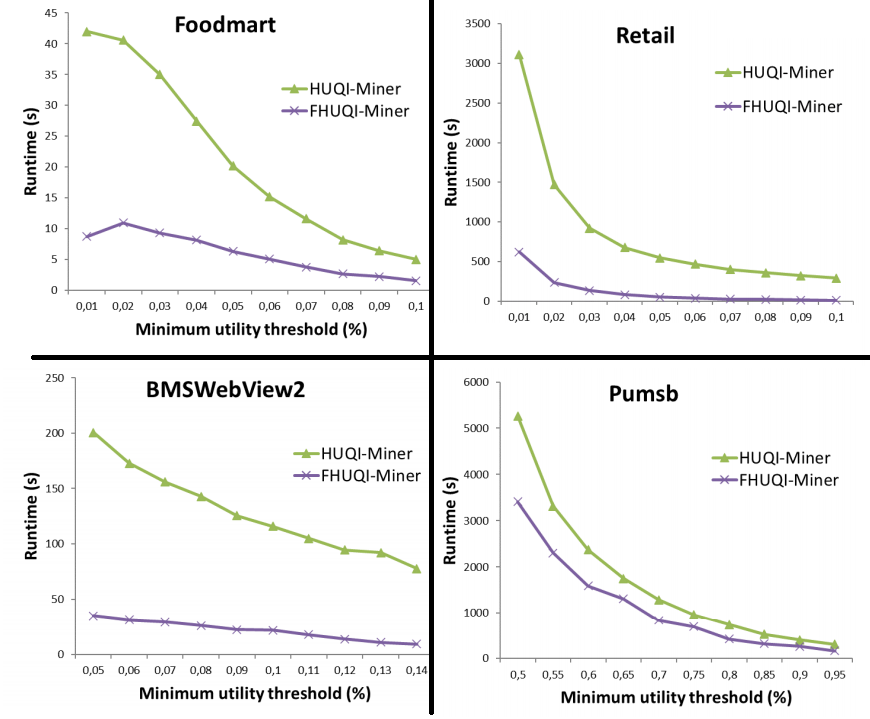
If you are new to this topic, reading the FHUQI-Miner paper is a good start as it is a journal paper that explains clearly all the important definitions with many examples. FHUQI-Miner was also shown to be much faster than the previous best algorithms in experiments, so it is good to start from this algorithm to develop extensions. Below is for example a performance comparison of FHUQI-Miner with the previous best algorithm called HUQI-Miner. It was found that FHUQI-Miner can be up to 20 times faster in some cases.
Also, you may find open-source implementations of several algorithms for HUQIM in the SPMF open-source data mining software, with datasets.
It is also possible to study extensions of the problem of finding high utility quantitative itemsets. For example, here are two recent papers by my team where we extend FHUQI-Miner for variations of the problem:
TKQ (2021) : Finding the top-k high utility quantitative itemsets : The idea is that rather than using the minutil parameter, the user can directly ask to find the k itemsets that yield the highest utility (e.g. the top 100 itemsets)
CHUQI-Miner (2021): This is a recent algorithm to find correlated high utility quantitative itemsets. The motivation is that many itemsets may have a high utility but still be weakly correlated. By using the bond correlation measure, more meaningful itemsets may be found.
Conclusion
In this blog post, I introduced the problem of high utility quantitative itemset mining. Hope it has been interesting. The content of this blog post is based on the articles that I did with Dr. Mourad Nouioua, post-doc in my team, on FHUQI-Miner and his very detailled powerpoint presentation about this algorithm. If you have any comments, please leave it in the comment section below!
— Philippe Fournier-Viger is a full professor working in China and founder of the SPMFopen source data mining software.
Today, I will talk about discovering interesting patterns in data, what is called pattern mining, and in particular about how the concept of taxonomy can be useful to find interesting patterns. There has been a lot of research on pattern mining over the years to find various types of interesting patterns in data, and numerous algorithms have been designed for that. To explain the interest for taxonomies in finding patterns, I will talk about a classical problem in pattern mining calledhigh utility itemset mining.
High Utility Itemset Mining
High utility Itemset mining aims at searching in data to find itemsets (sets of values) that have a high importance as measured by a utility function. There are many applications of this problem, but let me illustrate it with shopping data as it is a popular example.
The input of high utility Itemset mining in that context is a database containing a set of records called transactions. Each transaction indicates the items (products) that some customer has purchased at some moment. For example, let’s look at this database of seven transactions, called T1, T2 .. T7:
The first transaction (called T1) indicates that a customer purchased two products (items) called “a” and “c”, which could represent for example the products “apple” and “cake”. The number 1 besides “a” and the number 1 besides “c” indicate that the customer purchased 1 unit of item “a”, and 1 unit of item “c”, that is one apple and one cake. The second transaction (called T2) indicates that a customer purchased 1 unit of item “e”, which could stand for “egg”. The sixth transaction (T6) indicates that a customer purchased 2 apples, 6 cakes and 2 eggs.
Furthermore, another table shown below indicates the utility (relative importance) of each item, which in this case is the unit profit (how much money a store earns by selling one unit of an item).
This table indicates for example that selling 1 unit of item “a” yields a 5$ profit, while selling 1 unit of item “b” yields a 2$ profit, and so on.
Having such data, it is possible to calculate how much utility (money) is obtained from the sale of different Itemsets (sets of products). For example, consider the itemset {b,c,d}. The utility of that itemset is the amount of money obtained when “b”, “c” and “d” are sold together. This is calculated as follows. First, we observe that “b,c,d” are purchased together in two transactions (T3 and T4), highlighted in red color below:
To find the amount of money (utility) that {b,c,d} yields in transaction T3, we multiply the number of units of each item by its unit profit, as follows. Since, there are 5 units of item “b” and its unit profit is 2, there is 1 unit of item “c” and its unit profit is 1, and there are 3 units of item “d” and the unit profit of “d” is 3, the calculation is: (5 x 2) + (1 x 1) + (3 x 2) = 17.
To find the amount of money (utility) that {b,c,d} yields in T4, we multiply the number of units of each item by its unit profit, as follows. Since, there are 4 units of item “b” and its unit profit is 2, there is 3 unit of item “c” and its unit profit is 1, and there are 3 units of item “d” and its unit profit is 3, the calculation is: (4 x 2) + (3 x 1) + (3 x 2) = 17.
Then, we do the sum of the utility of {b,c,d} in transactions T3 and T4 to find its total utility, which is 17 + 17 = 34.
The problem of high utility itemset mining applied to such data consists of finding the itemsets (sets of products) purchased together that yield a profit that is no less than a threshold called minutil. For instance, if minutil = 30$, then there are 8 such itemsets, which we call the high utility itemsets. They are:
where each itemset is annotated with its utility (profit). For instance, as can be seen above, {b,c,d} is a high utility itemset as it yield 34$, which is no less than minutil = 30$.
There exists several algorithms to quickly find all high utility itemsets in a dataset such as FHM, EFIM, HUI-Miner, ULB-Miner and UP-Growth.
Finding high utility itemsets can be useful to reveal patterns in the shopping habits of customers, and can be also applied to other fields where the concept of “utility” may have other meaning than the money. However, a major limitation of high utility itemset mining is that there is no concept of categories of items. But in real life, items in stores are generally categorized or grouped. For example, various milk bottles of different sizes and brands can all be viewed as belonging to a category milk. Similarly, all types of cheese, yogurt and milk can be viewed as members of a higher level category called dairy products. In many cases, when analyzing data, it is preferable to view items of a same category together rather than evaluating them individually. For instance, it may make more sense in some contexts to just talk about chocolate in general than each different brands of chocolate bars.
Multi-level high utility Itemset mining
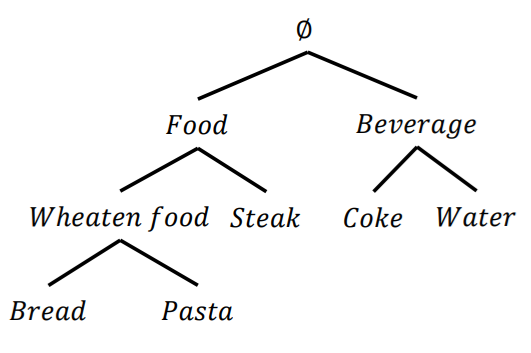
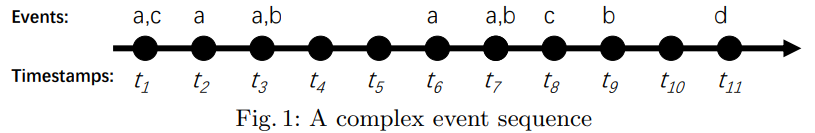
To be able to consider product categories in high utility Itemset mining, Cagliero et al (2017) proposed the task of multi level high utility Itemset mining. In this problem, a taxonomy must be provided by the user, indicating the categories of products. A taxonomy is like a tree where each category can be divided in sub categories, and nodes at the bottom of the tree (the leaves) contain the items. For example, a taxonomy is shown below:
This taxonomy contains several levels. A the bottom level (the leaves), the items “coke”, “water”, “bread” and “pasta” are found. At the second level, these items are grouped into categories called “Weaten food” and “Beverage”. At the third level, there is a category called “Food” and finally, the root of the tree is the category containing everything.
Clagliero et al. proposed an algorithm called MLHUI-Miner to finds high utility itemsets at different levels of a taxonomy. This can allow to find high utility itemsets containing categories instead of items. For example, using the above taxonomy, MLHUI-Miner could find a high utility itemset such as:
{Wheaten food, Beverage}
where Wheaten food and Beverage are categories grouping several products. However, a major limitation of the problem defined by Clagliero et al is that a same itemset is not allowed to contain categories from different levels. This means that itemsets such as {Bread, Beverage} cannot be found because “bread” and “beverage” do not belong to the same taxonomy level. Thus, several interesting patterns may be missed by MLHHUI-Miner.
Cross-level high utility Itemset mining
To address the above problem, Fournier-Viger et al. (myself) proposed the more general problem of cross-level high utility itemset mining. The goal is to find high utility itemsets where items and categories can be mixed from any taxonomy level. I will give a brief explanation of this problem with an example. Consider the same database that I have shown before, but this time there is a taxonomy that is provided, shown on the right:
This taxonomy indicates that a category X contains an item “c” and a sub-category “Y” of “X” contains two items “a” and “b”. Furthermore, a category “Z” contains two items “d” and “e”.
Using such taxonomy, it is possible to calculate the utility of itemsets containing items and/or categories. To explain this, I will give an example of calculating the utility for the itemset {Y,C}, which means the total amount of money for all transactions that contain “a” and/or “b” with item “c”. To calculate this, we first observe that itemset {Y,c} appears in transactions T1, T3, T4, T5, T6 and T7. Thus, we calculate the utility of {Y,c} in these transactions and do the sum:
In Transaction 1, we multiply 1 unit of item “a” by its unit profit of 5$, and add 1 unit of item “c” multiplied by its unit profit of 5$, thus: (1 x 5 + 1 x 1) In Transaction 2, we multiply 1 unit of item “a” by its unit profit of 5$, add 1 unit of item “b” multiplied by its unit profit of 2$, and add 1 unit of item “c” multiplied by its unit profit of 1$ thus: (1 x 5 + 5 x 2 + 1 x 1) … and we do this also for the transactions T4, T5, T6 and T7.
This gives us the following sum for the transactions T1, T3, T4, T5, T6 and T7:
which indicates that the total utility of {Y,c} is 61$.
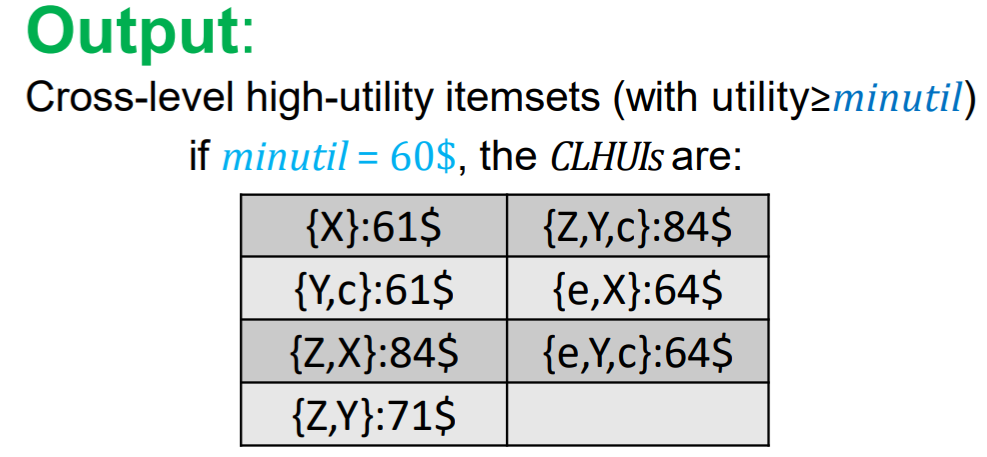
In cross-level high utility itemset mining, the user must set a minutil threshold. If we set this threshold to 60$, then the goal is to find all the cross-level high utility itemsets, that is the itemsets that yield a profit of at least 60$ and contain items or categories. For example, for the above example, the result is:
In this example, there are several itemsets like {Y,c} that are contain items/categories from different taxonomy levels. Those cannot be found by MLHUI-Miner.
The CLH-Miner algorithm is the first algorithm to be proposed for this new generalized problem of cross-level high utility itemset mining. Then, another algorithm called TKC was proposed for a variation of this problem called finding the top-k cross-level high utility itemsets. In that problem, rather than using minutil, the user must set a parameter k and TKC will output the k cross-level itemsets that have the highest utility. For example, if we set k = 5, TKC will produce this result:
TKC is an interesting algorithm because setting the parameter “k” is usually more intuitive for the user than using the “minutil” parameter. For example, using TKC, a retail store owner can directly look for the top 5 itemsets that yield the most profit. But using the “minutil” threshold, it is not obvious to know how many patterns will be found before running the algorithm.
Finding cross-level high utility itemsets in real shopping data
If you want to try high utility Itemset mining with a taxonomy, the source code of CLH-Miner, TKC and MLHUI-Miner can be obtained as part of the open source SPMF data mining library.
There are also some real transaction datasets with taxonomies called Liquor and Fruithut, that you can download from the SPMF website’s dataset page. Liquor contains 9,284 transactions from liquor stores in the US, where there are 2,626 items and the taxonomy contains 7 levels. Fruithut contains 181,970 transactions from fruit stores in the US, where there is a taxonomy of 4 levels.
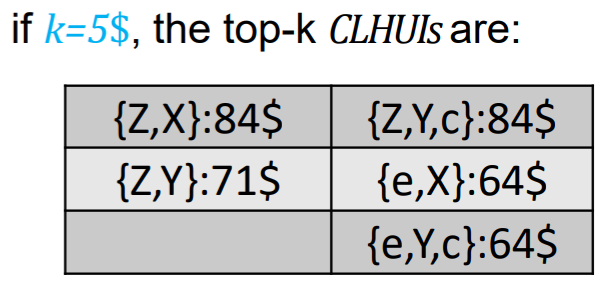
By applying the CLH-Miner or TKC algorithm, several interesting patterns can be found. For example, in the Fruithut dataset, the itemset {bean, cherries} is found, which indicates that people like to purchase beans with cherries and that it is profitable. In that itemset, “beans” is a category. Here is a part of the taxonomy from Fruithut that shows the different kinds of beans under that category:
Another example of real cross-level high utility itemsets is the following. In the Liquor dataset the itemset {Cordials& Liqueurs, Neutral Grain Spirits} indicates that customers purchase “cordials and liqueurs” with “neutral grain spirits” and this yield a lot of money in Liquor stores.
References on this topic
If you want to know more about this topic, the algorithms that I have discussed in this blog post are described in a more formal way in these papers:
TKC : Nouioua, M., Wang, Y., Fournier-Viger, P., Lin, J.-C., Wu, J. M.-T. (2020). TKC: Mining Top-K Cross-Level High Utility Itemsets. Proc. 3rd International Workshop on Utility-Driven Mining (UDML 2020), in conjunction with the ICDM 2020 conference, IEEE ICDM workshop proceedings, to appear.[ppt]
CLH-MINER: Fournier-Viger, P., Yang, Y., Lin, J. C.-W., Luna, J. M., Ventura, S. (2020).Mining Cross-Level High Utility Itemsets. Proc. 33rd Intern. Conf. on Industrial, Engineering and Other Applications of Applied Intelligent Systems (IEA AIE 2020), Springer LNAI, pp. 858-871. [source code][ppt]
MLHUI-MINER:. Cagliero, T. Cerquitelli, P. Garza, and L. Grimaudo, “Misleading generalized itemset discovery,” Expert Syst. Appl., vol. 41, pp. 1400– 1410, 2014.
Besides, if you are interested by an overview of high utility itemset mining, I have written an easy-to understand survey:
Fournier-Viger., P., Lin, J. C.-W., Truong, T., Nkambou, R. (2019). A survey of high utility itemset mining. In: Fournier-Viger et al. (eds). High-Utility Pattern Mining: Theory, Algorithms and Applications, Springer (to appear), p. 1-46.
Conclusion
In this blog post, I have discussed the problem ofhigh utility itemset mining with a taxonomy to give an introduction to this topic. The studies in this blog post were inspired by early work on frequent itemset mining with a taxonomy. Besides, it is to be noted that taxonomy can be used or has been used in other pattern mining problems such as sequential pattern mining, episode mining and periodic pattern mining. For researchers, there are also many opportunities to extend the algorithms like CLH-Miner and TKC that I have presented above.
If you have comments, please share them in the comment section below. I will be happy to read them.
—
Philippe Fournier-Viger is a full professor and founder of the SPMF open source data mining software.
In this short blog post, I will talk about some common mistakes that are done by researchers when submitting a paper to a journal or conference.
Not respecting the required format or maximum number of pages: Most journals and conferences requires that papers follow some template. It is important to follow it carefully. For some journals or conferences, a paper that does not follow the required format may be rejected right away. Besides, small formatting errors may give a bad impression to reviewers.
Not respecting the guidelines about the double-blind review. Some conferences will require that all papers are anonymized (do not contain author information) so as to avoid conflicts of interests with reviewers. A conference that follows this process where authors don’t know who are the reviewers and where reviewers don’t know who are the authors is said to follow a double-blind process. It is important to check whether a conference is double-blind before submitting a paper as not following this may result in a paper being rejected.
Not choosing the appropriate categories when submitting your paper. Several journals or conferences require to select some categories or topics when submiting a paper. It is important to choose this correctly as this helps for assigning your paper to the right reviewers. Generally, one should choose the categories that best describe their papers. Some authors submiting journal papers will sometimes choose the wrong category on purpose to try to avoid reviewers from their field or other reasons. Do not do this. The editor or organizers can easily see this and may have a bad impression.
Not proofreading your paper. A paper should be well-written. If a paper is submitted with a lot of English errors, it gives a very bad impression. One should not submit a draft but rather a paper that looks like a final version.
Not verifying that the files have been uploaded properly. Another common problem is that some authors will upload the wrong files, or files with some PDF errors. It is important to double check the files that you have uploaded to make sure they are correct.
Not updating your paper with recent references. Another very common problem is that some authors will submit a paper that does not contain enough recent references. For example, after finishing a PhD, a researcher may submit a journal paper based on his thesis done a few years ago but may forget to update the paper with recent papers. It is important to cite several papers from the last 5 years to show that you are aware of all the recent work.
Not comparing with state-of-the-art research. If you are developing a new model or technique, it is important to compare with the state-of-the-art research.
Submiting a paper that contain plagiarism or a too high similarity to other papers. Some young researchers will also submit papers that contain text copied from other websites or papers. This should be avoided. Besides, nowadays it is also important to avoid reusing text from your own papers in other papers, as much as possible. Several journals will for example reject papers if they are too similar to other papers from other authors or the same authors.
Submiting to the wrong journal or conference. Another common problem is to submit a paper to a journal or conference that is not relevant to the topic of your paper. This is often enough for a paper to be rejected. Thus, it is important to look for a suitable journal for each paper.
And there are certainly many other mistakes. Those are the ones that comes to my mind as the most common mistakes. Hope that this post has been interesting! Do you think I forgot something? Do you want to share your experience? If so, then please leave a comment in the comment section below.
—
Philippe Fournier-Viger is a full professor working in China and founder of the SPMFopen source data mining software.
In this blog post, I will talk about pattern mining (finding patterns in data) data mining task called episode mining. It aim at discovering interesting patterns in a longsequence of symbols or events. Sequence data is an important type of data found in many domains. For instance, a sequence can encode data such as a sequence of alarms produced by a computer system, a sequence of words in a text, and a sequence of purchases made by a customer. Using episode mining, patterns can be discovered in a sequence. These patterns can then be used to understand the data, and support decision making.
I will first define what is an event sequence. Then, I will introduce the basic problem of episode mining. Then, I will discuss some extensions and software for episode mining.
What is an event sequence?
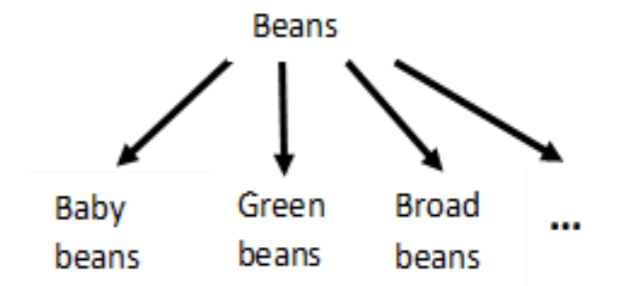
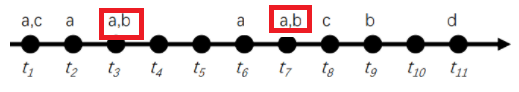
An event sequence (also called a discrete sequence) is a list of events, where each event has a distinct timestamp. For example, consider the following event sequence:
In that sequence, each letter (a,b,c,d) is an event type and t1, t2, … t11 are timestamps. The above sequence indicates that event “a” and “c” occurred at time t1, was followed by event “a” at time t2, then by events “a” and “b” at time 3, then followed by event “a” at time t6, and so on. A visual representation of this sequence is shown below:
If an event sequence contains some events that occur simultaneously (have the same timestamp), it is said to be a complex event sequence. Otherwise, it is said to be a simple sequence.
As previously said, sequence data is found in many domains. For example, the above sequence could represent the purchases made by a customer in a store over time where “a”, “b”, “c” and “d” represents different types of products such as “apple”, “bread”, “cake” and “dattes”. Another example is a sequence of locations visited by a person in a city, where “a”, “b”, “c” and “d” could represent the home, a restaurant, the university and the gym. Another example is a sequence of words in a text, where “a”, “b”, “c” and “d” represent different words.
Frequent Episode mining
To analyze such sequence of events or symbols, a popular data mining task is frequent episode mining. The aim is to find all the episodes (subsequences of events) that appear frequently in a sequence over time. An episode is said to be frequent if it appears at least minsup times, where minsup is a parameter set by the user.
The task of finding these frequent episodes is called frequent episode mining. It was proposed by Toivonen and Mannila in 1995 to analyze alarm sequences in this paper:
Mannila, H., Toivonen, H., Verkamo, A.I.: Discovering frequent episodes in sequences. In: Proc. 1st Int. Conf. on Knowledge Discovery and Data Mining (1995)
Toivonen and Manila proposed two algorithms called WINEPI and MINEPI to discover frequent episodes (sets of events frequently appearing in an event sequences). These two algorithms have the same goal of finding episodes but these algorithms adopt different ways of counting how many times an episode appear. Thus, the output of the two algorithms is different. After the WINEPI and MINEPI algorithms were proposed, several other algorithms have been introduced to discover episodes more efficiently such as MINEPI+ and EMMA. Here I will explain the problem as it is defined for the EMMA algorithm. The paper proposing the EMMA algorithm is:
Huang, K., Chang, C.: Efficient mining of frequent episodes from complex sequences. Inf. Syst. 33(1), 96–114 (2008)
The goal of episode mining is to find frequentepisodes. An episode E is a sequence of event sets of the form E = <X1, X2, . . . , Xp>. This notation indicates that a set of events X1 occurred, was followed by another set of events X2, and so on, and finally followed by a set of events Xp.
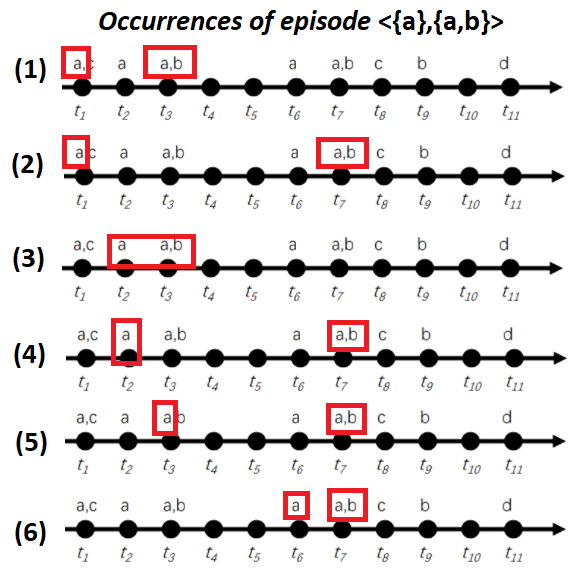
If we look at the sequence of Fig. 1 an example of episode is <{a},{a,b}> which contains two event sets: {a} and {a,b}. This episode <{a},{a,b}> means that the event “a” appears and is followed by the events “a” and “b” at the same time. This episode can observed many times in the example sequence of Fig. 1. Below, I have highlighted the six occurrences of that episode:
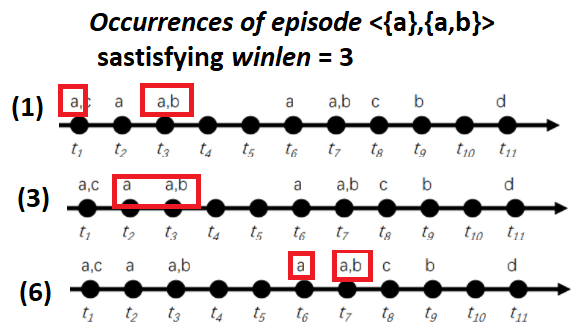
In the EMMA algorithm, the user must set two parameters to find frequent episodes. The first parameter is the window length (winlen). This parameter is used to filter out occurrences that are spanning over a too long period of time. For example, if the parameter winlen is set as winlen = 3, it means that we are only interested in counting the occurrences of episodes that last no more than 3 time units. In the above example, only three occurrences of episode <{a},{a,b}> satisfy this criterion:
For instance the first occurrence (1) has a duration of 3 time units., while the occurrence (3) has a duration of two time units.
The second parameter that must be set to find frequent episodes in a sequence is called the minimum support threshold (minsup). This parameter indicates the minimum number of occurrences that an episode must have to be considered as a frequent episode. Let say that this parameter is set to 3. Then the goal of episode mining is to find all frequent episodes that have at least three occurrences having a duration that is no more than winlen. The number of occurrences of an episode is called its support.
Before showing an example, I should also say that the EMMA algorithm has a particular way of counting occurrences. It is that if two or more occurrences start at the same timestamp, EMMA will count this as only one occurrence. For example, the occurrences (1) and (2) of episode <{a},{a,b}> are counted as only one occurrence because they both start at the timestamp t1. It was argued in the paper of EMMA that this counting strategy is more appropriate than the counting methods used by MINEPI and WINEPI for real applications.
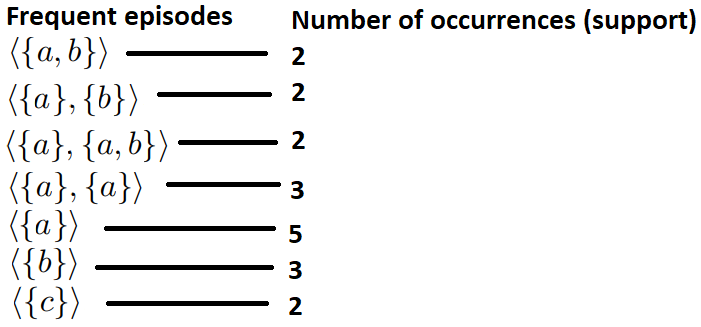
Now, let me show you what is the result of frequent episode mining with EMMA. For instance, if we apply EMMA on the above sequence with winlen = 2 and minsup = 2, the seven frequent episodes are discovered:
These frequent episodes indicate sequential relationships between events (or symbols) in the sequence. If we assume that the sequence of Fig. 1 is a sequence of events on a computer network, these patterns may be useful for someone doing the maintenance of the network, as it indicates for example that event “a” is often followed by events “a” or “b” within a short period of time.
An improvement: Top-K Frequent Episode Mining
Although frequent episode mining is useful, a problem is that it is not always intuitive to set the minsup parameter. For example, for some sequences setting minsup = 2 may result in finding only a few episodes while on other sequences, millions of episodes may be found for minsup = 2. But the user, typically dont have time to look at millions of episodes, and tuning the minsup parameter to just find enough episodes can be time-consuming (it is done by trial and error).
To address this issue, the task of frequent episode mining was recently redefined as the task of top-k frequent episode mining. Rather than using the minsup parameter, the user can direclty indicate the number of patterns k to be found, which is much more convenient and intuitive. The TKE algorithmis the first algorithm for discovering the top-k most frequent episodes in a sequence. It adopts the same definition of episode as the EMMA algorithm, which was presented above. But it let the user directly specify how many episodes must be discovered.
For example, if we run the TKE algorithm with k = 3 and winlen = 2, it is found that the top 3 most frequent episodes in the sequence of Fig. 1 are <{a},{a}>, <{a}> and <{b}>.
The TKE algorithm was presented in this paper:
Fournier-Viger, P., Wang, Y., Yang, P., Lin, J. C.-W., Yun, U. (2020). TKE: Mining Top-K Frequent Episodes. Proc. 33rd Intern. Conf. on Industrial, Engineering and Other Applications of Applied Intelligent Systems (IEA AIE 2020), pp. 832-845. [source code][ppt]
An extension: Episode Rules
Although frequent episodes are interesting for some applications, it is sometimes more desirable for decision making to find patterns that have the form of a rule such as IF something happensTHEN something else will happen.
To address this issue, several algorithms have been designed to find episode rules. The concept of episode rule is based on the concept of episode, as traditionally, episode rules are derived from frequent episodes. An episode rule was first defined by Manila and Toivonen (1995) as having the form X –> Y indicating that if an episode X is observed, it is likely to be followed by another episode Y.
To find interesting episode rules, several measures can be used. The two most popular are the support and confidence. The support of an episode rule X–> Y is the number of times that the rule appeared. The confidence of a rule X–> Y is the number of times that X is followed by Y, divided by the number of times that X was observed. Then, the task of episode rule mining is to find all the episode rules that appear at least minsup times and have a confidence that is no less than minconf, where minsup and minconf are parameters set by the user. Besides, as for frequent episode mining, it is expected that rules appear whithin a maximum window length (time duration) called winlen.
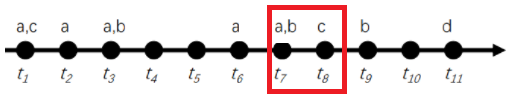
For instance, a rule can be <{a,b}> –> <{c}> indicating that event “a” and “b” appear together and are followed by “c”. If winlen = 2, then this rule has only one occurrence, shown below:
Thus, the support of that episode rule <{a,b}> –> <{c}> is said to be 1. Now, if we want to calculate the confidence of that episode rule, we need to also count the number of times that its antecedent, episode {a,b}, appears. There are two occurrences of episode {a,b}, displayed below:
The confidence of the episode rule <{a,b}> –> <{c}> is the number of times that <{a,b}> –> <{c}> appears divided by the number of times that <{a,b}> appears, that is 1 / 2 = 0.5. This means that 50 % of the times <a,b> is followed by <{c}>.
This is just a brief description of traditional episode rules. There is also another type of episode rules that has been recently proposed called partially-ordered episode rules and was argued to be more useful. The idea of partially-ordered episode rules comes from the observation that traditional episode rules require a very strict ordering between events. For example, the rule <{a,b}> –> <{c}> is viewed as different from <{a},{b}> –> <{c}>, or the rule <{b},{a}> –> <{c}>. But in practice, these three rules only have some small variations in the order between events, and may thus be viewed as describing the same relationship between events “a”, “b” and “c”. Based on this observation, the concept of partially-ordered episode rules was proposed. The aim is to simplify the rule format such that the ordering constraint between events in the left part of a rule is removed, as well as the ordering constraint between events in the right part of the rule. Thus, an episode rule has the form X –> Y where X and Y are two sets of events, but the events in X are unordered and the events in Y are also unoredered. For example, a partially ordered episode rule is {a,b} –> {c} which means that if “a” and “b” appear in any order, they will be followed by “c”. This rule replaces the three traditional rules mentioned previously and can thus provide a good summary to the user.
To discover episode rules, there are two ways. To discover traditional episode rules, the main approach is to first apply a frequent episode mining algorithms such as TKE, EMMA, WINEPI and MINEPI. Then, the episode rules are derived from these episodes by combining pairs of episodes. To discover partially-ordered episode rules, the process is slightly different. It is not required to first discover frequent episodes. Instead, rules are extracted directly from a sequence using a tailored algorithm such as POERM or POERMH. The POERM algorithm is presented in this paper:
Another popular extensions of the episode mining problem is high utility episode mining. This problem is a generalization of frequent episode mining where each event can be annotated with a utility value (a number indicating the importance of the event), and the goal is to discover episodes having à high utility (importance). An example of application of high utility episode mining is to find sequence of purchases made by customers that yield a high profit in a sequence of customer transactions.
If you are interested by this topic, you may check the HUE-SPAN algorithm which was shown to outperform previous algorithm. It is described in this paper:
Fournier-Viger, P., Yang, P., Lin, J. C.-W., Yun, U. (2019). HUE-SPAN: Fast High Utility Episode Mining. Proc. 14th Intern. Conference on Advanced Data Mining and Applications (ADMA 2019) Springer LNAI, pp. 169-184. [ppt] [software]
Software for episode mining
If you want to try episode mining with your data or do research on episode mining, the most complete software for episode mining is by far the SPMF data mining library.
SPMF is an open-source software implemented in Java, which has a simple user interface and can be called from the command line. Morevoer, there exists some unofficial wrappers to call SPMF from other programming languages such as Python. The SPMF library offers more than 200 algorithms for pattern mining, including a dozen algorithms for discovering frequent episodes such as TKE, MINEPI and EMMA, and also several algorithms for episode rule generation such as POERM. Besides, several algorithms for high utility episode mining are implemented such as HUE-SPAN.
SPMF also offers algorithms to find other types of patterns in sequences. For example, it is possible to find sequential patternsand sequential rules (patterns appearing in multiple sequences instead of only one sequence), and to find periodic patterns (patterns that are periodically appearing in a sequence). Other interesting tasks that can be done with a sequence is sequence prediction.
Conclusion
That is all for today. I just wanted to give a brief introduction about episode mining, as it is a fundamental task for analyzing sequences of events or symbols. If you have comments, please share them in the comment section below. I will be happy to read them.
—
Philippe Fournier-Viger is a full professor working in China and founder of the SPMFopen source data mining software.
This post presents the key papers about episode mining. If you are not familiar with what is episode mining, it is a data mining task, which aims at finding patterns in a sequence of events or symbols . A short introduction to episode mining is posted on my blog. Finding patterns in a sequence can be useful to discover regularities that may provide insights about the data, and even support decision making.
Below, I list the most important episode mining papers as a table with my comments on each paper to allow to get a quick overview of the field.
Note: that list is based on my analysis of the papers and is thus subjective and I may have missed some papers that other researchers would have deemed important.
Author and date
Paper title
Algorithm(s)
Key idea
Mannila et al. (1995)
Discovering frequent episodes in sequences
WINEPI, MINEPI
– This paper proposed the problem of episode mining. It is thus a key paper in that field. – A first algorithm called WINEPI finds episodes by performing a breadth-first search and using a sliding window. It counts the support (occurrence frequency) of an episode as the number of windows where the episode appears. However, WINEPIhas the problem that an occurrence may be counted more than once. – To address this issue, a second algorithm called MINEPI find frequent episodes by only considering the minimal occurrences of each episode. – This paper also presents a basic algorithm to generate episode rules by combining pairs of episodes. This is done as post-processing after applying WINEPI or MINEPI.
Huang et a. (2008)
Efficient mining of frequent episodes from complex sequences
EMMA, MINEPI+
– It is observed that window-based algorithms for episode mining such as MINEPI and WINEPI sometimes produce some strange results. – To address this issue, a novel measure is proposed to count the support (number of occurrences) of an episode called the head support or head frequency. – Two algorithms are designed to find frequent episodes using the head frequency: EMMA (a depth-first search algorithm) and MINEPI+ (a modified version of MINEPI)
– This paper makes the observation that it is difficult for users to set the minsup parameter for frequent episode mining. As a result users often have to spend considerable time fine tuning the parameters and may find too many or too few episodes. – As a solution this paper redefine the task of episode mining as top-k frequent episode mining, where the user can directly choose the number of patterns to be discovered (which is more intuitive). – The TKE algorithm is defined to efficiently find the top-k most frequent episodes.
Ao et al. (2018)
Online frequent episode mining
– This paper extended the concept of episode mining
Zhou et al. (2010)
Mining closed episodes from event sequences efficiently
Clo_episode
– This paper designed an algorithm to findclosed episodes. The goal is to reduce the number of episodes presented by only showing some episodes that are said to be closed. This gives sometimes a small set of episodes that summarizes the frequent episodes. – An algorithm is presented to find closed episodes called Clo_episode. This algorithm adopts a breadth-first search and use the concept of minimal occurrences. – A limitation: this paper cannot handle the case of multiple events happening at the same time (parallel episodes). while most algorithms can handle this case.
Tati and Cule (2011)
Mining closed episodes with simultaneous events
– This paper presents algorithms to find closed episodes where events may be simultaneous. – This fixes the main limitation of the paper of Zhou et al. (2010).
Laxman et al.(2007)
Discovering frequent episodes and learning Hidden Markov Models: A formal connection
– Laxman proposes to only count the non overlapping occurrences of episodes. – This counting method is called the non overlapping support or non overlapping frequency, and was then used in many other papers after.
Laxman et al. (2007)
A Fast Algorithm For Finding Frequent Episodes In Event Streams
Algorithm 1 and Algorithm 2
– This paper introduces an algorithms to find frequent episodes in a potentially infinite sequence of events (a data stream)
Oualid et al. (2021)
Mining Episode Rules from Event Sequences Under Non-overlapping Frequency
NONEPI
– This paper presents an algorithm named NONEPI for episode rule mining using the concept of non overlapping frequency. – The goal is to find rules that are easier to interpret as occurrences must be non overlapping.
– This paper makes the observation that traditional episode rules have a very strict ordering between events. – This paper defines are more general type of episode rules called partially-ordered episode rules. These rules loosen the ordering constraint between events. As a result, a partially-ordered episode rule can summarize multiple traditional episode rules. – The POERM algoriths is defined to find partially-ordered episode rules. It finds rules directly without first having to apply a frequent episode mining algorithm. – Another version of POERM called POERM_H was proposed in a subsequent paper “Mining Partially-Ordered Episode Rules with the Head Support“, where occurrences are counted using the head support of EMMA.
Fahed et al. (2018)
DEER: Distant and Essential Episode Rules for early prediction
DEER
– This paper presented an algorithm named DEER to find episore rules that can predict distant events rather than events that appear closely after other events. These rules are called essential rules. – The algorithm is based on the concept of minimal occurrences. – Limitation: thealgorithm does not handle the case of simultaneous events.
Wu et al. (2013)
Mining high utility episodes in complex event sequences
US-SPAN
– A problem with traditional episode mining algorithm is that all event types are considered as equally important. – To address this issue, the concept of utility is added to episode mining to define a new problem of high utility episode mining. – In that problem each event occurrence can have a quantity as well as a weight. This allows for example to model the purchases of customers with quantities and unit prices to find episodes that yield the most money (the highest utility). – An efficient algorithm called US-SPAN is proposed for this problem, which is based on the concept of minimal occurrences.
Fournier-Viger et al. (2019)
HUE-Span: Fast High Utility Episode Mining
HUE-SPAN
– This paper makes the important observation that the previous algorithm for high utility episode mining US-SPAN can underestimate the utilitiy of episodes by not taking into account all timestamps of minimal occurrences for utility calculations. As a result, some high utility episodes can be missed. – To address this issue, the definition of utility is modified. – Moreover, a new and more efficient algorithm named HUE-SPAN is proposed for high utility episode mining. – This algorithm is based on the concept of minimal occurrences.
Ao et al. (2018)
Large-scale Frequent Episode Mining from Complex Event Sequences with Hierarchies
LA-FEMH
– A big data algorithm for episode mining called LA-FEMH is proposed using the Spark architecture. – The algorithm can find closed and maximal episodes and also consider that events are organized as a taxonomy. – Limitation: This algorithm does not handle the case of simultaneous events. In other words, the algorithm can only find serial episodes.
– An algorithm called MaxFEM to find maximal episodes in a complex event sequence (the general case). – A version called AFEM to find all frequent episodes. – Those extends the EMMA algorithm with new optimizations and use the head support definition.
Implementations
There are very few software programs and source code available online for episode mining. The most complete software, which offers a dozen episode mining algorithms and is open-source is the SPMF data mining software (which I am the founder). It provides implementations of many algorithms such as MINEPI, EMMA, TKE, US-SPAN, POERM, and HUE-SPAN.
If you want to read a detailed survey paper about episode mining, you can also check this survey paper:
Ouarem, O., Nouioua, F., Fournier-Viger, P. (2023). A Survey of Episode Mining. WIREs Data Mining and Knowledge Discovery, Wiley, to appear.
Conclusion
In this blog post, I have given a list of key papers about episode mining. Of course, making such list is subjective. But I believe that this list can be useful for those who wants to learn quickly about episode mining by having a quick summary.
If you have enjoyed this blog post, you may also check other content of this blog. There are many posts and resources related to pattern mining.
In recent years, machine learning has become a popular research area of computer science. In this blog post, I will talk about what is machine learning.
What is machine learning?
Machine learning is computer programs (algorithms) that can learn to do a task by doing it or by learning it from some data. For example, a computer program can be designed to learn to play Chess by trying various moves and strategies against human players to select the most effective one (learning by experience). Or a program could be designed to learn the best Chess tactics from historical records of matches between human players (data).
What is the difference with artificial intelligence?
Another term that is often talked about in the media is artificial intelligence. So what is the difference between artificial intelligence and machine learning? Generally, artificial intelligence refers to computer programs that can do some task that requires intelligence (e.g. translating a document from English to French, writing a summary of a text, playing a game, composing some music). Some artificial intelligence program will be designed to learn from experience or data, and can thus be viewed as using machine learning. But there are also some other artificial intelligence programs that do not require learning. For example, one can build a program to play the game of Tic Tac Toe by explicitly writing the optimal rules for playing that game in the program. In this case, the program can use that knowledge base (rules) to play and does not need to learn. Thus, not all artificial intelligence programs need to learn, and machine learning can be viewed as a subset of artificial intelligence that represents the programs learn.
Why is machine learning popular?
There exists many machine learning techniques for making computer programs that can learn such as artificial neural networks, support vector machines and clustering. These techniques are popular because they can be used to create programs that learn to do some complicated tasks that would be otherwise very hard to build as a computer program by a human. For example, while it is extremely hard to program a computer to recognize objects in a video by hand or to translate a text accurately, these tasks can now be learned using machine learning techniques.
What are the applications of machine learning?
There are many applications of machine learning such as to play games, process video and audio data, translate documents, and recommend songs or movies to users of a website. Generally, each machine learning program is built to solve a specific task (e.g. playing the game of Go) rather than to solve many tasks. It is a major challenge to design machine learning programs that could learn many tasks.
What are some good books about machine learning?
Nowadays, many young researchers will directly focus on popular techniques such as deep learning. But in my opinion, one should try to have a broader picture of the field of machine learning as there are many other techniques. Some good book on machine learning in general are:
Pattern Recognition and Machine Learning by C. Bishop
Machine Learning by T. Mitchell
The Elements of Statistical Learning: Data Mining, Inference, and Prediction, Hastie et al.
Machine Learning: A Probabilistic Perspective – K. Murphy
Artificial Intelligence: A Modern Approach – Russell & Norvig
What is the relationship with data mining, big data and data science?
Another subfield of computer science that is popular nowadays is data mining, data science and big data. These terms generally refer to the use of algorithms to analyze data. There are generally two main goals to analyze the data: (1) understanding the data to learn something useful from the data (e.g. understanding the past, like why a tsunami occurred) and (2) predicting the future (e.g. predicting when the next tsunami will hit a country).
The data mining techniques that aim at making predictions using data can be viewed as a form of machine learning, while other techniques may just be viewed as method to analyze data. Thus, data mining can be viewed as intersecting with machine learning. If you want to know more about this, I wrote a blog post on the relationship between data mining and machine learning.
Conclusion
Hope that this blog post has been interesting! If you have any comments, please leave them in the comment section below.
In this blog post, I will talk about journal special issues. I will talk about how special issues of journals are organized and why it can be good to submit to or organize academic journal special issues.
What is a special issue of a journal?
First, I will explain some basic concepts about journals. An academic journal publishes papers written by researchers. These papers are generally published as part of an issue and a volume. An issue is a collection of multiple papers that may not be on the same topic, while a volume is a collection of one or more issues.
For example, a journal may publish an issue every month and four volumes per year. Thus, the first volume would contains the issues of January, February, March and April. Then, the second volume would contain the issues of May, June, July and August, and so on.
Volumes and issues are generally numbered as 1,2,3…. But it is to be noted that some journals do not follow this. For example, some journal will name volumes according to years such as volume 2021 for the year 2021. Moreover, some journals only group papers by volumes and don’t have issue numbers.
Having explained that, what is a special issue? A special issue is a group of papers that are generally on the same topic. For example, a journal may publish a special issue on pattern miningwhere all the papers are about this topic. There are also some conferences that will organize special issues in a journal that will contain the best papers of the conference. In that case, the paper of the special issue may not be on the same topic but are grouped based on another criterion.
Each journal has one or more editors that take care of managing the review process of papers by doing some tasks such as inviting reviewers, reading the recommendations of reviewers and deciding to accept, revise or reject papers. For special issues, the papers are generally handled by some guest editors rather than the regular editor(s) of the journal. This means that some researchers are responsible of the special issue, and those researchers are called “guest” because they do not usually work for the journal.
How are the special issues organized?
Generally, the special issues are organized by researchers that talk with the main editor of the journal and ask to organize a special issue in that journal on a specific topic. Then, if the editor accepts, the special issue will be created and there will be some advertisement to invite authors to submit papers to the special issue. A special issue may be open for several months, which means that authors may have several months to write a paper and submit it to a given special issue. When a paper is received for a special issue, it is the guest editors of the special issue that will organize its review.
To propose a special issue, several journals will require to submit a special issue proposal explaining the topic of the special issue, the reasons why the topic is timely, the background of the guest editors, etc. Some journals will receive many such proposals and will only organize a few special issues.
Why organizing special issues?
Journals typically organize special issues to attract papers on emerging or trending topics, as this is what will bring more papers and also citations. For example, a journal may organize a special issue about machine learning for analyzing the COVID19 genomeas COVID is now a popular topic. Generally, journals do not like to organize special issues on old topics.
For a journal, special issues can help to bring more papers. This is the reason why some young journals will organize many special issues, while some top journals will rarely organize special issues. Thus a young journal is more likely to accept a proposal for making a special issue than a popular journal, who may just ignore them.
Why researchers want to organize special issues?
There are several reasons. First, it shows that a researcher is able to organize things and it gives editorial experience to a researcher about how to manage papers in a journal. This may latter help a researcher when applying to organize other things such as a workshop, a book or a position in a journal. Second, it gives visibility to a researcher and may help build connections with other researchers.
There are also some researchers that will try toabuse the concept of special issue by organizing many special issues and accepting the papers of their friends in exchange for their papers being in turn accepted in other special issues. This is something unethical that some people do. I have noticed this on websites like DBLP. I will not give any names but I found that some researchers always publish in some special issues of their friends. This does not look good and should be avoided. A researcher should always avoid conflicts of interest and be honest.
Why researchers publish in special issues?
A main reason for a researcher to publish in a special issue is to be part of an issue where all papers are on the same main topic. This will thus give visibility to the paper. For example, a special issue on periodic pattern miningmay publish numerous papers on that topic.
Another reason why a researcher may choose to publish in a special issue is that often the review process is faster and sometimes there is a higher chance for a paper to be accepted than if the paper was submitted as a regular paper to the journal. This is for example often the case for special issues about the best papers of a conference. In that case, maybe 14 papers may be invited and 10 or more will be accepted.
Conclusion
In this blog post, I talked about the concept of special issue for academic journals. I gave an overview about why publish in and organize special issues can be interesting for researchers. Hope it has been interesting. Feel free to leave some comments below!