
In this blog post, I will introduce the popular data mining task of clustering (also called cluster analysis). I will explain what is the goal of clustering, and then introduce the popular K-Means algorithm with an example. Moreover, I will briefly explain how an open-source Java implementation of K-Means, offered in the SPMF data mining library can be used.
What is clustering?
Clustering is one of the most fundamental data mining tasks.
Consider that you have a database, containing several records (which we will call instances). For example, consider the following database describing several bank customers.
AGE     NATIONALITY    INCOME   GENDER   ACCOUNT_BALANCE  ...
25      Canada          3000     M         50
42      Brazil          4000     F         500
...
In this example, each instance (customer) is described according to some attributes such as age, nationality, income, gender, and account_balance.
The goal of clustering is to automatically find groups of instances (e.g. customers) that are similar in a database. For example, for the database of bank customers, clustering the customers, consists of automatically grouping the customers that have a similar profile. For example, a clustering algorithm could perhaps find that many female customers who are rich have a similar profile or that many young Canadians with a low income have a similar profile (this is just an example).
Thus, the goal of clustering is to find groups of instances having similar characteristics in a database. These groups of instances found by clustering are called clusters. Thus, the goal of clustering is to find clusters of similar instances.
Let’s have a look at a second example before giving a more formal definition of what is clustering. This time, we will consider a database of 2D points. Consider the following database containing 31 two dimensional points.
| Instance 1 | (1,1) | Instance 17 | (16, 16) |
| Instance 2 | (0,1) | Instance 18 | (11.5, 8) |
| Instance 3 | (1,0) | Instance 19 | (13, 10) |
| Instance 4 | (11,12) | Instance 20 | (12, 13) |
| Instance 5 | (11, 13) | Instance 21 | (14, 12.5) |
| Instance 6 | (13, 13) | Instance 22 | (14.5, 12.5) |
| Instance 7 | (12, 8.5) | Instance 23 | (14.5, 11.5) |
| Instance 8 | (13, 8) | Instance 24 | (15, 10.5) |
| Instance 9 | (13, 9) | Instance 25 | (15, 9.5) |
| Instance 10 | (13, 7) | Instance 26 | (12, 9.5) |
| Instance 11 | (11, 7) | Instance 27 | (10.5, 11) |
| Instance 12 | (8, 2) | Instance 28 | (10, 10.5) |
| Instance 13 | (9, 2) | Instance 29 | (9, 3) |
| Instance 14 | (10, 1) | Instance 30 | (9, 4) |
| Instance 15 | (7, 13) | Instance 31 | (9,5) |
| Instance 16 | (5, 9) |
Each instance (point) in this database is described by two attributes: the X and Y coordinates. This database can be represented visually usually a XY chart:
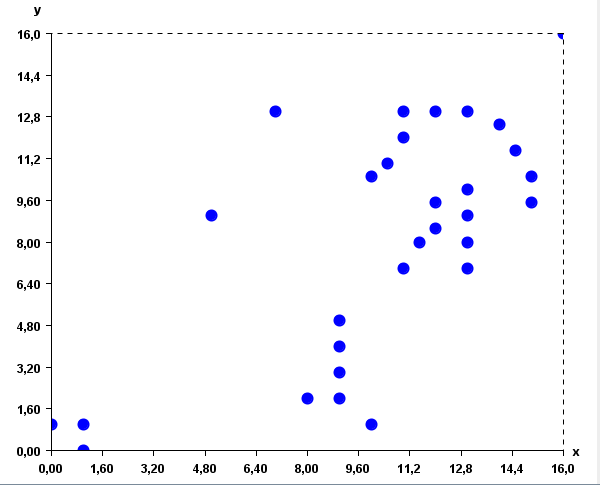
It can be observed in these figures that some points are quite close, while some other points are quite far away. In this context, the goal of clustering is to find groups of points that are similar (close to each other). By applying a clustering algorithm such as K-Means, three clusters could be found (represented by the blue, red and green colors):
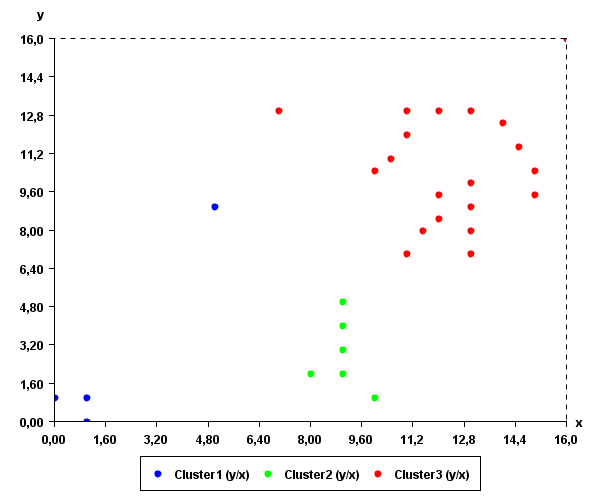
Intuitively, these clusters somewhat make sense as they are groups of points that are close to each other.
Clustering has many applications. It can be used for example to cluster similar documents in categories (for example, automatically classifying news on a website into categories).
Clustering algorithms
To perform clustering, it is necessary to apply a clustering algorithm. There exists hundreds of clustering algorithms to find hidden clusters in data. Different algorithms have different advantages and disadvantages and can be more or less suitable to different types of data. Some of the most popular algorithms are for example K-Means and DBScan.
In the following paragraphs, I will briefly explain how the K-Means algorithms works.
The K-Means algorithm
The K-Means algorithm was proposed in 1967 by MacQueen. This algorithm has two main parameters: (1) a database, (2) a positive integer K representing the number of clusters to be extracted from the database.
The K-Means algorithm consists of the following steps:
(1) The algorithm reads the database in memory. The database contains several instances.
(2) The algorithm initialize K empty clusters. Each cluster has a prototype, which is a randomly generated instance.
(3) Each instance in the database is assigned to the cluster having the closest prototype.
(4) Then, the prototype of each cluster is recomputed as the average of all the instances in that cluster.
(5) Then, Step3 and Step 4 are repeated several times, until the clusters become stable.
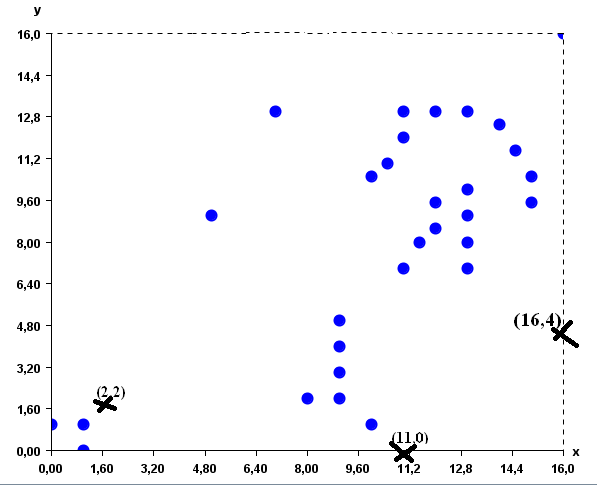
Now let me illustrate these steps with an example so that it becomes clear. By applying K-Means on the database of 2D points, (1) K-Means will first load the database of 31 points in memory. Then, assume that the user has set K = 3 to generate 3 clusters. (2) K-Means will initially create three empty clusters which will have some random points as prototypes. Let say that these three points (prototypes) are (2,2), (16, 4) and (11, 0) . We can represent this visually as follows (where the prototypes are represented by the X symbol):
Then (3) K-means will assign each of the 31 points to the cluster having the closest prototype. The result will be as follows:
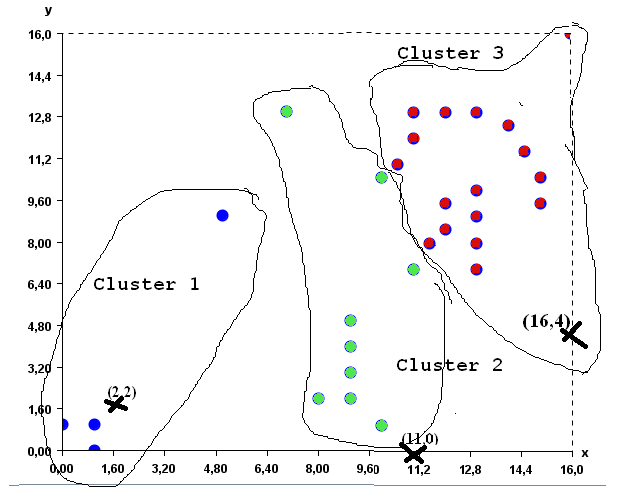
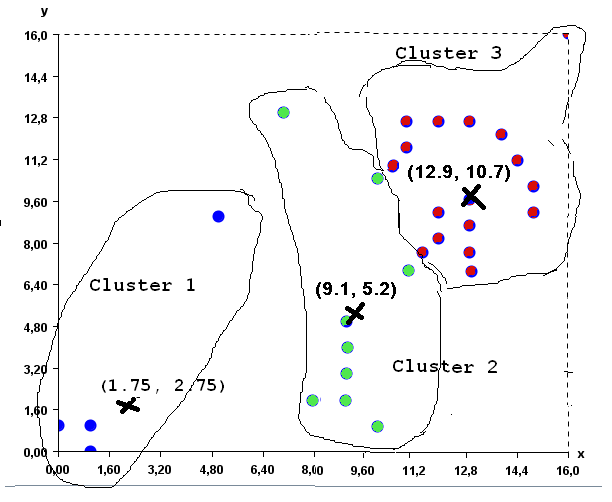
Then (4) the prototype of each cluster is recomputed as the average of the points that it contains. The new prototypes are approximately (1.75, 2.75), (9.1, 5.2) and (12.9, 10.7) for the three clusters of points.
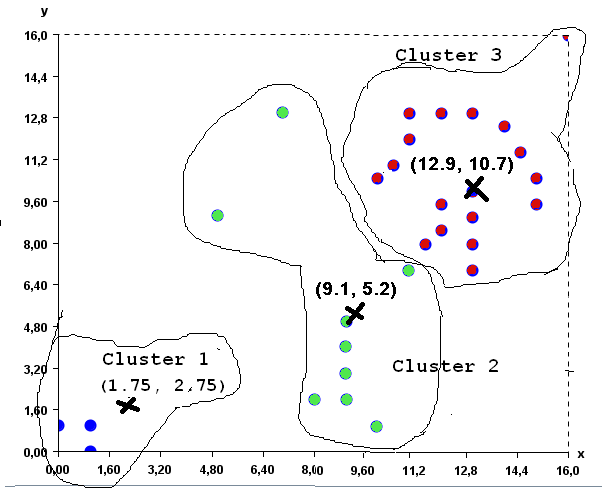
Then (3), each point is assigned to the cluster having the closest prototype. The result is the clusters shown in the picture below. As you can see, some points have moved from one cluster to another.
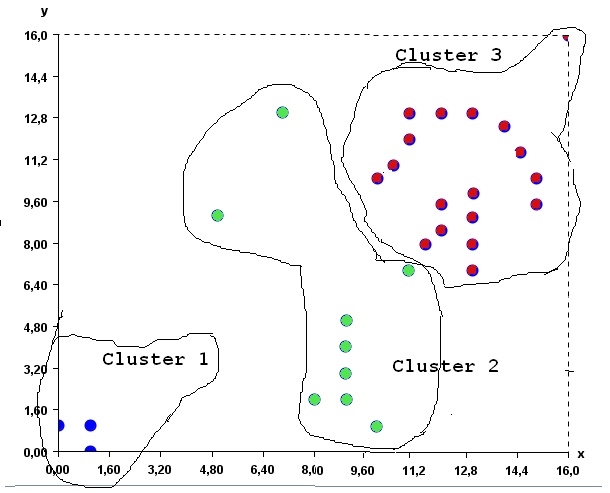
Then, step (4) is applied again to recompute the prototype of each cluster as the average of its points. The new prototypes are (0.7, 0.7), (12.4,10.8) and (8.7,4.1).
Then step (3) is applied again. K-Means assigns each point to the cluster having the closest prototype. Since the cluster did not change after this step, the K-Means algorithms stop and the final result is the following three clusters, here displayed with colors:
An open-source Java implementation of K-Means
If you want to try the K-Means algorithm with the above example by yourself, a Java implementation of K-Means is provided in the SPMF library.
To run the example, you will need to have Java 1.8 or higher installed on your computer.
(1) The first step is to download the database of points, which can be obtained here:
https://www.philippe-fournier-viger.com/spmf/inputDBScan2.txt
(2) Then, you will need to download the release version of SPMF, which is a file called spmf.jar, and can be obtained from the download page of SPMF.
(3) Then, double-click on the file spmf.jar to launch SPMF. If it does not work, it means that there is a problem with the Java installation on your computer. If it works correctly, the user interface of SPMF should open:
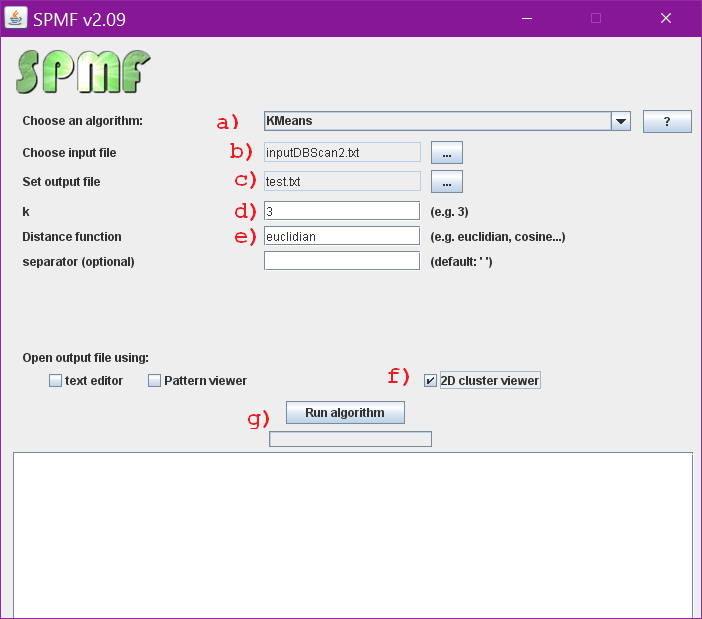
- (A) choose the KMeans algorithm in the combo box.
- (B) choose the input file as “inputDBScan2.txt”
- (C) set the output file as “text.txt”. The output of the algorithm will be written to that file.
- (D) Set the parameter K to 3
- (E) To be able to calculate how similar the instances are close to each other, we need to specify a distance function. For this example, we should use the Euclidian distance, as it is the typical distance function for comparing 2D points.
- (F) Select the “cluster viewer” to see the results as a chart.
- (G) Click the “Run algorithm” button” to launch the K-Means algorithm.
The result will be displayed in a window, such as this:
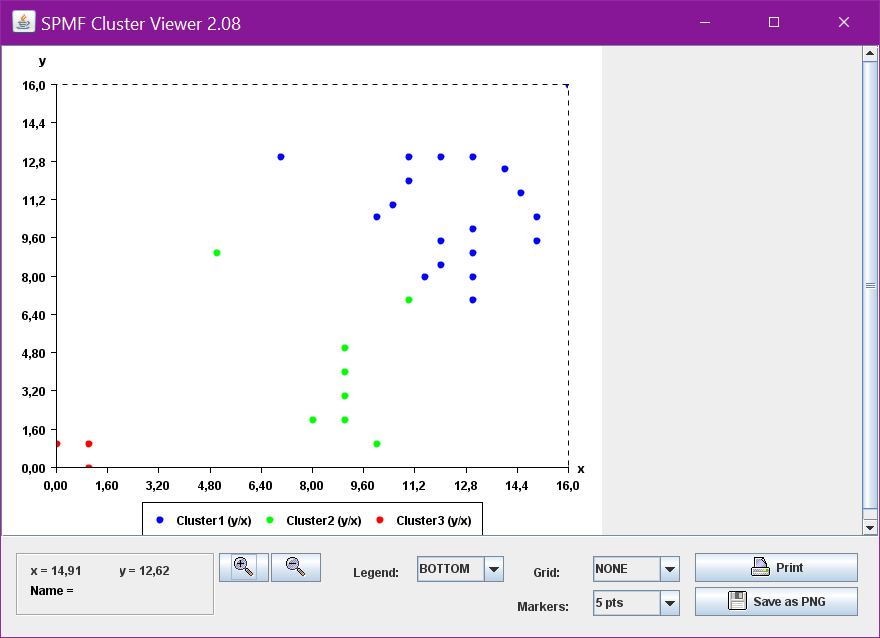
Note that it is quite possible that the result that you will obtain is not exactly the same. The reason is that K-Means is a randomized algorithm. In other words, K-Means utilize random numbers. Thus, if K-Means is run several times, it may not always generate the same result.
Why is the K-Means algorithm popular?
Having presented the K-Means algorithm, let’s now briefly discuss its characteristics in more details. Why is K-Means popular? The main reason is that it is a very simple algorithm. It is easy to implement and also easy to understand.
Some drawback of the K-Means algorithms is that the final result depends on how the initial prototypes are selected randomly. If we are lucky, we may find some nice clusters as in the above example, that somewhat make sense. However, if the initial points are not chosen in an appropriate way, the result may not be meaningful. There exists various solutions to this problem such as running K-Means several times, and then to choose the best set of clusters.
Another limitation of K-Means is that the user must explicitly specify the number of clusters to be found (the K parameter). But finding the best value for the K parameter may require to try several values.
To address these limitations various extensions of K-Means have been proposed. Besides, many other clustering algorithms have been proposed.
Conclusion
This blog post has given an overview of the task of clustering, a fundamental data mining task. The goal was to give a simple introduction. The post has explained how the K-Means algorithm works and has shown how to use the SPMF implementation of K-Means. In a future blog post, I will explain the DBScan clustering algorithm, which is also offered in SPMF.
For the interested reader, a good introduction to clustering can be found in the book “Introduction to data mining” by Tan, Steinbach and Kumar. The first chapter about clustering is freely available here.
By the way, you can also try a demo version of k-means in your browser for teaching purpose with the K-Means demo tool.
Philippe Fournier-Viger is a full professor and also the founder of the open-source data mining software SPMF, offering more than 110 data mining algorithms. If you like this blog, you can tweet about it and/or subscribe to my twitter account @philfv to get notified about new posts.


Pingback: K-Means Interactive Demo in your browser | The Data Blog